Gold Trading Strategy XAUUSD August 6, 2025Gold Trading Strategy XAUUSD August 6, 2025:
Spot gold edged lower in Asian trading yesterday (August 5), currently trading around $3,380/ounce. On Tuesday, the US ISM Services PMI came in at 50.1, below the forecast of 1.4 and below the previous month's reading of 0.7; the news sent gold prices soaring in the US session.
Fundamentals: Gold prices surged after weak jobs data increased the likelihood of a rate cut by the Federal Reserve. Data released last Friday showed that the number of new jobs in the US non-farm sector was much lower than expected, indicating a sharp deterioration in the labor market. The probability of the Fed cutting interest rates in September increased to 87%, up from 63% last week.
Technical analysis: Gold price is still in the uptrend channel in the H1 frame, the 3365 - 3370 area is supporting the gold price to continue following the price channel. If the gold price continues to fluctuate according to the price channel, the next prospective area could be 3400 - 3405 or even 3420 - 3425. However, the RSI and MA lines have shown signs that the buyers are weakening, so the gold price is very likely to have a strong correction from today until the end of the week.
Important price zones today: 3365 - 3370, 3400 - 3405 and 3420 - 3425.
Today's trading trend: SELL.
Recommended order:
Plan 1: SELL XAUUSD zone 3403 - 3405
SL 3408
TP 3400 - 3390 - 3380 - 3350 - OPEN.
Plan 2: SELL XAUUSD zone 3423 - 3425
SL 3428
TP 3420 - 3420 - 3400 - 3380 - OPEN.
Plan 3: BUY XAUUSD zone 3365 - 3367
SL 3362
TP 3370 - 3380 - 3390 - 3400.
Wish you a safe, successful and profitable trading day.🥰🥰🥰🥰🥰
Sell-signals

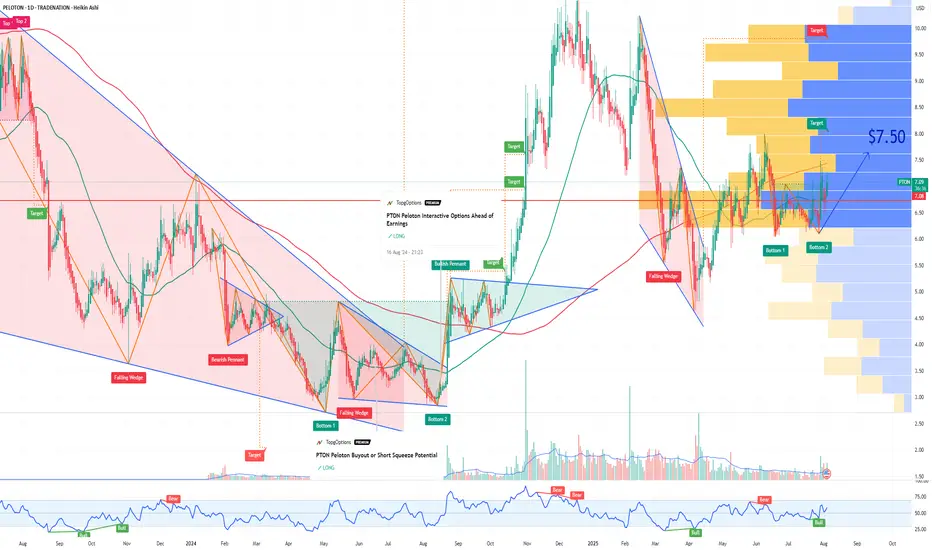
PTON Peloton Interactive Options Ahead of EarningsIf you haven`t bought the dip on PTON:
Now analyzing the options chain and the chart patterns of PTON Peloton Interactive prior to the earnings report this week,
I would consider purchasing the 7.50usd strike price Calls with
an expiration date of 2025-8-8,
for a premium of approximately $0.46.
If these options prove to be profitable prior to the earnings release, I would sell at least half of them.
Disclosure: I am part of Trade Nation's Influencer program and receive a monthly fee for using their TradingView charts in my analysis.
Gold Trading Strategy XAUUSD August 4, 2025Gold Trading Strategy XAUUSD August 4, 2025:
Gold prices rose more than 2% last Friday, hitting a one-week high, as weaker-than-expected US non-farm payrolls data boosted hopes for a Federal Reserve rate cut and the announcement of new tariffs fueled safe-haven demand for gold.
Fundamental news: The non-farm payrolls report showed only 73,000 jobs added in July, well below market expectations of 110,000. The unemployment rate rose to 4.2%, indicating a cooling labor market.
Technical Analysis: Gold prices are rising strongly after a strong candle in the 3285 - 3300 area as previously predicted. The bullish pattern on the H1 frame has shown that the buyers are returning very strongly. Currently, the price is showing signs of sideway at the 336x area, our strategy today will be to wait for trading at the support zones of the gold price. Important price zones today: 3315 - 3320 and 3330 - 3335.
Today's trading trend: BUY.
Recommended orders:
Plan 1: BUY XAUUSD zone 3330 - 3332
SL 3327
TP 3335 - 3345 - 3355 - 3370.
Plan 2: BUY XAUUSD zone 3318 - 3320
SL 3315
TP 3323 - 3333 - 3343 - 3363.
Plan 3: SELL XAUUSD zone 3370 - 3372
SL 3375
TP 3367 - 3357 - 3347 - 3337 (small volume).
Wishing you a safe, smooth and profitable trading week.💗💗💗💗💗

Gold’s Next Move: Bounce or Breakdown?Gold is pulling back after breaking the 3,360 USD resistance on the 6-hour chart. Price is currently testing the nearest fair value gap (3,370–3,380), but upside momentum is stalling, partly due to unfilled supply zones above.
A retest of the lower FVG near 3,340 will be key. Holding above this level could trigger renewed buying, while a break below may invalidate the bullish structure.
Traders should closely monitor whether downside gaps continue to fill and how price behaves near support zones. Lack of strong liquidity could lead to a false breakout.

EUR/USD: A Fragile Rebound Within a Broader Bearish TrapEUR/USD has managed to stage a slight recovery after plunging through the key 1.1680 support — a level that had held firm for two weeks. The pair is now hovering just above 1.1500, but the bounce appears shallow and unconvincing. Volume remains low, momentum indicators offer little confirmation, and the broader structure still points to a prevailing downtrend.
On the H2 chart, price has rebounded from the 1.1505 area — a minor support formed during July's short-term consolidation. Yet, the EMA slope remains strongly negative, and RSI is struggling below the neutral 50 mark after exiting oversold territory. The structure continues to display classic lower highs and lower lows, with the 1.1585–1.1600 zone emerging as a potential resistance area for bears to re-enter.
From a macro perspective, the U.S. dollar remains supported by expectations that the Fed will maintain a hawkish stance, fueled by solid GDP, durable goods, and PCE data. In contrast, the Eurozone struggles with signs of stagnation, with both services and manufacturing PMIs deteriorating — most notably in Germany. This policy divergence continues to favor the greenback.
Unless bulls manage to decisively reclaim the 1.1600 zone with strong follow-through buying, any rebound risks being nothing more than a dead cat bounce. The downside target remains near 1.1460 – 1.1440 in the near term.

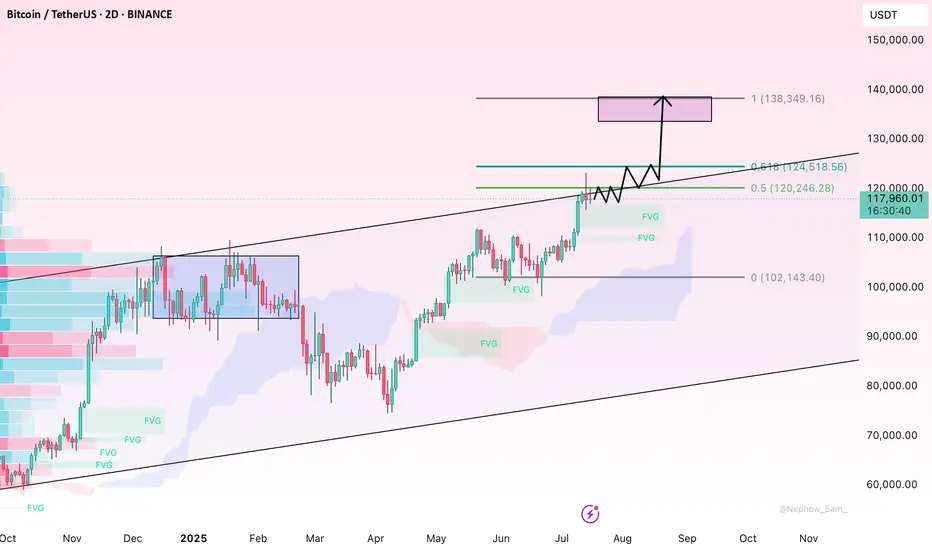
BTC Consolidates Below Key Resistance – Is a Breakout Imminent?Bitcoin is currently consolidating beneath the major psychological resistance near $120,000. The medium-term trend remains bullish, supported by a series of higher highs and higher lows. However, recent candlesticks with long upper wicks reflect hesitation among buyers at elevated levels, pointing to potential exhaustion in short-term momentum.
Despite this, there are no clear signs of bearish divergence or strong reversal patterns. The sideways range between $112,000–$120,000 likely represents a healthy consolidation phase after a strong rally. If the price maintains support around $113,000 and breaks above $120,000 with convincing volume, the next leg higher could follow swiftly.
For now, buyers remain in control, provided BTC holds key structural supports. A breakout confirmation is crucial for bullish continuation.

IBM International Business Machines Options Ahead of EarningsIf you haven`t bought IBM before the rally:
Now analyzing the options chain and the chart patterns of IBM International Business Machines prior to the earnings report this week,
I would consider purchasing the 290usd strike price Puts with
an expiration date of 2025-9-19,
for a premium of approximately $17.30.
If these options prove to be profitable prior to the earnings release, I would sell at least half of them.
Disclosure: I am part of Trade Nation's Influencer program and receive a monthly fee for using their TradingView charts in my analysis.

LVS Las Vegas Sands Options Ahead of EarningsIf you haven`t bought LVS before the rally:
Now analyzing the options chain and the chart patterns of LVS Las Vegas Sands prior to the earnings report this week,
I would consider purchasing the 48.5usd strike price Puts with
an expiration date of 2025-7-25,
for a premium of approximately $1.22.
If these options prove to be profitable prior to the earnings release, I would sell at least half of them.
Disclosure: I am part of Trade Nation's Influencer program and receive a monthly fee for using their TradingView charts in my analysis.

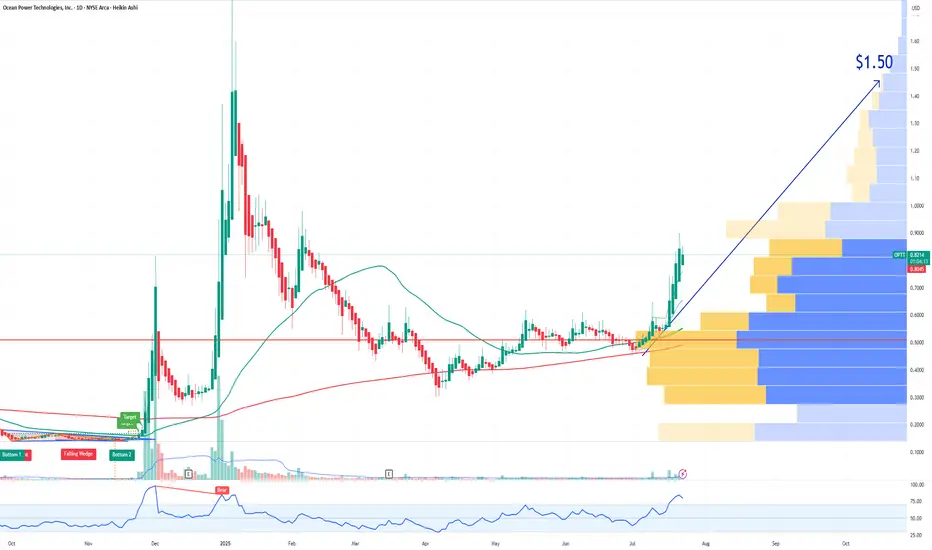
OPTT Ocean Power Technologies Options Ahead of EarningsAnalyzing the options chain and the chart patterns of OPTT Ocean Power Technologies prior to the earnings report this week,
I would consider purchasing the 1.50usd strike price Calls with
an expiration date of 2025-11-21,
for a premium of approximately $0.25.
If these options prove to be profitable prior to the earnings release, I would sell at least half of them.
BTC Nears $120K – Pullback Risk or Breakout Launchpad?Bitcoin has rallied strongly after breaking its multi-week consolidation, now hovering just under the key psychological and historical resistance at $120K. The daily chart shows price floating above the 20EMA, with no signs of distribution—yet. However, the dense liquidity pocket between $110K–$114K remains a magnet in case of a technical pullback.
If bulls defend $118K and price cleanly breaks above $121K with strong volume, the next target lies in the $125K–$128K zone. Spot ETF inflows remain healthy, and any dovish pivot from the Fed could set off another crypto-wide bull wave.
UAL United Airlines Holdings Options Ahead of EarningsIf you haven`t exited UAL before the recent selloff:
Now analyzing the options chain and the chart patterns of UAL United Airlines Holdings prior to the earnings report this week,
I would consider purchasing the 92.5usd strike price Calls with
an expiration date of 2025-9-19,
for a premium of approximately $5.12.
If these options prove to be profitable prior to the earnings release, I would sell at least half of them.

Arbitrage Opportunity!I believe I’ve identified an arbitrage opportunity involving the DEFI cryptocurrency: it trades at $0.003200 on Bybit, compared to only $0.002390 on MEXC.
I recall encountering a similar situation with Shiba Inu, when the price gap between Binance and Coinbase was as high as 8X. Feel free to play the chart below to see the outcome:
I also remember the 2016–2017 period, when such arbitrage opportunities existed even with Bitcoin, due to price discrepancies between Asian exchanges and those available to European traders.

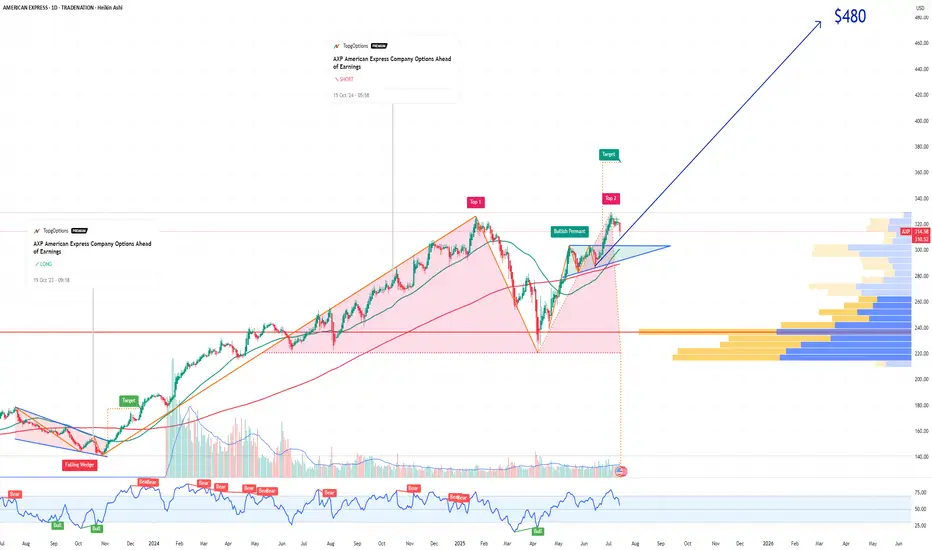
AXP American Express Company Options Ahead of EarningsIf you haven`t bought AXP before the rally:
Now analyzing the options chain and the chart patterns of AXP American Express Company prior to the earnings report this week,
I would consider purchasing the 480usd strike price Calls with
an expiration date of 2027-1-15,
for a premium of approximately $6.25.
If these options prove to be profitable prior to the earnings release, I would sell at least half of them.
Disclosure: I am part of Trade Nation's Influencer program and receive a monthly fee for using their TradingView charts in my analysis.
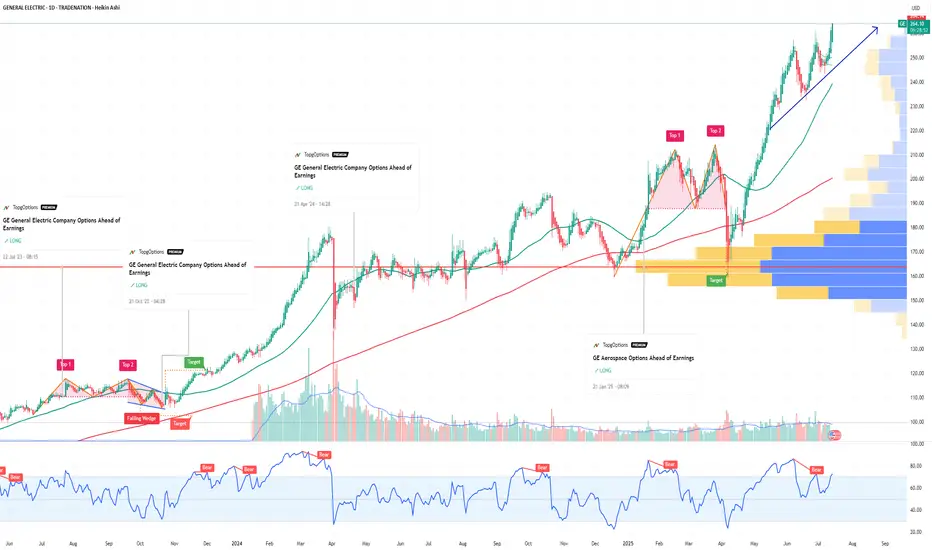
GE Aerospace Options Ahead of EarningsIf you haven`t bought GE before the rally:
Now analyzing the options chain and the chart patterns of GE Aerospace prior to the earnings report this week,
I would consider purchasing the 270usd strike price Calls with
an expiration date of 2025-8-15,
for a premium of approximately $8.60.
If these options prove to be profitable prior to the earnings release, I would sell at least half of them.
Disclosure: I am part of Trade Nation's Influencer program and receive a monthly fee for using their TradingView charts in my analysis.
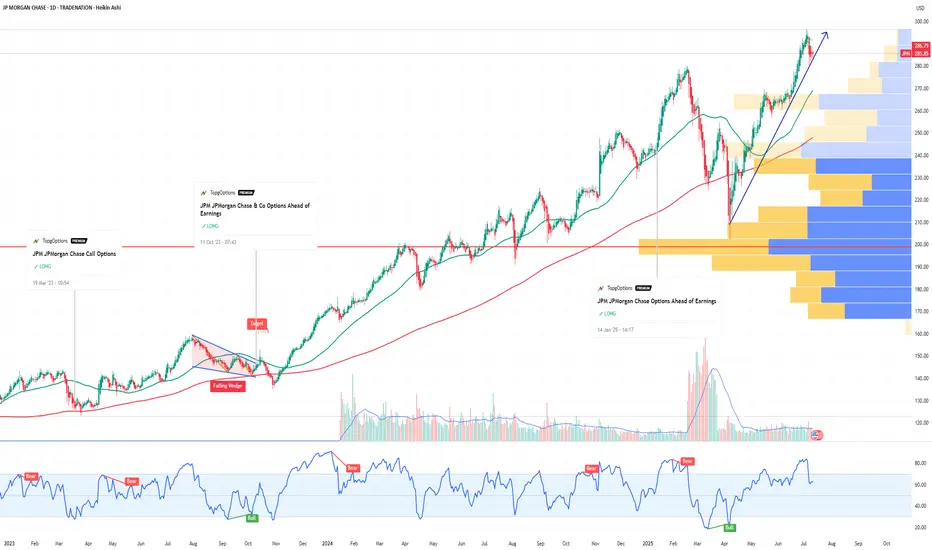
JPM JPMorgan Chase & Co Options Ahead of EarningsIf you haven`t bought JPM befor the rally:
Now analyzing the options chain and the chart patterns of JPM JPMorgan Chase & Co prior to the earnings report this week,
I would consider purchasing the 290usd strike price Calls with
an expiration date of 2026-1-16,
for a premium of approximately $20.20.
If these options prove to be profitable prior to the earnings release, I would sell at least half of them.
Disclosure: I am part of Trade Nation's Influencer program and receive a monthly fee for using their TradingView charts in my analysis.
Why IonQ (IONQ) Could Be the NVDA of Quantum ComputingIf you haven`t bought IONQ before the rally:
Now you need to know that IonQ isn’t just another speculative quantum stock — The company is building a robust ecosystem around its best‑in‑class trapped‑ion architecture and targeting fault‑tolerant, networked quantum systems. With record bookings, major acquisitions, and a strong balance sheet, IonQ could emerge as the NVIDIA equivalent for quantum infrastructure.
Key Bullish Arguments
1) Superior Quantum Tech – Trapped‑Ion Advantage
IonQ’s trapped-ion processors boast 99.9% two-qubit fidelity, demonstrating higher accuracy and scalability than superconducting alternatives
These systems also operate at room temperature, meaning simpler deployment and lower costs
2) Ecosystem Strategy & Acquisitions
The $1.08B acquisition of Oxford Ionics (expected close in 2025) expands IonQ’s qubit control tech, pushing toward planned 80,000 logical‑qubit systems by decade’s end
Combined with ID Quantique and Lightsynq, IonQ is building a full-stack quantum and networking offering
3) Strong Revenue Growth & Cash Runway
Revenue soared from $22M in 2023 to $43.1M in 2024, with bookings of $95.6M
. Q1 2025 saw $7.6M revenue and EPS –$0.14, beating expectations; cash reserves near $697M provide years of runway
4) Real Commercial Deployments
IonQ sold its Forte Enterprise quantum system to EPB ($22M deal) for hybrid compute and networking, marking real-world commercial applications
5) AI & Quantum Synergy
Involvement in NVIDIA’s Quantum Day and hybrid quantum‑classical AI demos (e.g., blood pump simulation with Ansys, ~12 % faster) indicates strategic synergy and positions IonQ as a critical piece in the future AI stack
Recent Catalysts:
Texas Quantum Initiative passes – positions IonQ at forefront of U.S. state-backed innovation
Oxford Ionics acquisition pending – major expansion in qubit scale & tech
Barron’s analyst buys – industry analysts see long-term potential; IonQ among top quantum picks
Broader quantum optimism – McKinsey & Morgan Stanley forecasts highlight synergy between quantum and AI, benefiting IonQ

QQQ Nasdaq 100 Year-End Price Target and Technical Rebound SetupIf you haven`t bought the previous oversold area on QQQ:
Now the Nasdaq-100 ETF (QQQ), which tracks the performance of the largest non-financial companies in the Nasdaq, has recently entered oversold territory, suggesting that a technical rebound may be imminent. Similar to the Russell 2000, QQQ has experienced significant selling pressure, driving key technical indicators into oversold zones and creating favorable conditions for a bounce.
The Relative Strength Index (RSI) has dropped below 30, a level that typically signals oversold conditions and the potential for a reversal. Additionally, QQQ is trading near key support levels, with a large portion of its components underperforming their 50-day and 200-day moving averages — a classic setup for a mean reversion rally.
From a historical perspective, QQQ has shown a tendency to rebound strongly after similar oversold conditions, particularly when macroeconomic factors stabilize and buying pressure returns. Given the current technical setup, my price target for QQQ is $550 by the end of the year. This represents a recovery of approximately 8-10% from current levels, aligning with previous post-oversold rallies in the index.
While downside risks remain — including potential volatility around Federal Reserve policy and broader economic data — the technical backdrop suggests that QQQ is well-positioned for a recovery in the coming months.

GME GameStop - A Crypto Proxy with Surprise UpsideIf you haven`t bought GME before the previous rally:
Why GME Could Rally by Year-End 2025:
1. Hidden Bitcoin Exposure
GameStop recently revealed it holds a significant amount of Bitcoin on its balance sheet — quietly positioning itself as a crypto proxy in the equity markets.
While not a traditional miner or crypto company, GME gives exposure to BTC upside without being a pure-play crypto stock.
With Bitcoin aiming for new highs in 2025, any company with BTC on its books becomes more valuable — just as we saw with Tesla and MicroStrategy in prior cycles.
2. Retail Speculation and Meme Momentum
GME has always been a retail-fueled stock, and retail interest is surging again in crypto and meme trades.
As crypto enters a new speculative phase, GME could benefit from a reflexive feedback loop: BTC goes up → GME gains attention → more retail FOMO → GME rises.
Recent reappearance of figures like Roaring Kitty has reignited interest — and if crypto sentiment stays hot, GME could ride that wave.
3. Lean Balance Sheet and Optionality
After multiple share offerings, GameStop is flush with cash and minimal debt — giving it financial flexibility.
Holding BTC enhances its treasury strategy during inflationary or weak-dollar cycles.
This also gives it optionality to enter Web3, NFTs (again), or even blockchain gaming — areas where its brand could carry weight.
Technical Setup
GME is consolidating above key support in the $20–23 zone, forming a potential bull flag or base for another breakout.
Any breakout in Bitcoin or renewed meme-stock energy could push GME to test $35–40, or even $50+ if momentum returns.
Final Thoughts
GME may not be a traditional crypto stock, but it’s now quietly tied to Bitcoin performance. With crypto heating up and retail risk appetite returning, GameStop becomes a speculative bet on BTC, memes, and volatility — all in one ticker.
Disclosure: I am part of Trade Nation's Influencer program and receive a monthly fee for using their TradingView charts in my analysis.

Baidu ($BIDU): China’s Google Is Ready to Break OutIf you haven`t bought BIDU on the previous dip:
What you need to know now:
1. Baidu = The Google of China
Baidu dominates China’s search engine market, holding over 60% market share, making it the Google equivalent in the world's second-largest economy.
Its advertising business is deeply entrenched in Chinese internet infrastructure.
As digital ad spending rebounds in China, Baidu’s core business benefits directly.
2. AI and Autonomous Driving Moonshots
Baidu is China’s national AI champion, pouring billions into next-gen technologies:
Ernie Bot (Baidu’s ChatGPT competitor) is now integrated across its ecosystem and enterprise offerings.
Apollo Go, Baidu’s autonomous driving platform, already operates robo-taxis in multiple Chinese cities and has received licenses for fully driverless operations.
Baidu also provides AI cloud services, competing with Alibaba Cloud and Huawei.
With the Chinese government pushing AI self-sufficiency, Baidu is one of the biggest beneficiaries.
3. Cheap Valuation with High-Tech Exposure
Baidu trades at a forward P/E under 10 and price-to-sales under 2, despite being a major player in AI, cloud, and mobility.
That’s a fraction of what US tech firms with similar ambitions (like Alphabet or Tesla) are valued at.
Over $25 billion in cash and investments on the balance sheet adds a margin of safety.
4. Government Support & Stimulus Tailwinds
The Chinese government is pivoting back toward supporting tech innovation, especially in AI, after years of regulatory crackdowns.
Baidu is aligned with national AI and autonomous driving goals.
If the government ramps up fiscal stimulus, especially in infrastructure and technology, Baidu will likely benefit.
Disclosure: I am part of Trade Nation's Influencer program and receive a monthly fee for using their TradingView charts in my analysis.

MU Micron Technology Options Ahead of EarningsIf you haven`t bought MU before the rally:
Now analyzing the options chain and the chart patterns of MU Micron Technology prior to the earnings report this week,
I would consider purchasing the 128usd strike price Calls with
an expiration date of 2025-6-27,
for a premium of approximately $5.52.
If these options prove to be profitable prior to the earnings release, I would sell at least half of them.
Disclosure: I am part of Trade Nation's Influencer program and receive a monthly fee for using their TradingView charts in my analysis.

PTON Peloton Potential Buyout Interest from Amazon or NikeIf you haven`t bought the dip on PTON, before the rally:
Now Peloton Interactive PTON remains a compelling bullish candidate in 2025, supported not only by strategic buyout interest from major players like Amazon and Nike but also by significant unusual options activity signaling strong investor conviction in a near-term upside move. These factors combined create a powerful catalyst for a potential stock rally.
1. Confirmed Buyout Interest from Amazon and Nike
Since 2022, credible reports have indicated that Amazon and Nike are exploring acquisition opportunities for Peloton, recognizing its value as a leading connected fitness platform with over 2 million subscribers.
Amazon’s interest fits its broader health and smart home ambitions, while Nike sees Peloton as a strategic extension of its digital fitness ecosystem.
Such buyout interest implies a potential premium valuation, which could trigger a sharp upward re-rating of Peloton’s shares if a deal materializes or even if speculation intensifies.
2. Massive Unusual Call Option Activity for July 18, 2025 Expiry
A mystery trader recently purchased over 80,000 call options on Peloton with a $7 strike price expiring July 18, 2025, representing a $3.1 million bet on a price rise within the next few months.
On May 20, 2025, over 90,000 contracts of the $7 strike call expiring July 18, 2025 traded, equating to roughly 9 million underlying shares—well above Peloton’s average daily volume.
This unusually high call volume signals strong bullish sentiment and possible insider or institutional anticipation of a positive event, such as a buyout announcement or operational turnaround.
3. Strategic Fit and Synergies for Acquirers
Peloton’s subscription-based connected fitness platform offers Amazon and Nike a valuable recurring revenue stream and engaged user base.
Amazon could integrate Peloton’s offerings into its ecosystem of devices, health services, and e-commerce, while Nike could leverage Peloton’s content and hardware to deepen its digital fitness presence.
The potential for cross-selling, brand synergy, and data monetization enhances Peloton’s attractiveness as an acquisition target.
4. Attractive Valuation and Growth Potential
Peloton’s market cap has contracted significantly, making it an affordable target for large corporations with strategic interests in health and fitness.
Recent product launches, cost-cutting measures, and renewed marketing efforts aim to stabilize and grow Peloton’s subscriber base and revenue.
The connected fitness market continues to expand, driven by consumer demand for at-home and hybrid workout solutions.
5. Technical and Sentiment Indicators
The stock has shown signs of stabilizing after recent volatility, with support forming near $6–$6.50.
The surge in call options activity, especially at strikes above current prices, suggests growing investor confidence in a near-term breakout.
Historical patterns show Peloton’s stock reacts strongly to buyout rumors and unusual options volume, often resulting in rapid price appreciation.
Disclosure: I am part of Trade Nation's Influencer program and receive a monthly fee for using their TradingView charts in my analysis.

AAOI Applied Optoelectronics potential rally by EOYApplied Optoelectronics AAOI is well-positioned for a strong rally toward $24 per share by the end of 2025, supported by multiple operational and strategic catalysts. A key recent development—the warrant agreement with Amazon—adds a powerful endorsement and financial backing that enhances the bullish case.
1. Amazon’s Strategic Warrant Agreement: A Major Vote of Confidence
On March 13, 2025, AAOI issued a warrant to Amazon.com NV Investment Holdings LLC, granting Amazon the right to purchase up to approximately 7.95 million shares at an exercise price of $23.70 per share.
About 1.3 million shares vested immediately, with the remainder vesting based on Amazon’s discretionary purchases, potentially up to $4 billion in total purchases over time.
This agreement signals Amazon’s strong confidence in AAOI’s technology and its critical role as a supplier of high-speed optical transceivers for Amazon Web Services and AI data center infrastructure.
The warrant price near $24 effectively sets a floor and a valuation benchmark, supporting the thesis that AAOI’s stock could reach or exceed this level by year-end.
2. Major Data Center Wins and Hyperscale Customer Re-Engagement
AAOI recently resumed shipments to a major hyperscale customer, with volume shipments of high-speed data center transceivers expected to ramp significantly in the second half of 2025.
This re-engagement with a key customer aligns with the surging demand for AI-driven data center infrastructure, providing a strong revenue growth catalyst.
3. Robust Revenue Growth and Margin Expansion
Q1 2025 revenue doubled year-over-year to nearly $100 million, with gross margins expanding to over 30%, reflecting operational efficiencies and favorable product mix.
The company expects to sustain strong quarterly revenue ($100–$110 million) and ramp production capacity to over 100,000 units of 800G transceivers per month by year-end, with 40% manufactured in the U.S.
4. Manufacturing Expansion and Supply Chain Resilience
AAOI is scaling manufacturing in the U.S. and Taiwan, enhancing supply chain robustness and positioning itself to benefit from potential government incentives for domestic production.
Its automated, largely in-house manufacturing capabilities provide a competitive edge in meeting hyperscale and AI data center demand.
In conclusion:
Amazon’s warrant agreement at a $23.70 strike price not only provides a direct valuation anchor near $24 but also serves as a powerful strategic endorsement of AAOI’s technology and growth prospects. Combined with robust revenue growth, expanding manufacturing capacity, and key customer re-engagement, AAOI has a compelling case to reach or exceed $24 per share by the end of 2025.

MDB MongoDB Options Ahead of EarningsIf you haven`t exited MDB before the selloff:
Now analyzing the options chain and the chart patterns of MDB MongoDB prior to the earnings report this week,
I would consider purchasing the180usd strike price Puts with
an expiration date of 2025-6-6,
for a premium of approximately $4.95.
If these options prove to be profitable prior to the earnings release, I would sell at least half of them.
