SHORT ON US30US30 Has given a change of character (choc) on the 4hr TF indicating the end of its uptrend pullback on its overall downtrend.
I will be selling US30 to the next level of demand looking to capture over 1000 points.
SELL

USDCHF Is Very Bearish! Sell!
Please, check our technical outlook for USDCHF.
Time Frame: 12h
Current Trend: Bearish
Sentiment: Overbought (based on 7-period RSI)
Forecast: Bearish
The market is approaching a key horizontal level 0.883.
Considering the today's price action, probabilities will be high to see a movement to 0.865.
P.S
Please, note that an oversold/overbought condition can last for a long time, and therefore being oversold/overbought doesn't mean a price rally will come soon, or at all.
Disclosure: I am part of Trade Nation's Influencer program and receive a monthly fee for using their TradingView charts in my analysis.
Like and subscribe and comment my ideas if you enjoy them!

CADJPY Will Fall! Short!
Take a look at our analysis for CADJPY.
Time Frame: 1D
Current Trend: Bearish
Sentiment: Overbought (based on 7-period RSI)
Forecast: Bearish
The market is on a crucial zone of supply 105.385.
Taking into consideration the current market trend & overbought RSI, chances will be high to see a bearish movement to the downside at least to 101.727 level.
P.S
We determine oversold/overbought condition with RSI indicator.
When it drops below 30 - the market is considered to be oversold.
When it bounces above 70 - the market is considered to be overbought.
Disclosure: I am part of Trade Nation's Influencer program and receive a monthly fee for using their TradingView charts in my analysis.
Like and subscribe and comment my ideas if you enjoy them!

GOLD SHORT FROM RESISTANCE
GOLD SIGNAL
Trade Direction: short
Entry Level: 3,037.48
Target Level: 2,814.61
Stop Loss: 3,185.84
RISK PROFILE
Risk level: medium
Suggested risk: 1%
Timeframe: 1D
Disclosure: I am part of Trade Nation's Influencer program and receive a monthly fee for using their TradingView charts in my analysis.
✅LIKE AND COMMENT MY IDEAS✅

NZD/CHF BEARS ARE GAINING STRENGTH|SHORT
Hello, Friends!
We are going short on the NZD/CHF with the target of 0.503 level, because the pair is overbought and will soon hit the resistance line above. We deduced the overbought condition from the price being near to the upper BB band. However, we should use low risk here because the 1W TF is green and gives us a counter-signal.
Disclosure: I am part of Trade Nation's Influencer program and receive a monthly fee for using their TradingView charts in my analysis.
✅LIKE AND COMMENT MY IDEAS✅

SHORT ON EUR/GBPPrice is currently pulling back from its over uptrend on this pair.
Just following the current downtrend structure looking to make 80-100 pips to the next demand zone or imbalance.

AUDUSD Will Go Lower! Sell!
Here is our detailed technical review for AUDUSD.
Time Frame: 1D
Current Trend: Bearish
Sentiment: Overbought (based on 7-period RSI)
Forecast: Bearish
The market is trading around a solid horizontal structure 0.631.
The above observations make me that the market will inevitably achieve 0.618 level.
P.S
Please, note that an oversold/overbought condition can last for a long time, and therefore being oversold/overbought doesn't mean a price rally will come soon, or at all.
Disclosure: I am part of Trade Nation's Influencer program and receive a monthly fee for using their TradingView charts in my analysis.
Like and subscribe and comment my ideas if you enjoy them!

GBPAUD Will Move Lower! Short!
Please, check our technical outlook for GBPAUD.
Time Frame: 1h
Current Trend: Bearish
Sentiment: Overbought (based on 7-period RSI)
Forecast: Bearish
The market is approaching a key horizontal level 2.039.
Considering the today's price action, probabilities will be high to see a movement to 2.033.
P.S
We determine oversold/overbought condition with RSI indicator.
When it drops below 30 - the market is considered to be oversold.
When it bounces above 70 - the market is considered to be overbought.
Disclosure: I am part of Trade Nation's Influencer program and receive a monthly fee for using their TradingView charts in my analysis.
Like and subscribe and comment my ideas if you enjoy them!

USOIL SELLERS WILL DOMINATE THE MARKET|SHORT
USOIL SIGNAL
Trade Direction: short
Entry Level: 69.08
Target Level: 67.53
Stop Loss: 70.11
RISK PROFILE
Risk level: medium
Suggested risk: 1%
Timeframe: 9h
Disclosure: I am part of Trade Nation's Influencer program and receive a monthly fee for using their TradingView charts in my analysis.
✅LIKE AND COMMENT MY IDEAS✅

AUD/NZD BEARISH BIAS RIGHT NOW| SHORT
AUD/NZD SIGNAL
Trade Direction: short
Entry Level: 1.098
Target Level: 1.089
Stop Loss: 1.104
RISK PROFILE
Risk level: medium
Suggested risk: 1%
Timeframe: 6h
Disclosure: I am part of Trade Nation's Influencer program and receive a monthly fee for using their TradingView charts in my analysis.
✅LIKE AND COMMENT MY IDEAS✅

NZD/CAD BEST PLACE TO SELL FROM|SHORT
Hello, Friends!
NZD/CAD is making a bullish rebound on the 1H TF and is nearing the resistance line above while we are generally bearish biased on the pair due to our previous 1W candle analysis, thus making a trend-following short a good option for us with the target being the 0.817 level.
Disclosure: I am part of Trade Nation's Influencer program and receive a monthly fee for using their TradingView charts in my analysis.
✅LIKE AND COMMENT MY IDEAS✅

CHF/JPY BEARS ARE STRONG HERE|SHORT
Hello, Friends!
The BB upper band is nearby so CHF-JPY is in the overbought territory. Thus, despite the uptrend on the 1W timeframe I think that we will see a bearish reaction from the resistance line above and a move down towards the target at around 169.610.
Disclosure: I am part of Trade Nation's Influencer program and receive a monthly fee for using their TradingView charts in my analysis.
✅LIKE AND COMMENT MY IDEAS✅

GBP/AUD BEARS WILL DOMINATE THE MARKET|SHORT
Hello, Friends!
We are now examining the GBP/AUD pair and we can see that the pair is going up locally while also being in a uptrend on the 1W TF. But there is also a powerful signal from the BB upper band being nearby, indicating that the pair is overbought so we can go short from the resistance line above and a target at 2.054 level.
Disclosure: I am part of Trade Nation's Influencer program and receive a monthly fee for using their TradingView charts in my analysis.
✅LIKE AND COMMENT MY IDEAS✅

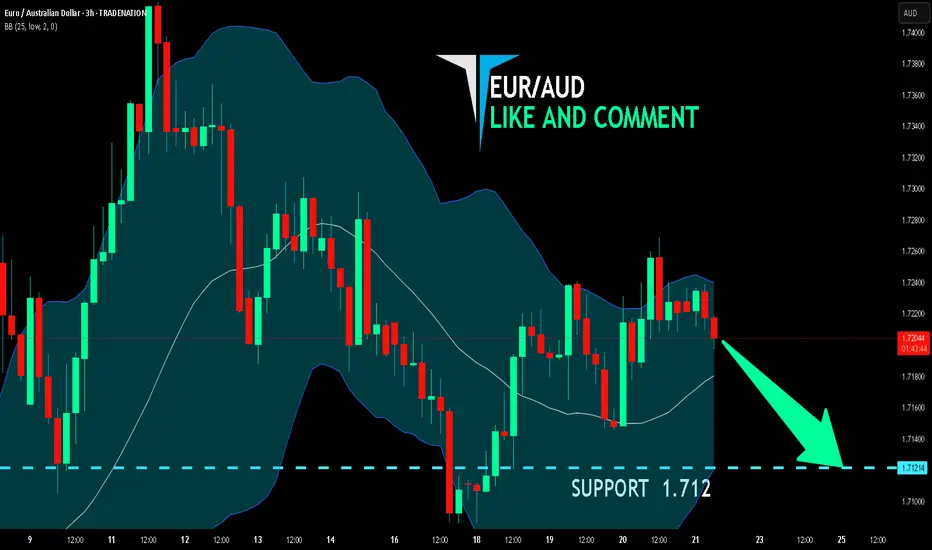
EUR/AUD BEARS ARE STRONG HERE|SHORT
Hello, Friends!
EUR/AUD pair is in the uptrend because previous week’s candle is green, while the price is clearly rising on the 3H timeframe. And after the retest of the resistance line above I believe we will see a move down towards the target below at 1.712 because the pair overbought due to its proximity to the upper BB band and a bearish correction is likely.
Disclosure: I am part of Trade Nation's Influencer program and receive a monthly fee for using their TradingView charts in my analysis.
✅LIKE AND COMMENT MY IDEAS✅
SHORT ON GBP/AUDGBP/AUD has the same setup as EUR/AUD from my post yesterday.
I am selling GBP/AUD for the same exact reasons.
Looking to catch 600 pips long term but over 200 pips easily this week!

EURGBP SELLTracking EUR/GBP on the 15-minute timeframe, we see a potential short opportunity from a key supply zone.
Key Zones & Setup:
🟣 Bearish Order Block (Supply Zone): 0.83800 - 0.83830
This area acted as strong resistance, where institutional traders likely positioned sell orders.
Expecting price to push into this zone before reversing lower.
Break of Structure (BOS) on lower timeframes (M5/M1) is needed for confirmation.
🔵 Target Area (Demand Zone): 0.83450
If the supply zone holds, price could drop toward this key demand level.
This zone aligns with previous BOS levels and price reactions.
Trade Plan:
📈 Waiting for price to push into the supply zone (0.83800 - 0.83830).
🔎 Looking for BOS on lower timeframes (M5/M1) before shorting.
✅ Entering a sell position upon confirmation.
🎯 Targeting the 0.83450 demand zone.
⚠️ Stop-loss above 0.83830 to manage risk.
Market Outlook:
If price fails to break structure, we avoid shorts and reassess.
This setup follows smart money concepts (SMC) with a focus on BOS and order blocks.
💬 What do you think? Are you seeing the same setup? 🚀🔥

US500 Is Bearish! Sell!
Here is our detailed technical review for US500.
Time Frame: 4h
Current Trend: Bearish
Sentiment: Overbought (based on 7-period RSI)
Forecast: Bearish
The market is approaching a significant resistance area 5,754.53.
Due to the fact that we see a positive bearish reaction from the underlined area, I strongly believe that sellers will manage to push the price all the way down to 5,665.70 level.
P.S
Overbought describes a period of time where there has been a significant and consistent upward move in price over a period of time without much pullback.
Disclosure: I am part of Trade Nation's Influencer program and receive a monthly fee for using their TradingView charts in my analysis.
Like and subscribe and comment my ideas if you enjoy them!

USOIL Is Very Bearish! Short!
Take a look at our analysis for USOIL.
Time Frame: 9h
Current Trend: Bearish
Sentiment: Overbought (based on 7-period RSI)
Forecast: Bearish
The market is on a crucial zone of supply 69.379.
The above-mentioned technicals clearly indicate the dominance of sellers on the market. I recommend shorting the instrument, aiming at 67.044 level.
P.S
Please, note that an oversold/overbought condition can last for a long time, and therefore being oversold/overbought doesn't mean a price rally will come soon, or at all.
Disclosure: I am part of Trade Nation's Influencer program and receive a monthly fee for using their TradingView charts in my analysis.
Like and subscribe and comment my ideas if you enjoy them!

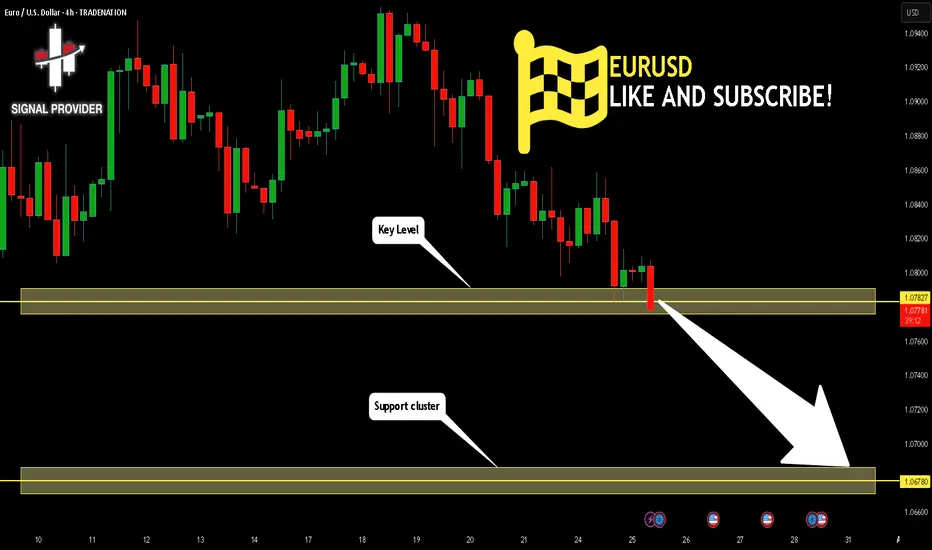
EURUSD Is Going Down! Sell!
Please, check our technical outlook for EURUSD.
Time Frame: 4h
Current Trend: Bearish
Sentiment: Overbought (based on 7-period RSI)
Forecast: Bearish
The price is testing a key resistance 1.078.
Taking into consideration the current market trend & overbought RSI, chances will be high to see a bearish movement to the downside at least to 1.067 level.
P.S
The term oversold refers to a condition where an asset has traded lower in price and has the potential for a price bounce.
Overbought refers to market scenarios where the instrument is traded considerably higher than its fair value. Overvaluation is caused by market sentiments when there is positive news.
Disclosure: I am part of Trade Nation's Influencer program and receive a monthly fee for using their TradingView charts in my analysis.
Like and subscribe and comment my ideas if you enjoy them!
SILVER SHORT FROM RESISTANCE
SILVER SIGNAL
Trade Direction: short
Entry Level: 3,314.3
Target Level: 3,276.5
Stop Loss: 3,339.5
RISK PROFILE
Risk level: medium
Suggested risk: 1%
Timeframe: 1h
Disclosure: I am part of Trade Nation's Influencer program and receive a monthly fee for using their TradingView charts in my analysis.
✅LIKE AND COMMENT MY IDEAS✅

NZD/JPY BEARS WILL DOMINATE THE MARKET|SHORT
NZD/JPY SIGNAL
Trade Direction: short
Entry Level: 86.142
Target Level: 82.808
Stop Loss: 88.356
RISK PROFILE
Risk level: medium
Suggested risk: 1%
Timeframe: 1D
Disclosure: I am part of Trade Nation's Influencer program and receive a monthly fee for using their TradingView charts in my analysis.
✅LIKE AND COMMENT MY IDEAS✅

CAD/JPY SENDS CLEAR BEARISH SIGNALS|SHORT
Hello, Friends!
Previous week’s green candle means that for us the CAD/JPY pair is in the uptrend. And the current movement leg was also up but the resistance line will be hit soon and upper BB band proximity will signal an overbought condition so we will go for a counter-trend short trade with the target being at 104.075.
Disclosure: I am part of Trade Nation's Influencer program and receive a monthly fee for using their TradingView charts in my analysis.
✅LIKE AND COMMENT MY IDEAS✅

AUD/JPY BEARS ARE GAINING STRENGTH|SHORT
Hello, Friends!
AUD/JPY is trending down which is evident from the red colour of the previous weekly candle. However, the price has locally surged into the overbought territory. Which can be told from its proximity to the BB upper band. Which presents a classical trend following opportunity for a short trade from the resistance line above towards the demand level of 93.883.
Disclosure: I am part of Trade Nation's Influencer program and receive a monthly fee for using their TradingView charts in my analysis.
✅LIKE AND COMMENT MY IDEAS✅
