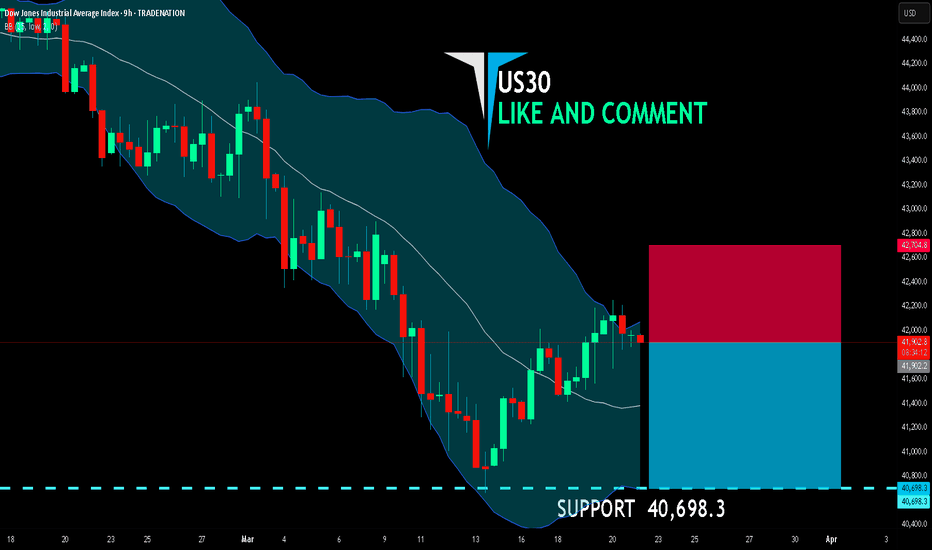
US30 BEARISH BIAS RIGHT NOW| SHORT
US30 SIGNAL
Trade Direction: short
Entry Level: 41,902.2
Target Level: 40,698.3
Stop Loss: 42,704.8
RISK PROFILE
Risk level: medium
Suggested risk: 1%
Timeframe: 9h
Disclosure: I am part of Trade Nation's Influencer program and receive a monthly fee for using their TradingView charts in my analysis.
✅LIKE AND COMMENT MY IDEAS✅
SELL
USD/JPY - Breakdown Confirmation & Potential DeclineUSD/JPY - Breakdown Confirmation & Potential Decline
Chart Overview:
The USD/JPY price action has broken down from a previously established ascending channel.
A lower high formation suggests weakening bullish momentum, indicating a potential continuation of the downtrend.
The key support zones are marked below, with the price likely to move towards these levels if bearish momentum persists.
Technical Analysis:
Breakdown Zone: The price has breached the lower trendline of the ascending channel, confirming a bearish breakdown.
Resistance Levels: The price faces resistance around 0.0067786 - 0.0068488.
Support Targets: Possible downside targets at 0.0066848, 0.0066012, and 0.0065720.
Bearish Confirmation: A retest of the breakdown level followed by rejection strengthens the bearish outlook.
Trade Consideration:
Bearish Bias: A short position could be considered if the price fails to reclaim the broken trendline.
Stop Loss: Above the breakdown zone to avoid potential fakeouts.
Target Levels: Lower support zones for potential take-profit areas.
Conclusion:
The breakdown from the rising channel suggests a shift in market sentiment, with a bearish move likely. Traders should monitor price action for further confirmations.
USDCHF Potential DownsidesHey Traders, in today's trading session we are monitoring USDCHF for a selling opportunity around 0.88900 zone, USDCHF is trading in a downtrend and currently is in a correction phase in which it is approaching the trend at 0.88900 support and resistance area.
Trade safe, Joe.
Bitcoin Potential DownsidesHey Traders, in today's trading session we are monitoring BTCUSDT for a selling opportunity around 90000 zone, Bitcoin is trading in a downtrend and currently is in a correction phase in which it is approaching the trend at 89000 support and resistance area.
Trade safe, Joe.
GBPAUD Will Fall! Short!
Please, check our technical outlook for GBPAUD.
Time Frame: 1D
Current Trend: Bearish
Sentiment: Overbought (based on 7-period RSI)
Forecast: Bearish
The price is testing a key resistance 2.060.
Taking into consideration the current market trend & overbought RSI, chances will be high to see a bearish movement to the downside at least to 2.029 level.
P.S
Overbought describes a period of time where there has been a significant and consistent upward move in price over a period of time without much pullback.
Disclosure: I am part of Trade Nation's Influencer program and receive a monthly fee for using their TradingView charts in my analysis.
Like and subscribe and comment my ideas if you enjoy them!
GOLD BEARS WILL DOMINATE THE MARKET|SHORT
GOLD SIGNAL
Trade Direction: short
Entry Level: 3,031.48
Target Level: 2,966.31
Stop Loss: 3,074.79
RISK PROFILE
Risk level: medium
Suggested risk: 1%
Timeframe: 9h
Disclosure: I am part of Trade Nation's Influencer program and receive a monthly fee for using their TradingView charts in my analysis.
✅LIKE AND COMMENT MY IDEAS✅
USD/CHF SELLERS WILL DOMINATE THE MARKET|SHORT
Hello, Friends!
USD/CHF is making a bullish rebound on the 3H TF and is nearing the resistance line above while we are generally bearish biased on the pair due to our previous 1W candle analysis, thus making a trend-following short a good option for us with the target being the 0.878 level.
Disclosure: I am part of Trade Nation's Influencer program and receive a monthly fee for using their TradingView charts in my analysis.
✅LIKE AND COMMENT MY IDEAS✅
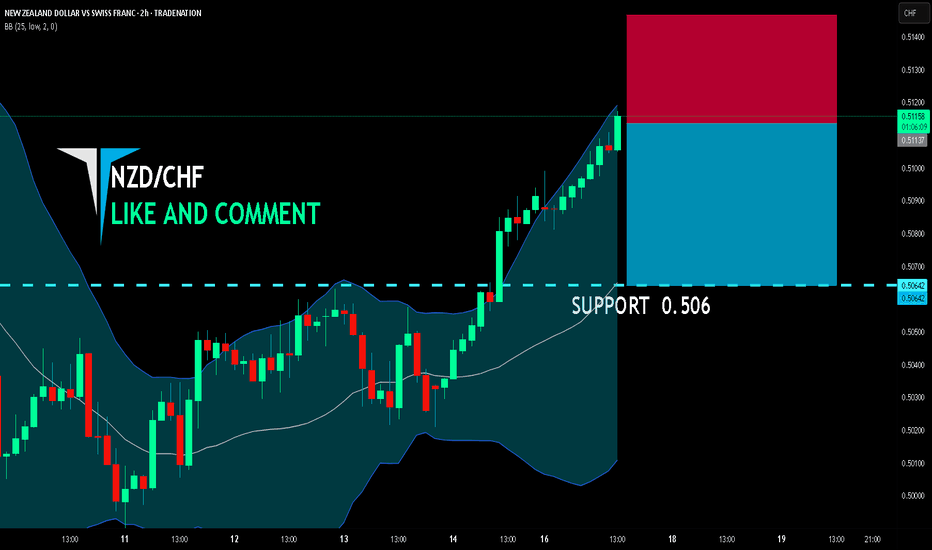
NZD/CHF BEST PLACE TO SELL FROM|SHORT
NZD/CHF SIGNAL
Trade Direction: short
Entry Level: 0.511
Target Level: 0.506
Stop Loss: 0.514
RISK PROFILE
Risk level: medium
Suggested risk: 1%
Timeframe: 2h
Disclosure: I am part of Trade Nation's Influencer program and receive a monthly fee for using their TradingView charts in my analysis.
✅LIKE AND COMMENT MY IDEAS✅
USDJPY Breakout And Potential RetraceHey Traders, in today's trading session we are monitoring USDJPY for a selling opportunity around 149.300 zone, USDJPY was trading in an uptrend and successfully managed to break it out. Currently is in a correction phase in which it is approaching the retrace area at 149.300 support and resistance area.
Trade safe, Joe.
avax sell midterm "🌟 Welcome to Golden Candle! 🌟
We're a team of 📈 passionate traders 📉 who love sharing our 🔍 technical analysis insights 🔎 with the TradingView community. 🌎
Our goal is to provide 💡 valuable perspectives 💡 on market trends and patterns, but 🚫 please note that our analyses are not intended as buy or sell recommendations. 🚫
Instead, they reflect our own 💭 personal attitudes and thoughts. 💭
Follow along and 📚 learn 📚 from our analyses! 📊💡"
BITCOIN Will Go Lower From Resistance! Sell!
Here is our detailed technical review for BITCOIN.
Time Frame: 4h
Current Trend: Bearish
Sentiment: Overbought (based on 7-period RSI)
Forecast: Bearish
The market is trading around a solid horizontal structure 83,533.11.
The above observations make me that the market will inevitably achieve 79,022.44 level.
P.S
Please, note that an oversold/overbought condition can last for a long time, and therefore being oversold/overbought doesn't mean a price rally will come soon, or at all.
Disclosure: I am part of Trade Nation's Influencer program and receive a monthly fee for using their TradingView charts in my analysis.
Like and subscribe and comment my ideas if you enjoy them!
EURUSD Will Go Lower! Short!
Take a look at our analysis for EURUSD.
Time Frame: 6h
Current Trend: Bearish
Sentiment: Overbought (based on 7-period RSI)
Forecast: Bearish
The market is testing a major horizontal structure 1.089.
Taking into consideration the structure & trend analysis, I believe that the market will reach 1.078 level soon.
P.S
The term oversold refers to a condition where an asset has traded lower in price and has the potential for a price bounce.
Overbought refers to market scenarios where the instrument is traded considerably higher than its fair value. Overvaluation is caused by market sentiments when there is positive news.
Disclosure: I am part of Trade Nation's Influencer program and receive a monthly fee for using their TradingView charts in my analysis.
Like and subscribe and comment my ideas if you enjoy them!
USD/JPY BEST PLACE TO SELL FROM|SHORT
USD/JPY SIGNAL
Trade Direction: short
Entry Level: 149.497
Target Level: 146.249
Stop Loss: 151.651
RISK PROFILE
Risk level: medium
Suggested risk: 1%
Timeframe: 12h
Disclosure: I am part of Trade Nation's Influencer program and receive a monthly fee for using their TradingView charts in my analysis.
✅LIKE AND COMMENT MY IDEAS✅
NZD/USD SHORT FROM RESISTANCE
Hello, Friends!
Previous week’s green candle means that for us the NZD/USD pair is in the uptrend. And the current movement leg was also up but the resistance line will be hit soon and upper BB band proximity will signal an overbought condition so we will go for a counter-trend short trade with the target being at 0.569.
Disclosure: I am part of Trade Nation's Influencer program and receive a monthly fee for using their TradingView charts in my analysis.
✅LIKE AND COMMENT MY IDEAS✅
SELL EURUSDGreetings to you all, in todays session we are monitoring EURUSD for a potential pullback from the highs of 1.0923 level. Our stops will be at 1.09618 and 1st target at 1.0800 and 2nd target at 1.06973. Be advised DXY is bearish generally and EURUSD is bullish, this only serves as a pullback trade. Use proper risk management.
NB: This is not financial advice.
AUD/CHF SELLERS WILL DOMINATE THE MARKET|SHORT
Hello, Friends!
AUD/CHF pair is in the uptrend because previous week’s candle is green, while the price is obviously rising on the 6H timeframe. And after the retest of the resistance line above I believe we will see a move down towards the target below at 0.555 because the pair overbought due to its proximity to the upper BB band and a bearish correction is likely.
Disclosure: I am part of Trade Nation's Influencer program and receive a monthly fee for using their TradingView charts in my analysis.
✅LIKE AND COMMENT MY IDEAS✅
GOLD Is Very Bearish! Sell!
Please, check our technical outlook for GOLD.
Time Frame: 3h
Current Trend: Bearish
Sentiment: Overbought (based on 7-period RSI)
Forecast: Bearish
The price is testing a key resistance 3,023.60.
Taking into consideration the current market trend & overbought RSI, chances will be high to see a bearish movement to the downside at least to 2,981.07 level.
P.S
The term oversold refers to a condition where an asset has traded lower in price and has the potential for a price bounce.
Overbought refers to market scenarios where the instrument is traded considerably higher than its fair value. Overvaluation is caused by market sentiments when there is positive news.
Disclosure: I am part of Trade Nation's Influencer program and receive a monthly fee for using their TradingView charts in my analysis.
Like and subscribe and comment my ideas if you enjoy them!
NZDUSD Is Going Down! Short!
Here is our detailed technical review for NZDUSD.
Time Frame: 10h
Current Trend: Bearish
Sentiment: Overbought (based on 7-period RSI)
Forecast: Bearish
The market is trading around a solid horizontal structure 0.581.
The above observations make me that the market will inevitably achieve 0.573 level.
P.S
We determine oversold/overbought condition with RSI indicator.
When it drops below 30 - the market is considered to be oversold.
When it bounces above 70 - the market is considered to be overbought.
Disclosure: I am part of Trade Nation's Influencer program and receive a monthly fee for using their TradingView charts in my analysis.
Like and subscribe and comment my ideas if you enjoy them!
GBPUSD Will Fall! Sell!
Take a look at our analysis for GBPUSD.
Time Frame: 1D
Current Trend: Bearish
Sentiment: Overbought (based on 7-period RSI)
Forecast: Bearish
The market is testing a major horizontal structure 1.299.
Taking into consideration the structure & trend analysis, I believe that the market will reach 1.271 level soon.
P.S
Overbought describes a period of time where there has been a significant and consistent upward move in price over a period of time without much pullback.
Disclosure: I am part of Trade Nation's Influencer program and receive a monthly fee for using their TradingView charts in my analysis.
Like and subscribe and comment my ideas if you enjoy them!
SILVER BEARS WILL DOMINATE THE MARKET|SHORT
SILVER SIGNAL
Trade Direction: short
Entry Level: 3,408.6
Target Level: 3,244.3
Stop Loss: 3,517.4
RISK PROFILE
Risk level: medium
Suggested risk: 1%
Timeframe: 12h
Disclosure: I am part of Trade Nation's Influencer program and receive a monthly fee for using their TradingView charts in my analysis.
✅LIKE AND COMMENT MY IDEAS✅
GBP/USD SENDS CLEAR BEARISH SIGNALS|SHORT
GBP/USD SIGNAL
Trade Direction: short
Entry Level: 1.299
Target Level: 1.270
Stop Loss: 1.319
RISK PROFILE
Risk level: medium
Suggested risk: 1%
Timeframe: 1D
Disclosure: I am part of Trade Nation's Influencer program and receive a monthly fee for using their TradingView charts in my analysis.
✅LIKE AND COMMENT MY IDEAS✅
EUR/USD BEARS ARE GAINING STRENGTH|SHORT
Hello, Friends!
EUR-USD uptrend evident from the last 1W green candle makes short trades more risky, but the current set-up targeting 1.057 area still presents a good opportunity for us to sell the pair because the resistance line is nearby and the BB upper band is close which indicates the overbought state of the EUR/USD pair.
Disclosure: I am part of Trade Nation's Influencer program and receive a monthly fee for using their TradingView charts in my analysis.
✅LIKE AND COMMENT MY IDEAS✅


