XAUUSD – Clear Sideways Movement in a Narrow Price ChannelXAUUSD is moving within a parallel price channel, fluctuating between the 3,320–3,345 zone. Both the EMA 34 and EMA 89 are running flat and close together, indicating a balanced market with no strong momentum in either direction.
Recent highs and lows have formed within a narrow range, reflecting indecision from both buyers and sellers. The latest bounce also stalled at the channel resistance, lacking the strength to break out.
As long as price remains below 3,345 and above 3,320, the sideways trend is likely to continue. During this phase, a range-trading strategy is preferred – selling near the top, buying near the bottom – while waiting for a clear breakout to determine the next directional move.
SELL

SILVER Will Go Lower From Resistance! Short!
Here is our detailed technical review for SILVER.
Time Frame: 12h
Current Trend: Bearish
Sentiment: Overbought (based on 7-period RSI)
Forecast: Bearish
The market is approaching a significant resistance area 3,654.7.
Due to the fact that we see a positive bearish reaction from the underlined area, I strongly believe that sellers will manage to push the price all the way down to 3,536.0 level.
P.S
Please, note that an oversold/overbought condition can last for a long time, and therefore being oversold/overbought doesn't mean a price rally will come soon, or at all.
Disclosure: I am part of Trade Nation's Influencer program and receive a monthly fee for using their TradingView charts in my analysis.
Like and subscribe and comment my ideas if you enjoy them!

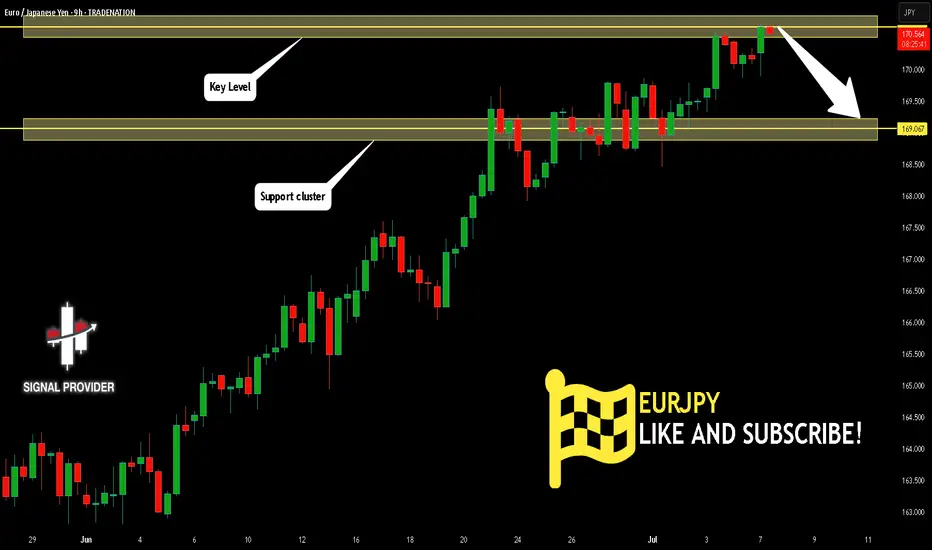
EURJPY Will Go Lower! Sell!
Please, check our technical outlook for EURJPY.
Time Frame: 9h
Current Trend: Bearish
Sentiment: Overbought (based on 7-period RSI)
Forecast: Bearish
The price is testing a key resistance 170.636.
Taking into consideration the current market trend & overbought RSI, chances will be high to see a bearish movement to the downside at least to 169.067 level.
P.S
We determine oversold/overbought condition with RSI indicator.
When it drops below 30 - the market is considered to be oversold.
When it bounces above 70 - the market is considered to be overbought.
Disclosure: I am part of Trade Nation's Influencer program and receive a monthly fee for using their TradingView charts in my analysis.
Like and subscribe and comment my ideas if you enjoy them!
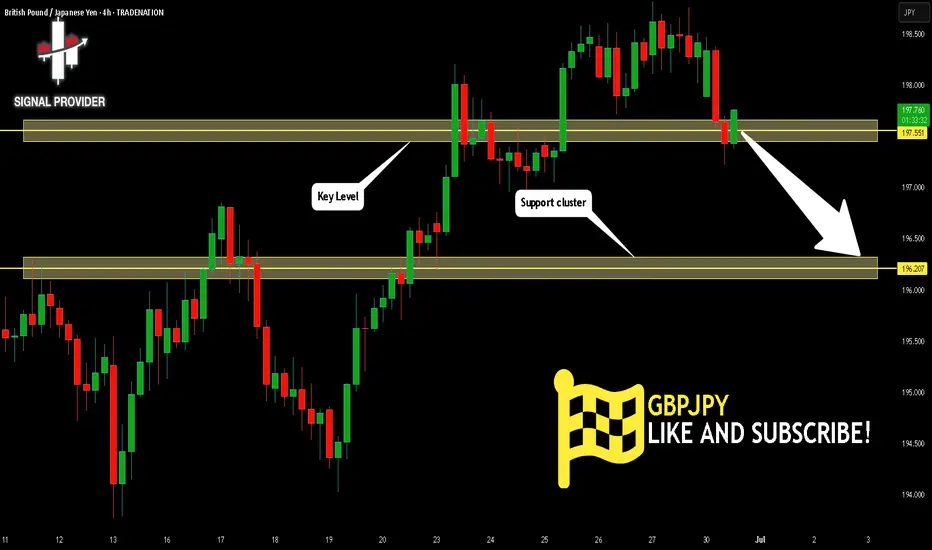
GBPJPY Will Go Down From Resistance! Sell!
Please, check our technical outlook for GBPJPY.
Time Frame: 4h
Current Trend: Bearish
Sentiment: Overbought (based on 7-period RSI)
Forecast: Bearish
The price is testing a key resistance 197.551.
Taking into consideration the current market trend & overbought RSI, chances will be high to see a bearish movement to the downside at least to 196.207 level.
P.S
Overbought describes a period of time where there has been a significant and consistent upward move in price over a period of time without much pullback.
Disclosure: I am part of Trade Nation's Influencer program and receive a monthly fee for using their TradingView charts in my analysis.
Like and subscribe and comment my ideas if you enjoy them!
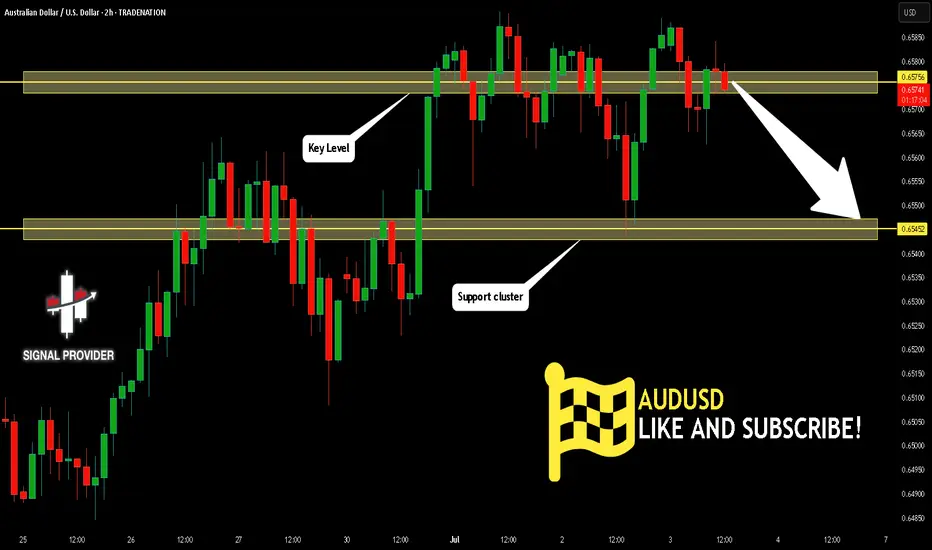
AUDUSD Is Very Bearish! Short!
Please, check our technical outlook for AUDUSD.
Time Frame: 2h
Current Trend: Bearish
Sentiment: Overbought (based on 7-period RSI)
Forecast: Bearish
The price is testing a key resistance 0.657.
Taking into consideration the current market trend & overbought RSI, chances will be high to see a bearish movement to the downside at least to 0.654 level.
P.S
Overbought describes a period of time where there has been a significant and consistent upward move in price over a period of time without much pullback.
Disclosure: I am part of Trade Nation's Influencer program and receive a monthly fee for using their TradingView charts in my analysis.
Like and subscribe and comment my ideas if you enjoy them!
GBP/USD BEARS ARE STRONG HERE|SHORT
Hello, Friends!
GBP/USD pair is in the uptrend because previous week’s candle is green, while the price is clearly rising on the 3H timeframe. And after the retest of the resistance line above I believe we will see a move down towards the target below at 1.358 because the pair overbought due to its proximity to the upper BB band and a bearish correction is likely.
Disclosure: I am part of Trade Nation's Influencer program and receive a monthly fee for using their TradingView charts in my analysis.
✅LIKE AND COMMENT MY IDEAS✅

GBP/CAD SELLERS WILL DOMINATE THE MARKET|SHORT
GBP/CAD SIGNAL
Trade Direction: short
Entry Level: 1.872
Target Level: 1.866
Stop Loss: 1.876
RISK PROFILE
Risk level: medium
Suggested risk: 1%
Timeframe: 1h
Disclosure: I am part of Trade Nation's Influencer program and receive a monthly fee for using their TradingView charts in my analysis.
✅LIKE AND COMMENT MY IDEAS✅

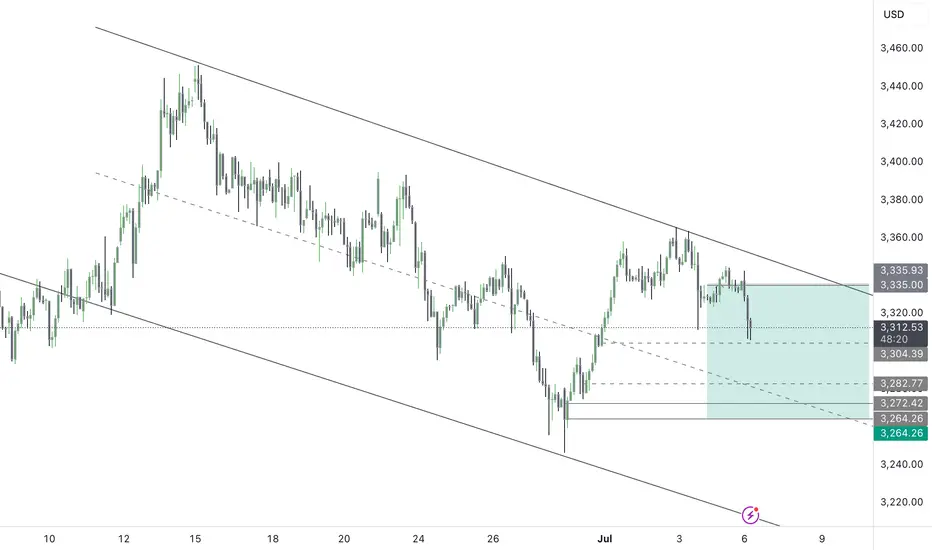
GOLD BEARS GOLD has been showing a bearish. sentiment as July candle hedges around its formation.
Note that this bearish setup is merely a monthly retracement as gold is still bullish on the long term overview .The path of this bearish pullback leads to the 3200's as we're curreently at the 3310's and if we break past 3304 zone, we go for more lower liquidity.
POI- 3304, 3280, 3260
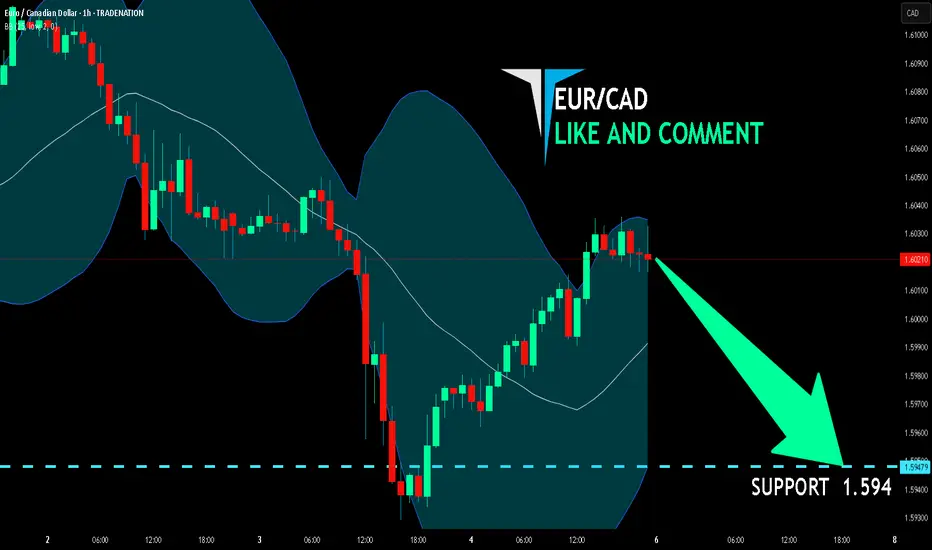
EUR/CAD BEARS ARE GAINING STRENGTH|SHORT
Hello, Friends!
We are targeting the 1.594 level area with our short trade on EUR/CAD which is based on the fact that the pair is overbought on the BB band scale and is also approaching a resistance line above thus going us a good entry option.
Disclosure: I am part of Trade Nation's Influencer program and receive a monthly fee for using their TradingView charts in my analysis.
✅LIKE AND COMMENT MY IDEAS✅
USOIL Is Bearish! Short!
Please, check our technical outlook for USOIL.
Time Frame: 2h
Current Trend: Bearish
Sentiment: Overbought (based on 7-period RSI)
Forecast: Bearish
The market is approaching a key horizontal level 66.402.
Considering the today's price action, probabilities will be high to see a movement to 64.925.
P.S
We determine oversold/overbought condition with RSI indicator.
When it drops below 30 - the market is considered to be oversold.
When it bounces above 70 - the market is considered to be overbought.
Disclosure: I am part of Trade Nation's Influencer program and receive a monthly fee for using their TradingView charts in my analysis.
Like and subscribe and comment my ideas if you enjoy them!

US100 SELLERS WILL DOMINATE THE MARKET|SHORT
US100 SIGNAL
Trade Direction: short
Entry Level: 22,684.7
Target Level: 22,082.0
Stop Loss: 23,085.2
RISK PROFILE
Risk level: medium
Suggested risk: 1%
Timeframe: 10h
Disclosure: I am part of Trade Nation's Influencer program and receive a monthly fee for using their TradingView charts in my analysis.
✅LIKE AND COMMENT MY IDEAS✅

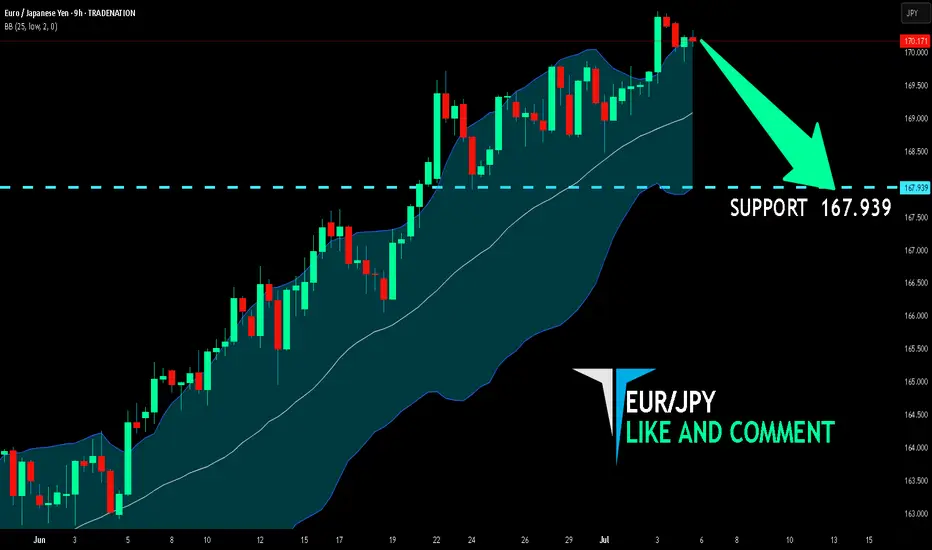
EUR/JPY BEARISH BIAS RIGHT NOW| SHORT
Hello, Friends!
We are now examining the EUR/JPY pair and we can see that the pair is going up locally while also being in a uptrend on the 1W TF. But there is also a powerful signal from the BB upper band being nearby, indicating that the pair is overbought so we can go short from the resistance line above and a target at 167.939 level.
Disclosure: I am part of Trade Nation's Influencer program and receive a monthly fee for using their TradingView charts in my analysis.
✅LIKE AND COMMENT MY IDEAS✅
EUR/GBP BEST PLACE TO SELL FROM|SHORT
Hello, Friends!
The BB upper band is nearby so EUR-GBP is in the overbought territory. Thus, despite the uptrend on the 1W timeframe I think that we will see a bearish reaction from the resistance line above and a move down towards the target at around 0.856.
Disclosure: I am part of Trade Nation's Influencer program and receive a monthly fee for using their TradingView charts in my analysis.
✅LIKE AND COMMENT MY IDEAS✅

Gold Price Maintains Bullish MomentumGold is currently trading within a converging wedge pattern, following a strong rebound from the recent bottom near 3,210 USD.
If price holds above the 3,276 USD support zone and shows bullish confirmation, the next target will be a breakout above the descending trendline, aiming for the 3,359 USD resistance zone — a key level to confirm the continuation of the uptrend.
From a fundamental perspective, the weakening USD — driven by expectations of cautious Fed rate cuts — combined with lingering geopolitical risks and strong central bank demand (over 1,000 tons annually), continues to provide solid support for gold.
Overall Trend: Bullish
Confirmation Condition: Price holds above 3,276 USD and breaks the upper wedge
Mid-term Target: 3,359 to 3,400 USD

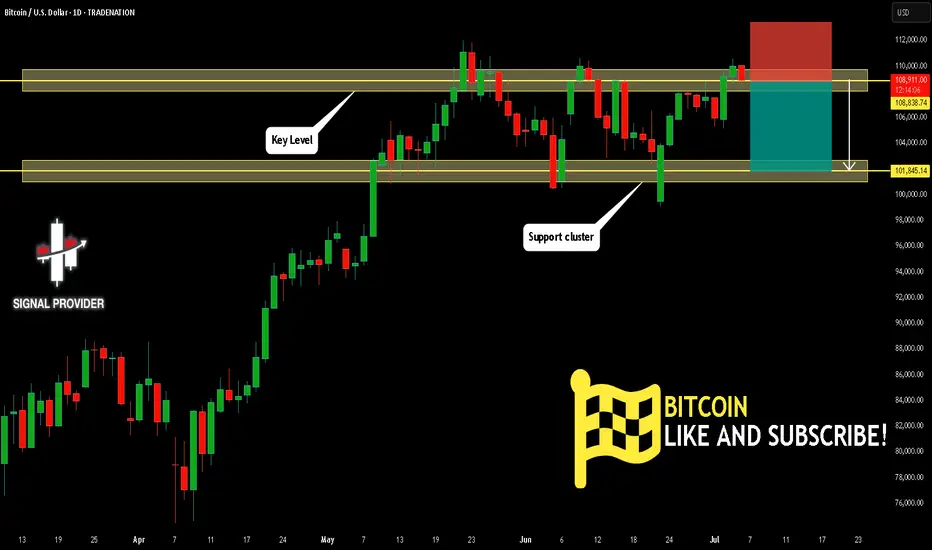
BITCOIN Will Fall! Sell!
Please, check our technical outlook for BITCOIN.
Time Frame: 1D
Current Trend: Bearish
Sentiment: Overbought (based on 7-period RSI)
Forecast: Bearish
The price is testing a key resistance 108,838.74.
Taking into consideration the current market trend & overbought RSI, chances will be high to see a bearish movement to the downside at least to 101,845.14 level.
P.S
The term oversold refers to a condition where an asset has traded lower in price and has the potential for a price bounce.
Overbought refers to market scenarios where the instrument is traded considerably higher than its fair value. Overvaluation is caused by market sentiments when there is positive news.
Disclosure: I am part of Trade Nation's Influencer program and receive a monthly fee for using their TradingView charts in my analysis.
Like and subscribe and comment my ideas if you enjoy them!
Gold Breakout and Potential RetraceHey Traders, in today's trading session we are monitoring XAUUSD for a selling opportunity around 3,350 zone, Gold was trading in an uptrend and successfully managed to break it out. Currently is in a correction phase in which it is approaching the retrace area at 3,350 support and resistance zone.
Trade safe, Joe.

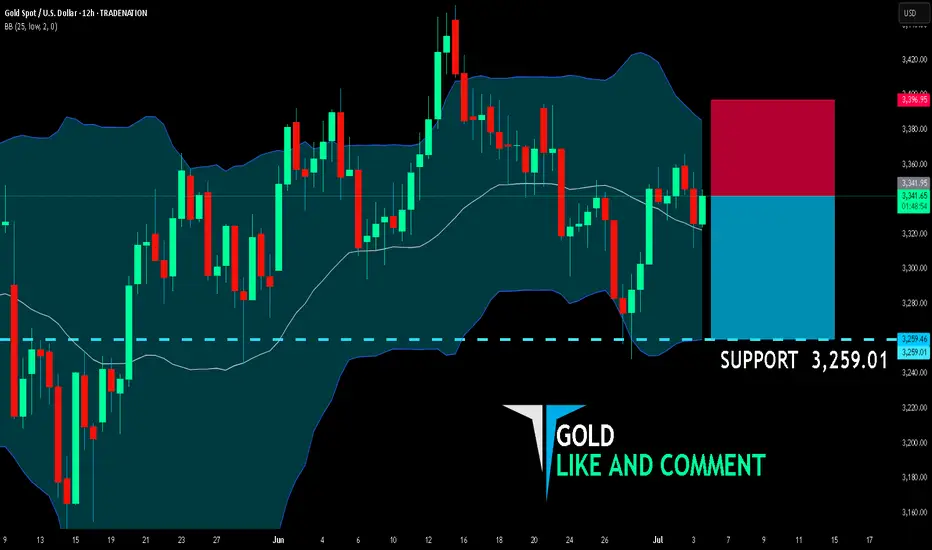
GOLD BEARS ARE STRONG HERE|SHORT
GOLD SIGNAL
Trade Direction: short
Entry Level: 3,341.95
Target Level: 3,259.01
Stop Loss: 3,396.95
RISK PROFILE
Risk level: medium
Suggested risk: 1%
Timeframe: 12h
Disclosure: I am part of Trade Nation's Influencer program and receive a monthly fee for using their TradingView charts in my analysis.
✅LIKE AND COMMENT MY IDEAS✅
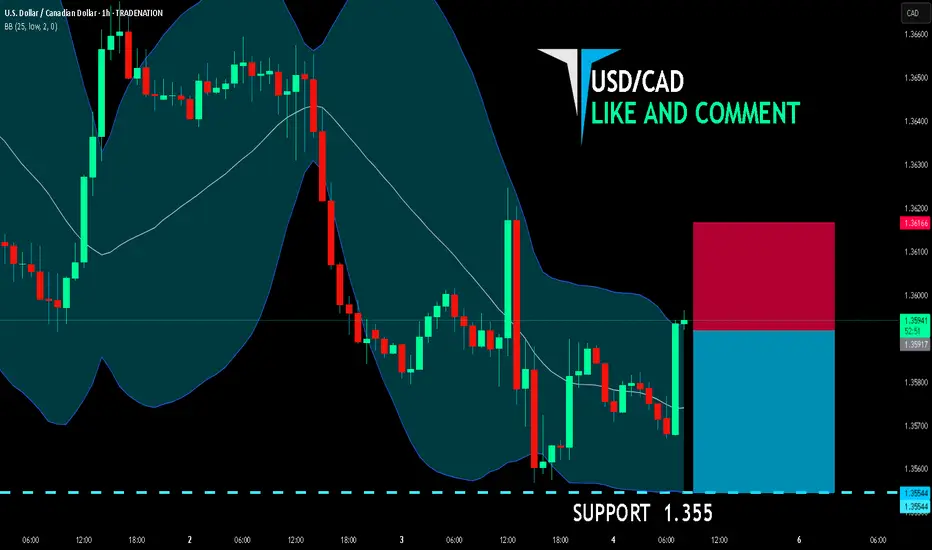
USD/CAD SHORT FROM RESISTANCE
USD/CAD SIGNAL
Trade Direction: short
Entry Level: 1.359
Target Level: 1.355
Stop Loss: 1.361
RISK PROFILE
Risk level: medium
Suggested risk: 1%
Timeframe: 1h
Disclosure: I am part of Trade Nation's Influencer program and receive a monthly fee for using their TradingView charts in my analysis.
✅LIKE AND COMMENT MY IDEAS✅
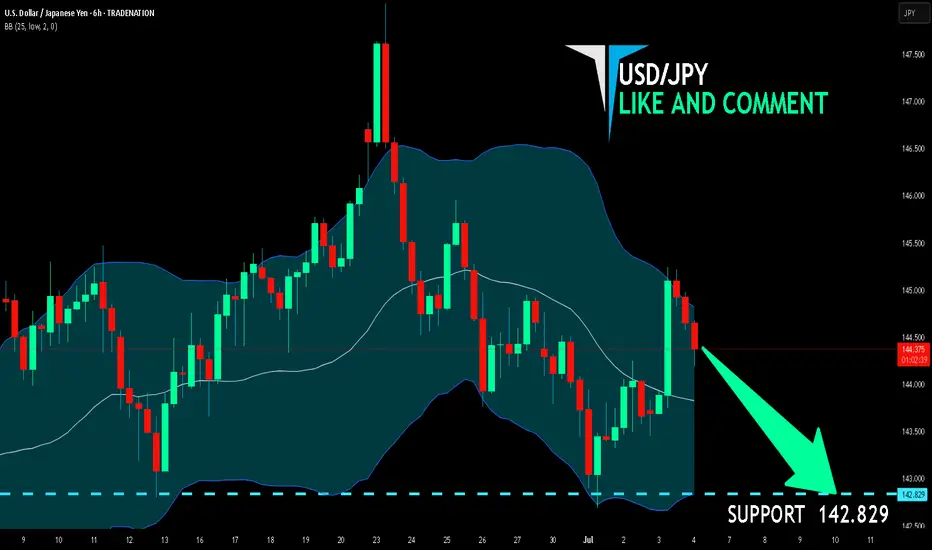
USD/JPY SENDS CLEAR BEARISH SIGNALS|SHORT
Hello, Friends!
USD-JPY uptrend evident from the last 1W green candle makes short trades more risky, but the current set-up targeting 142.829 area still presents a good opportunity for us to sell the pair because the resistance line is nearby and the BB upper band is close which indicates the overbought state of the USD/JPY pair.
Disclosure: I am part of Trade Nation's Influencer program and receive a monthly fee for using their TradingView charts in my analysis.
✅LIKE AND COMMENT MY IDEAS✅
VKTX: Unusual Options Flow & a Breakthrough Weight-Loss DrugIf you haven`t bought CKTX before the recent rally:
Now you need to know that Viking Therapeutics (VKTX) is a speculative biotech stock in the GLP-1/GIP agonist space, aiming to challenge market leaders like Eli Lilly and Novo Nordisk. Recently, I noticed unusual options flow — specifically, Jan 16, 2026 $60 strike calls
Key Bullish Points
1) Riding the Obesity Drug Boom
VK2735 is Viking’s dual agonist candidate showing promising early weight-loss efficacy, with potential overlap benefits in NASH (liver disease). The obesity treatment space is expected to exceed $100B by 2030—huge upside if their trials continue positively.
2) Options Flow Tells a Story
Those Jan 2026 $60 calls caught my attention precisely because the stock currently trades in the mid-$60s. These aren’t cheap lottery plays—they’re strategically timed wrt trial readouts, partnerships, or acquisition interest. Essentially, someone anticipates meaningful upside in the near future.
3) Descending Wedge — Chart Looks Bullish
VKTX peaked near $100, then pulled back into a well-defined descending wedge. If it breaks out above $70–$72 with volume, that could kick off a classic reversal trade.
Smart Money Options Flow — Near-Term Bet:
Recently, I spotted unusual open interest in $60 strike calls expiring Jan 16, 2026 — that’s only about 7 months away.
This means someone is positioning for a big upside move relatively soon, likely betting on positive Phase 2b/3 data, a partnership deal, or even buyout chatter within the next few quarters.
Short-dated, out-of-the-money call flow like this often hints at near-term news — not just a long-dated hedge.

KWEB: China’s Internet Sector - AI Catch-Up and Cheap ValuationsChina’s internet and tech stocks have been hammered for years — regulatory crackdowns, slowing growth fears, and geopolitical tension have crushed sentiment. But as investors know, the best opportunities often hide in what everyone hates.
Enter KWEB, the KraneShares CSI China Internet ETF.
It’s a diversified, liquid way to play a bounce in major names like Alibaba, Tencent, JD .com, Baidu, Meituan and PDD.
Here’s why I think the risk/reward looks compelling now — especially if you believe in AI closing the gap.
Key Bullish Points:
1) Valuations at Rock-Bottom
Many big China internet stocks are still trading at single-digit P/E ratios, even as their cash flows recover. Compared to U.S. big tech trading at 30–50x, this is a huge valuation gap.
Regulatory fears seem largely priced in — Beijing wants growth, not stagnation, and some policies are easing.
2) China’s AI Push — Just “Months Behind”
Jansen Whang recently argued that China’s generative AI development is only “months behind” the U.S. Players like Baidu, Alibaba Cloud, Tencent, and SenseTime are all racing to launch new LLMs and integrated AI tools.
If you believe the gap closes, Chinese platforms could see a major earnings rebound as they roll out AI upgrades across search, cloud, e-commerce and social media.
3) Sentiment So Bad, It’s Good
When the headlines scream “China is uninvestable,” that’s often when big mean reversion trades set up. Even a small policy pivot, stimulus plan, or positive AI news cycle can spark a sharp rally.
KWEB is one of the cleanest ways to express this view because it holds a diversified basket — you don’t have to pick a single winner.

LCID: Could a Saudi Buyout Send This EV Stock Back to $10?If you haven`t sold LCID before the previous earnings:
Now you need to know that Lucid Motors (LCID) is one of the most polarizing EV stocks in the market — but it’s also one of the most interesting speculative turnarounds. Yes, the company faces production challenges, cash burn, and fierce competition from Tesla, BYD, and legacy automakers. But it has some unique wildcards that most other EV startups don’t:
1) The “Musk Factor”
Musk’s public comments about Lucid being “basically controlled by the Saudis” and that they make better-looking cars than Tesla might sound like trolling, but they highlight a real truth: Lucid isn’t just another budget EV player — it’s positioned as a luxury rival with design appeal that matters to high-end buyers.
2) Saudi PIF Is Deep In — Valuation Floor
The Saudi sovereign wealth fund has put billions into LCID already — and now owns around 60%+ of the shares. They’ve made no secret of their plans to expand the kingdom’s domestic EV production and see Lucid as a flagship partner.
Rumors have swirled for years about a possible full buyout to bring Lucid fully under the PIF umbrella — or merge it with other Middle East EV initiatives like the Ceer brand. Any credible news here could double or triple the stock overnight from these depressed levels.
3) Gravity SUV & Product Pipeline
The Lucid Air remains one of the few luxury EVs that truly competes with Tesla’s Model S in both design and range. The upcoming Gravity SUV could be the next big catalyst, especially as the luxury SUV segment has fatter margins and huge global demand.
Meanwhile, the new AMP-2 factory in Saudi Arabia will help Lucid localize production, get tax incentives, and serve the Middle East and Europe more cost-effectively.
4) Technical Setup: Double Bottom Pattern
Here’s what really makes this setup tradable: LCID is showing a clear double bottom on the daily chart around the $2–$2.20 zone. The stock tested that level twice and bounced, forming a W-shaped base that can signal a reversal.
Disclosure: I am part of Trade Nation's Influencer program and receive a monthly fee for using their TradingView charts in my analysis.

Why IonQ (IONQ) Could Be the NVDA of Quantum ComputingIf you haven`t bought IONQ before the rally:
Now you need to know that IonQ isn’t just another speculative quantum stock — The company is building a robust ecosystem around its best‑in‑class trapped‑ion architecture and targeting fault‑tolerant, networked quantum systems. With record bookings, major acquisitions, and a strong balance sheet, IonQ could emerge as the NVIDIA equivalent for quantum infrastructure.
Key Bullish Arguments
1) Superior Quantum Tech – Trapped‑Ion Advantage
IonQ’s trapped-ion processors boast 99.9% two-qubit fidelity, demonstrating higher accuracy and scalability than superconducting alternatives
These systems also operate at room temperature, meaning simpler deployment and lower costs
2) Ecosystem Strategy & Acquisitions
The $1.08B acquisition of Oxford Ionics (expected close in 2025) expands IonQ’s qubit control tech, pushing toward planned 80,000 logical‑qubit systems by decade’s end
Combined with ID Quantique and Lightsynq, IonQ is building a full-stack quantum and networking offering
3) Strong Revenue Growth & Cash Runway
Revenue soared from $22M in 2023 to $43.1M in 2024, with bookings of $95.6M
. Q1 2025 saw $7.6M revenue and EPS –$0.14, beating expectations; cash reserves near $697M provide years of runway
4) Real Commercial Deployments
IonQ sold its Forte Enterprise quantum system to EPB ($22M deal) for hybrid compute and networking, marking real-world commercial applications
5) AI & Quantum Synergy
Involvement in NVIDIA’s Quantum Day and hybrid quantum‑classical AI demos (e.g., blood pump simulation with Ansys, ~12 % faster) indicates strategic synergy and positions IonQ as a critical piece in the future AI stack
Recent Catalysts:
Texas Quantum Initiative passes – positions IonQ at forefront of U.S. state-backed innovation
Oxford Ionics acquisition pending – major expansion in qubit scale & tech
Barron’s analyst buys – industry analysts see long-term potential; IonQ among top quantum picks
Broader quantum optimism – McKinsey & Morgan Stanley forecasts highlight synergy between quantum and AI, benefiting IonQ
