EUR/USD went up and now is decreasingThe volumes are lower than few hours ago. The buyers now are trying to push it to the top but the sellers are there.
I really think EUR/USD is going to decrease. Now it's testing the VWAP.
EUR/USD to watch carefully during a couple of hours.
Sellers

USD/JPY is testing the VWAPThe battle between buyers and sellers has not really started yet because of the volumes (low).
USD/JPY is above the VWAP but is looking for itself.
IUSD/JPY to keep in Portfolio.

Buyers Vs Sellers lesson & How to look at the marketJust looking at the basic shift between buyers and sellers.

Buying vs Selling Pt2- Who's really in CONTROL?Part 2 here is all about CONTROL .
As I said in part 1, people tend to equate green candles with buying and red with selling but the default coloring is wrong and does not reflect the actual actions of smart money.
Like color, a common misconception is that if the day is red and way down, people are selling off. The reality is most of the time the market is down because buyers are in control .
Think about the stock market the same way you might think about a housing market for a moment. Have you ever heard "it's a seller's market" or "a buyer's market"? What's going on in those markets? Usually in a sellers market, the homeowner lists their house, gets a ton of bids, and chooses the highest bidder. They may even decide they listed too low or change their mind. In a buyers market they may not be so fortunate to get a lot of bids and the bids that come in may be below their asking price. Depending on their motivation, the homeowner in a buyers market might sell for below their asking because they are in a dire situation where they need the money or are spooked that prices are going to continue to fall.
In a lot of cases, that's not too far from stock markets. Think about the last month or so with the COVID-19 pandemic and look at this chart-
Who's really in control here? You always hear people saying, "Sellers at it again" when we have these -7% trading halts. The reality is closer to this though, who really wants to BUY in a time like this? Sellers have lost control. Through much of the crash you could not sell your shares for yesterday's price because the buyers on the other end of the table said no thanks, I think I can get a better price to buy at later.
Here's an example of the December 2018 correction and some insight as to the balance of control-
Until you understand it better, thinking of control and phases this way seems counter-intuitive. Why is the price RISING if people are SELLING? Or why would price be FALLING if we're supposedly BUYING? I like to look at it in terms of these phases (on main chart)-
Buyers Collect -> Chase -> Sellers Profit -> Panic
Most of us are dumb money, retail traders. Oh, and we're HUMAN. We struggle emotionally with harvesting profits because we get greedy and our heart starts pounding when we see heavy volume and giant red candles.
Combining color and control on a couple intraday examples-

USDCHF POTENTIAL SHORT OPPORTUNITY (1D CHART) USDCHF POTENTIAL SHORT OPPORTUNITY
SO IF YOU TAKE A LOOK AT THIS CHART IT IS DISPLAYING SIGNS OF STRONG SELLER. USDCHF IS SITTING AT VERY STRONG YEARLY HIGHS AND RECENTLY ON 1D AND 1W CHART PRICE HAS SEEMED TO TOP OUT AT THIS RESISTANCE POINT. ON THE DAILY CHART DATA TIMEFRAME YOU CAN SEE HOW SELLERS HAVE SHOWED STRONG INTEREST AND SIGNS OF SELLER TREND STARTING TO FORM. A LOWER HIGH WITH STRONG SELLER RESISTANCE FORMED AND IS DISPLAYING A GOOD POTENTIAL SHORT OPPORTUNITY WITH MINIMAL UPSIDE RISK AND MARGINAL DOWNSIDE POTENTIAL. LETS CHECK IT OUT!
1D CHART:
*LOWER HIGH FORMED ON 1D CHART
*STRONG SELLER RESISTANCE WITH LOWER CLOSE FORMING
4H CHART:
*VERY STRONG SELLER POWER COMING INTO PLAY
*GOOD TIMEFRAME TO USE FOR ENTRY AND EXIT GAMEPLAN.
KEEP AN EYE ON THIS PAIR FOR THIS SHORT OPPORTUNITY AND REMEMBER TO ALWAYS USE PROPER RISK MANAGEMENT. NOTHING IS GUARENTEED IN THE MARKETS, WE ARE HERE JUST TO CAPITALIZE ON THE BIGGER PLAYERS AND THEIR MOVES. LUCKILY THEY MAKE IT ABUNDANTLY CLEAR WHAT THEY ARE THINKING. YOU JUST HAVE TO LEARN HOW TO READ THEM!
CHEERS!

GBPJPY : SHORT TRADE IDEA ( 100 PIPS+)Bears stepping into GBPJPY as it approcahes the 50% fibonacci level, Hopefully sells sentiment continue with this bearish momentum and take price down towards. 141.500 in london session.
Risk Warning : The risk of loss in trading Foreign Exchange (FOREX) can be substantial.
You should therefore carefully consider whether trading is suitable for you in the light of your financial condition.
Goodluck !

EURAUD : SHORT TRADE IDEAWe have seen price reverse last week from the highs of 1.6295 zone, Price is at a major zone at the moment (1.61011) but a bearish market should continue till 1.59687 zone as buyers could start opening their long positions.
Risk Warning : The risk of loss in trading Foreign Exchange (FOREX) can be substantial.
You should therefore carefully consider whether trading is suitable for you in the light of your financial condition.
Goodluck !


AUDUSD - Possible bear continuationAs we can see from the chart above, the cross reached a very important resistance first established back in May as a support and tested in June; the "change of polarity" happened in July, when price dropped of more than 4% in 2 trading weeks. As the saying goes: "the first test never fails"; it didn't indeed. We could be in front of a retest of the resistance, which, moreover, coincides with the 50% of Fibonacci level (as you can see from the chart). So here's what I expect: price will drop at least to 0.6755, if not to 0.6725, where there's a high liquidity zone.
In addition, some economists expect one more rate cut from the RBA for 2019 and the likely adoption of QE, in order to accomplish the inflationary target of 2-3% (CPI), which is now at 1.6%. The next CPI data will be published on October, 30th and will likely remain at 1.6%.

USDCAD POTENTIAL SHORT (4H&1D) CHARTSUSDCAD POTENTIAL SHORT
OKAY SO IM MAKING THIS POST TO FOLLOW UP ON THE RECENT POST THAT I HAD MADE FOR THE LONGER TERM VISION OF MY USDCAD SHORT BIAS. AFTER LOOKING AT THE WEEKLY TIMEFRAME THERE WAS A STRONG SELLER MOMENTUM PUSH TO THE DOWNSIDE AND NOW FOR THE PAST FEW WEEKS THER HAS BEEN A BUYER RE-TEST BACK INTO STRUCTURE THAT WAS BROKEN BY THE SELLERS. IF YOU LOOK AT THE CHART IT IS DISPLAYING THAT THE BUYERS ARE STRUGGLING TO COME INTO STRUCTURE WHICH IS SHOWING ME THAT THE SELLERS ARE STILL HOLDING CONTROL AND SEEM TO BE PUSHING THE BUYERS DOWN EVERY ATTEMPT THEY MAKE TO COME TO THE UPSIDE. KEEP AN EYE OUT TO WAIT FOR A STRONG SELLER PUSH ON LOWER TIMEFRAME (1H AND 4H) AND LOOK FOR A POTENTIAL SHORT TO THE DOWNSIDE TARGET AREA. JUST WANTED TO MAKE ANOTHER POST FOR SHORTER TIMEFRAME OPPORTUNITY TO POSSIBLY EXTRACT PROFITS FROM THE MARKET. MAKE SURE TO ALWAYS USE AND IMPLEMENT PROPER RISK MANAGEMENT WHEN TAKING TRADES. KEEP AN EYE OUT
CHEERS!

EURCHF POTENTIAL SHORT OPPORTUNITY (1D AND 1W CHARTS) EURCHF POTENTIAL SHORT
OKAY SO I DID ANALYSIS ON THIS PAIR A LITTLE OVER A WEEK AGO AND DECIDING NOW TO POST IT FOR YOU ALL! OKAY SO AFTER LOOKING AT EURCHF IF YOU TAKE A LOOK AT THE LEFT SIDE OF THE DATA CHART YOU CAN SEE THAT THERE WAS A VERY VERY STRONG SELLER MOMENTUM THAT MOVED PRICE FROM 1.200 TO .9700 MAKING IT A 20% DROP IN PRICE! VERY VERY RARE EVENT TO HAPPEN, BUT THEY DO HAPPEN. WHATEVER THE CAUSE BEHIND THIS WAS, REGARDLESS IT WAS A SIGNIFICANT MOVE FOR A SIGNIFICANT PURPOSE. WHEN A MOVE LIKE THAT HAPPENS IN THE MARKET INSTITUTIONS, BANKS, FUNDS, ETC. DO NOT FORGET THAT MOMENT. IT IS A VERY EMOTIONAL PRICE ZONE. IF YOU TAKE A LOOK BUYERS BROUGHT PRICE ALL THE WAY BACK UP TO TRY AND RECOVER THE DROP THAT HAD HAPPENED IN PRICE. THE MOMENTUM BY THE BUYERS WAS A LOT WEAKER THAN THE SELLER PUSH TO THE DOWNSIDE THAT HAD OCCURRED. WHEN PRICE RE-VISITED THIS ZONE AGAIN THERE WAS A STRONG SELLER REACTION AND NOW AS WE CAN SEE PRICE IS BREAKING STRUCTURE TO THE DOWNSIDE AND SELLERS ARE MOVING PRICE WITH HEALTHY MOMENTUM. KEEP AN EYE ON THIS PAIR TO COME INTO TARGET ZONES AND LETS CONTINUE TO LET THE MARKET DISPLAY TO US WHAT IT WANTS TO DO AND SEE WHO IS IN CONTROL. KEEP AN EYE ON THIS PAIR AND IF AN OPPORTUNITY LINES UP WITH THE MOMENTUM AS WELL AS GOOD RISK/REWARD THAN PUT IT ON WATCH FOR SURE! TOTALLY UP TO YOUR TRADING STYLE. KEEP AN EYE OUT!
CHEERS!
PLEASE LIKE AND FOLLOW MY PAGE FOR MORE ANALYSIS !

USDJPY POTENTIAL SHORT (LAST PUSH) THIS IS A MORE AGGRESSIVE TRADING SETUP BUT I WANTED TO MAKE THIS POST FOR THOSE THAT STILL SEE POTENTIAL IN THIS PAIR. IF YOU LOOK AT USDJPY IT HAS BEEN DOWNTRENDING CONSISTENTLY ON THE DAILY CHART FOR A LITTLE OVER A MONTH NOW. IF YOU LOOK THE SELLERS ARE STILL CREATING NEW LOWS AND PUSHING PRICE ACTION TO THE DOWNSIDE SHOWING THERE IS STILL INTEREST IN SELLING THIS PAIR. IT IS STILL AT A HIGH LEVEL AND BUYERS AREN'T READY TO JUMP IN FROM THE LOOKS OF IT. POTENTIAL QUICK SHORT OPPORTUNITY FOR WHAT I THINK MAY BE A LAST PUSH. WAIT FOR A WEAK BUYER RE-TEST TO THE UPSIDE STRUCTURE AREA OF 107.900 TO ATLEAST GET A BETTER RISK/REWARD SETUP OR CAN TAKE AGGRESSIVE ENTRY IF YOU FEEL THAT IS MORE OF YOUR STYLE. KEEP AN EYE ON THIS PAIR AND THE MOMENTUM AND LEVELS IT HOLDS! KEEP AN EYE OUT!
CHEERS!

EURUSD POTENTIAL LONG OPPORTUNITY (1D CHART) EURUSD POTENTIAL LONG
IF YOU TAKE A LOOK AT THE EURUSD CHART YOU CAN START TO SEE SOME CHARACTERISTICS OF A POTENTIAL BULLISH MOVE ON THIS PAIR. YOU CAN SEE THERE WERE LOWS CREATED AROUND 1.11300 BEFORE PRICE MADE A DOUBLE BOTTOM AND A PUSH TO THE UPSIDE BREAKING RECENT STRUCTURE ON THE DAILY TIMEFRAME. THE SELLERS BROUGHT PRICE BACK DOWN AND AS YOU CAN SEE THE BUYER WAS ANXIOUS TO BUY PRICES AND CREATED A HIGHER LOW ON THE CHART WITH ANOTHER BULLISH MOVE THAT BROKE RECENT STRUCTURE AT THE 1.12700 AREA. IT IS STARTING TI DISPLAY THAT THE BUYER HAS INTEREST IN THIS PAIR AND THAT THE TENDENCIES ARE MOVING OVER TO THE BULLISH SIDE. LETS KEEP AN EYE OUT FOR ANOTHER POSSIBLE WEAK SELLER RE-TEST TO THE DOWNSIDE STRUCTURE AROUND 1.1300 AREA AND A POTENTIAL MOVE TO THE UPSIDE. LETS TAKE A LOOK
1D CHART:
*PRICE IS MAKING HIGHER LOWS
*DOUBLE BOTTOM WITH BUYER MOMENTUM
*WEAK SELLER RE-TEST WITH BUYER PUSH
*BREAKING STRUCTURE TO THE UPSIDE
4H CHART:
*PRICE IS SHOWING THE START OF AN UPTREND TO THE UPSIDE
*RECENT SELLER HAS NOW BEEN BROKEN ON THIS TIMEFRAME
-WHAT I MEAN BY RECENT SELLER IS THE LAST SELLER PUSH TO MAKE THE LOWER LOW (DB)
*LOOK AT THIS CHART FOR BETTER RISK/REWARD ENTRY
REMEMBER TO ALWAYS USE PROPER RISK MANAGEMENT WHEN TRADING. NONE OF THESE SETUPS ARE A GUARANTEE AND ARE PRODUCED FROM TECHNICAL ANALYSIS OF THE MARKET.
PLEASE LIKE AND FOLLOW MY PAGE FOR MORE SETUPS! CHEERS!

USOIL POTENTIAL SHORT (4H & 1D CHART) USOIL POTENTIAL SHORT
OKAY SO I MADE AN ANALYSIS ON THIS COMMODITY A COUPLE WEEKS BACK WITH A LONGER TERM VISION FOR WHAT I BELIEVE WILL BE THE NEXT BIG SWING FOR THIS COMMODITY. AFTER SEEING LAST WEEKS PRICE ACTION THERE WAS A WEAK UPWARD PUSH BY THE BUYERS FOR MOST OF THE WEEK BUT AS YOU CAN SEE PRICE FAILED TO BREAK ABOVE RECENT SELLER AT THE 59 LEVEL AREA. IT WAS FOLLOWED BY A VERY AGGRESSIVE DOWNWARD MOVE IN PRICE DISPLAYING THAT THE PREVIOUS SELLER (WHO IS STILL IN CONTROL) SEEMS TO BE INTERESTED IN CONTINUING PRICE TO THE DOWNSIDE, BASED ON MOMENTUM. THE 1H CHART DISPLAYS A GOOD RISK/REWARD RATIO SETUP IF YOU WAIT FOR A SLIGHT BUYER PULLBACK INTO RECENT STRUCTURE SUPPORT THAT WAS BROKEN ON THE 1H CHART. MAKE SURE IF THERE IS A PULLBACK THAT IT IS NOT SUPER AGGRESSIVE AND MAKE SURE ITS WEAKER MOMENTUM THAN THE RECENT SELLER PUSH. I SAY THIS BECAUSE IF THE MOMENTUM ON THE PULLBACK IS AGGRESSIVE AS WELL THERE ISN'T A DECISIVE DECISION IN THE MARKET ON WHAT THE NEXT MOVE WILL BE. KEEP AN EYE ON THIS COMMODITY AGGRESSIVE TRADERS COULD ALREADY BE SHORT BUT FOR A MORE BULLET PROOF SETUP WAIT FOR SLIGHT WEAK BUYER PULLBACK IF WE GET ONE OR HOP ON OPPORTUNITY OF CONTINUED STRONG SELLER MOMENTUM FOR MORE AGGRESSIVE ENTRY. ALWAYS MAKE SURE YOU KEEP A GOOD RISK/REWARD RATION REGARDLESS IF YOU'RE AGGRESSIVE OR NOT. BECAUSE YOU CAN BE AGGRESSIVE OR CONSERVATIVE AND STILL HAVE YOUR LOSSES LARGER THAN YOUR WINS AND THEREFORE YOU AREN'T BUILDING FOR LONGEVITY. MAKE SURE TO ALWAYS IMPLEMENT PROPER RISK MANAGEMENT AND LETS SEE HOW THIS PLAYS OUT !
CHEERS! PLEASE LIKE AND FOLLOW MY PAGE FOR MORE PROFITABLE SETUPS.

NZDUSD POTENTIAL SHORT (4H TIMEFRAME) NZDUSD POTENTIAL SHORT
OKAY SO I WAS WATCHING THIS PAIR AND ON THE 4H TIMEFRAME IT IS SHOWING ME A GOOD POSSIBLE SHORT OPPORTUNITY. IF YOU TAKE A LOOK AT THIS CHART YOU CAN SEE RECENTLY PRICE ACTION MADE A DOUBLE TOP; MEANING THAT PRICE FAILED TO BREAK NEW HIGHS AND ACTUALLY FELL TO THE DOWNSIDE AND BROKE RECENT STRUCTURE WITH STRONG SELLER MOMENTUM. THIS HAD DISPLAYED STRONG SELLER INTEREST AND AN OPPORTUNITY TO CAPITALIZE ON A POTENTIAL SHORT. LOOK FOR A CONTINUED WEAK BUYER PULLBACK INTO STRUCTURE. REASON WE WANT IT TO BE WEAK MOMENTUM IS BECAUSE THAT WILL BE A SIGN TO US THAT SELLER IS MORE DOMINANT AND JUST LETTING LAST BUYERS TO COME IN AND SELLER CAN TAKE EVEN LITTLE BETTER PRICE TO SHORT FROM (MORE PROFIT). WAIT FOR A PULLBACK INTO THE .66700 ZONE, WILL GIVE BETTER RISK/REWARD RATIO AS WELL AS MORE SOUND STRUCTURED SETUP FOR A POTENTIAL SHORT. IF PRICE ACTION COMES INTO .66700 LOOK FOR STRONG SELLER MOMENTUM TO CONTINUE BECAUSE THIS WILL SHOW THAT SELLER IS STILL INTERESTED. KEEP AN EYE OUT AND LETS SEE HOW THIS PLAYS OUT!
CHEERS!

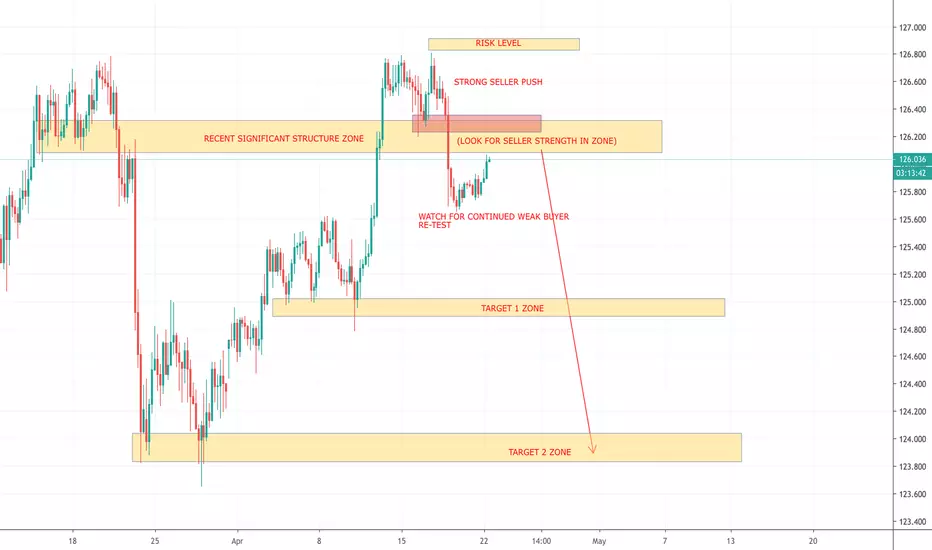
USDCAD POTENTIAL SHORT OPPORTUNITY (1W CHART) OK SO THIS IS A LONGER OUTLOOK ON THIS PAIR BUT WANTED TO MAKE THIS POST BECAUSE THIS IS WHAT THE MARKET HAD BEEN SHOWING ME. IF YOU TAKE A LOOK AT THE LEFT SIDE OF THIS DATA CHART IT SHOWS THAT THERE WAS A STRONG SELLER PUSH TO THE DOWNSIDE FROM MAY, 2017 TO SEPTEMBER, 2017. THIS WAS A LONG DOWNWARD PUSH AND IT CONTAINED GOOD SELLER MOMENTUM AND STRENGTH. IF YOU TAKE A LOOK AT THE CHART DATA FROM THE TIME FRAME OF JANUARY, 2018 UNTIL NOW YOU CAN SEE IT HAS BEEN UPTRENDING. NOT ONLY THAT THOUGH, BUT IT HAS BEEN UPTRENDING WITH WEAKER MOMENTUM THAN THE DOWNWARD PUSH THAT WAS MADE, DISPLAYING THAT THE SELLER CAN EASILY COME BACK INTO CONTROL. IF YOU LOOK AT PRICE ACTION VERY RECENTLY YOU CAN SEE THAT AROUND THE END OF MAY (27TH..) PRICE FAILED TO BREAK THE HIGH MADE IN DECEMBER OF 2018. NOT ONLY DID IT FAIL TO BREAK HIGHER BUT STRONG SELLER MOMENTUM CAME IN SHOWING STRONG INTEREST AS WELL AS A POSSIBLE CHANGE IN MOMENTUM OF TREND. KEEP AN EYE ON THIS PAIR FOR A BREAK OF STRUCTURE AROUND 1.13100 AND A WEAK BUYER RE-TEST BACK INTO STRUCTURE AND LOOK FOR POTENTIAL SHORT.
CHEERS!

USDCHF SHORT PROJECTION (UPDATE) IF YOU LOOK AT USDCHF YOU CAN SEE THAT THE MOMENTUM HAS BEEN ON THE SELLER SIDE AND THIS PAIR HAS BEEN ON THE MOVE TO THE DOWNSIDE. I HAD MADE A POST LAST WEEK SHOWING THE SIGNIFICANT STRUCTURE LEVELS I THINK THIS PAIR COULD POTENTIALLY VISIT. IT HAS ALREADY HIT 2 OF THOSE LEVELS AND BASED ON MOMENTUM IS LOOKING LIKE IT STILL HAS A WAYS TO GO. KEEP AN EYE ON THIS PAIR AND HOPEFULLY YOU'RE CATCHING OPPORTUNITIES FOR SHORTS ON THE WAY DOWN AS LONG AS MOMENTUM PERMITS YOU TO DO SO. KEEP AN EYE OUT!
CHEERS!
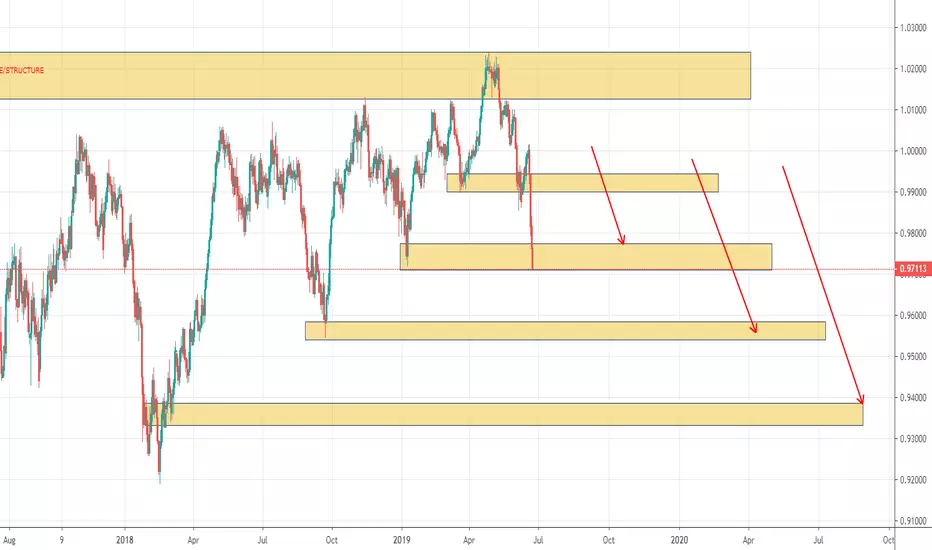
USDCHF POTENTIAL SHORT (LONGER TERM PICTURE) LONG TERM PERSPECTIVE ON USDCHF
I HAVE DONE A FEW POSTS ON THIS PAIR AND BASED ON RECENT SELLER ACTIVITY IT IS STARTING TO SHOW A REACTION FROM MAJOR MULTI-MONTH STRUCTURE/RESISTANCE. BASED UPON PREVIOUS HISTORY AND CONTINUED SELLER INTEREST THIS IS A PERSPECTIVE ON A POTENTIAL SETUP FOR THE PAIR. KEEP AN EYE OUT AND LOOK FOR CONTINUED SELLER INTEREST AND MOMENTUM FOR THIS PAIR. WEEKLY CHART SHOWS BUYERS ATTEMPTING TO PUSH THE MARKET TO THE UPSIDE AND THE SELLERS PULLING IT DOWN WITH STRENGTH. KEEP AN EYE OUT FOR A GOOD POSSIBLE RISK/REWARD RATION SETUP. LONGER TERM VISION. CHEERS!

CRUDE OIL SHORT OPPORTUNITY 1D AND 1W CHARTSCRUDE OIL POTENTIAL SHORT
OKAY SO I HAVE BEEN WATCHING CRUDE OIL FOR SOME TIME NOW WATCHING TO SEE HOW PRICE WOULD REACT AFTER A VERY STRONG SELLER PUSH AND OBSTRUCTION OF STRUCTURE ON DAILY TIMEFRAME. AFTER LETTING THE BUYER MARKET CREATE SOME BREATHING ROOM, AS WELL AS A BETTER RATE FOR SELLERS TO SELL FROM IT IS STARTING TO DISPLAY INTEREST ON THE SELLER SIDE. THIS PULLBACK ALSO CREATED A BETTER RISK/REWARD RATIO ON THIS SETUP. WATCH ON 1H AND 4H TIMEFRAMES TO LOOK FOR SELLER POWER TO COME IN FOR MORE PRECISE ENTRIES AND RISK LEVELS. THIS MAY TAKE SOME TIME TO COME INTO FRUITION BUT MARKET IS DISPLAY A HIGH PROBABLE MOVE TO THE DOWNSIDE. EXPECTING A EQUAL MEASURED MOVE TO DOWNSIDE.
I USUALLY DON'T TRADE COMMODITIES TOO OFTEN BUT HUMAN PSYCHOLOGY NEVER CHANGES THEREFORE ALL MARKETS WILL BE SIMILAR WITH SUPPLY AND DEMAND AND WHEN YOU BREAK IT DOWN THAT WAY IT MAKES IT A LOT MORE SIMPLE. THE PRINCIPLES OF SUPPLY AND DEMAND DO NOT CHANGE NO MATTER WHAT FINANCIAL INSTRUMENT YOU ARE TRADING. KEEP YOUR EYE ON THIS PAIR FOR POTENTIAL SHORT OPPORTUNITY !
ALWAYS REMEMBER TO IMPLEMENT PROPER RISK/REWARD WITH EACH SETUP YOU ARE CONSIDERING AND KNOW THIS IS JUST ANALYSIS THERE IS NO GUARANTEE AT ANY SETUP IN ANY MARKET.
CHEERS!

USDCHF POTENTIAL SHORT (4H/1D TIMEFRAME) USDCHF POTENTIAL SHORT
OKAY SO I'M GOING TO KEEP THIS POST REAL SIMPLE. SELLER POWER STARTING TO DISPLAY ON 4H AND DAILY TIMEFRAME. AT A VERY SIGNIFICANT WEEKLY STRUCTURE RESISTANCE. LOOKING FOR A WEAK BUYER PULLBACK INTO STRUCTURE AND SELLER INTEREST TO COME BACK IN. ENJOY!
PLEASE LIKE AND FOLLOW MY PAGE FOR MORE PROFITABLE SETUPS!
P.S. GJ SETUP STILL PLAYING OUT FROM LAST WEEK, CHEERS!

GBPJPY POTENTIAL SHORT (1D CHART) GBPJPY POTENTIAL SHORT
OKAY LETS TAKE A LOOK AT GBPJPY.JUST WANT TO LET YOU KNOW THIS CHART IS A LITTLE BIT MORE DETAILED THAN THE POSTINGS I USUALLY DO. I FELT THAT ALL OF THE ANALYSIS AND TOOLS USED WERE TO APPROPRIATELY ANALYZE THE HIGHEST PROBABLE MOVE IN THIS PAIR. AFTER LOOKING AT THIS CURRENCY PAIR AND THIS LAST WEEK OF PRICE ACTION, THE MARKET HAS BEEN SHOWING ME THAT THE SELLERS WANT TO TAKE PRICE TO THE DOWN SIDE. IF YOU LOOK AT DATA FOR THE LAST 6 MONTHS ON THIS PAIR YOU CAN SEE THE DOMINANT SELLER ACTIVITY THAT HAS BEEN OCCURING. RECENTLY FOR THE PAST 1-2 MONTHS PRICE HAS STAYED IN A ZONE THAT HAS BEEN SQUEEZING PRICE IN, BUT STILL SHOWING GOOD SELLER MOMENTUM AS THIS WAS HAPPENING. AFTER A RECENT BREAK OF THIS STRUCTURE SQUEEZE TO THE DOWNSIDE, IT IS DISPLAYING THAT THE SELLERS WANT TO TAKE PRICE DOWN. IT ALSO DISPLAYS THAT THE DEMAND TO BUY ISN'T AT THE LEVEL IT NEEDS TO BE YET SO PRICE MUST DROP (DISCOUNT) IN ORDER FOR LARGER PLAYERS TO GET THE GBP/JPY AT A GOOD PRICE/RATE. LETS TAKE A LOOK
1D CHART:
*PRICE RECENTLY BROKE SQUEEZE OF STRUCTURE TO DOWNSIDE
*GOOD SELLER MOMENTUM/SELLER SHOWING INTEREST
4H TIMEFRAME:
*USE THIS TIMEFRAME TO GET A BETTER GAGE ON SPECIFIC PRICE ACTION
*ALSO USE THIS TIMEFRAME FOR BETTER RISK/REWARD PLAN
*THIS TIMEFRAME WILL GIVE YOU MORE EFFECTIVE APPROACH, 1D AND 4H TIMEFRAME ARE CLOSE ENOUGH, IN TERMS OF THE TIMEFRAME OF DATA DISPLAYED, TO GET AN APPROPRIATE GAGE AND PERSPECTIVE, ON WHAT THE MOMENTUM OF PRICE IS DOING
PLEASE MAKE SURE TO ALWAYS IMPLEMENT PROPER RISK ON EVERY SETUP. MY POSTS ARE FOR REFERENCE AND SHOULDN'T BE USED WITHOUT UNDERSTANDING FULL RISK OF FINANCIAL MARKETS.
PLEASE FOLLOW ME FOR MORE PROFITABLE SETUPS!

EURJPY POTENTIAL SHORT OPPORTUNITY EURJPY POTENTIAL SHORT
IF YOU LOOK AT THIS CURRENCY PAIR YOU CAN SEE THAT ON THE LEFT HAND SIDE OF THE 4H CHART THE DATA IS DISPLAYING VERY STRONG SELLER MOMENTUM OCCURRING. WHEN YOU APPLY THAT TO RECENT DATA MOVEMENT YOU CAN SEE THAT THERE WAS A STRONG SELLER PUSH TO THE DOWNSIDE LAST WEEK ON THE 4H CHART AS WELL AS A BREAK OF RECENT STRUCTURE. THIS IS SHOWING THAT THERE IS A HIGHER PROBABLE CHANCE OF THE MARKET CONTINUING TO THE DOWNSIDE. KEEP AN EYE ON THE MOMENTUM OF THIS RE-TEST INTO STRUCTURE. THE RE-TEST WILL GIVE A 75-80% BETTER DISPLAY OF WHAT THE NEXT PROBABLE MOVE COULD BE. MAKE SURE IT CONTINUES TO BE WEAKER THAN THE DROP FROM LAST WEEK. LETS BREAK IT DOWN
1D CHART:
*STRONG SELLER MOMENTUM AS WELL AS BEARISH ENGULFING CLOSE ON THIS TIMEFRAME CHART
4H CHART:
*ON THIS TIMEFRAME WE SAW A STRONG SELLER REACTION IN RECENT SIGNIFICANT STRUCTURE
*STRONG PUSH AS WELL AS OBSTRUCTION OF STRUCTURE ON THE 4H TIMEFRAME CREATING A LOWER LOW
1H CHART:
*ON THIS TIMEFRAME YOU CAN UTILIZE THE DATA TO BE ABLE TO GET A BETTER IDEA OF MOMENTUM COMING INTO PLAY BEFORE THE LARGER MOVE HAPPENS
*WATCH THIS TIMEFRAME FOR ACCURACY OF ENTRY AS WELL AS RISK/REWARD RATION COMPARISON
PLEASE LIKE AND FOLLOW MY PAGE FOR MORE PROFITABLE SETUPS! CHEERS!
USD/JPY - Diamond TopsD1 Timeframe - 1.Reversal Pattern being created ( Diamond Tops)
2. 50% Fibonacci level tested, showing some resistance, nice to the bears
3. Impulsive wave getting finished , some correction to start?
H4 Timeframe - 1. Sellers are showing some good strong
2. Level 50 from Moving Average was crushed by the bears.
I guess the pair will go short for now.
