Selloff

Sell-off of Mt Gox stash of bitcoin worth $US1.7 billionKobayashi’s transactions published indicate that the mass sell-off of the Mt Gox BTC was potentially a driving force behind the December 2017 and January 2018 Bitcoin pricing slump.
many are hopeful that with waiting for the next Mt. Gox court date, Kobayashi won’t be able to dump another load of coins on the market. But, in fact, the September 18th court hearing is irrelevant
because Kobayashi already has been authorized to sell-off meaning he doesn’t have to wait to off-load more coins. But perhaps waiting anyway. In any case there will be a mass dump at some point.
It emerged that the trustees of bankrupt Japanese exchange Mt Gox had sold bitcoin holdings worth $US400 million since the end of last year.
Mt Gox has a stash of bitcoin worth $US1.7 billion that will be dumped onto the market at a later date.

Update it Didn't get my hedge but the top here is way too clean for it to be a real top imo... liquidity above waiting to be taken...
probably tap the 6350 then head back towards top of range//possible break up into 6800+
Removed hedge orders for now and will re-evaluate.... overall net long

BTC/USD Breakout Downwards BTC has traded sideways multiple times in the past, as we know this makes for violent breakouts towards the up or down side. The bollinger bands charted are constricting, suggesting potential volatility in the near future. The Triangle does include 3 higher lows , however since we are in a bear market it is safe to assume the breakout will be downwards. The RSI is not yet oversold or overbought, and suggest we may go sideways for a little longer. Overall, I believe BTC will retest that 6.1k bottom we saw a week ago.

ETHUSD : Trading update 7th of JuneFirst had a downtrending channel, recently price broke out of this channel, but finds it hard to break clearly.
Matching up a zone of resistance and an area that looks like a double shoulder head and shoulder pattern, price is more likely to go down and test the lows for a potential bottom in the market.
Conclusion: View is neutral until it either breaks the 630 or 490 barrier. Shorter term views, a more negative outlook, maybe price will retest at 630 and then drop off.

Sell offs are getting predictable Simpsons are everywhere. These sell offs do not seem so natural anymore. I would look for these Simpson patterns cause they seem pretty predictable

[ETH] Levels and Zones to Watch if (when) ETH Continues DownUpdated the key levels I'm watching for potential bounces, reversals, consolidations, etc. on ETHUSD as we wait for consolidation to end after heavy selling last couple days. The last chart I posted showed a channel, which I was surprised had broken down so quickly and violently just after already strong bear moves. Volume is spiking here on the daily chart.
As you can see I've got a No Buy Zone labeled, which we are currently consolidating right at the top of. This consolidation could be prolonged quite a while and might rotated about the $590 axis. The zone had no resistance on the way up and likely needs to be "Traded Out" so to speak.
Below that, a POTENTIAL Reversal Zone could be around the top of the massive green candle we had in early April. That movement was so abnormal (in BTC anyways) that I think it's likely we'll go down to at least test that price before buying significantly.
Scenarios:
1) We move sideways for a long time in the No Buy Zone then grind back upwards. (BULL, 50/50 CHANCE)
2) Rocket out above $600, little resistance, retest $590, strong support, Lambos on the Moon, yada yada yada. (STRONG BULL, LOW CHANCE)
3) Continuation Pattern forms and breaks down from No Buy Zone, then look for possibilities of Potential Reversals in the $475-ish area. This would allow us to establish a higher low and maintain convergence pattern towards an equilibrium. (BEAR, HIGH CHANCE)
4) Current leg of downtrend doesn't last, consolidation is short, drop straight through under $500 in the next couple days. From there, who knows tbh. Perhaps we bounce of the solid red line of long-term support, but it's too soon to say, could go even lower afterwards even. (STRONG BEAR, 50/50 CHANCE)
Bottom line, at this point the bears clearly have the floor, we'll see where they place it.

[ETH] Snapshot of Trendlines and Levels to Watch for ETHETH bouncing off my lower channel trendline purple. It's hard to say if it'll make it back up to the top of the channel.
Perhaps it can only bounce to the dotted red line which is an equilibrium level recently and historically. May not even recover that high though!
78.6% Fib Retrace level also seems to be providing the support (so far, 4-hr RSI deep oversold).
Just watching these levels for now.

[EOS-ETH] EOS-ETHERIUM KILLER ROCKS!Closed my position on this trade. Took a nice profit of 81.85% from this swing trade in 5 days. This was nice. EOS is completely overbought in my opinion. It has already sold over 12% and I believe will start dumping hard. EOS is considered to be the etherium Killer! This block chain in my opinion will rock into the future very well!
PS This is not financial advice. Do your own TA, give me a like and support my channel if you like my content!
Thanks
CryptoBuzzAnalyst

BTC: Beware the Bearish GartleyCould be a good idea to lock in some profits just in case BTC has a deep correction. The .774 across the top is very close to an exact .786 for a Bearish Gartley setup. Adam & Eve should still be in play even this correction.


BTC: Rome Wasn't Built in a DayMajor resistance met after a straight shot up. A pullback to retest the log line for the first time and inverse head n shoulders would be healthy. Still, BTC remains climbing and could keep pressing higher, though a Leaning Tower of Pisa might not recover as well compared to the scenario above once it finally gets it first true correction. Either way, it's always an interesting time in the crypto space.

Possible Inverse Head n Shoulders if we do Drop LowerAll eyes on the multiple-support zone in the upper 7400's.

BTC: Bollinger Band + EMA AnalysisBTC has reached the top of the Bollinger Bands on the 1D, and is due for a correction and a probable bounce near the 14-Day EMA. This EMA has come in as resistance multiple times on BTC's recent big move down, so it will likely come in as support along with prior price structure support.
For a more detailed current analysis to include fib and elliot wave predictions, see my other recent posts on BTC.

BTC Prediction: Dip Before the Moon, Big Support at 7490.This is a 1D chart analysis; for further detailed analysis on this prediction see the 4h analysis I just posted using the Bitmex (XBT) chart.
BTC has had a phenomenal bullish wave upward. Now there is a good chance BTC will pull back on a healthy correction to test prior price structure support and the long-term uptrend support line shown here before making another leg higher.

Detailed BTC Prediction: Ready Your OrdersBTC Forecast on the Four Hour:
Bulls have defended against a short-term head & shoulders (on smaller timeframes), though momentum is slowing and a bear flag forming here on the 4h.
We can expect a correction down to test prior price structure support around 7490 before continuing upward to attempt further bullish elliott waves. Two sets of fibs are drawn on the chart to indicate two fib levels around 7490 in addition to the structure support.
Keep in mind we could overextend downward, or alternatively show more bullish strength and bounce higher than this target, but there is a strong probability of a retracement to this green region should bears push us down out of the current flag.

BTC support resistance and Death CrossAfter death cross, BTC looks no good. New target is about 2500$.

BTC Daily always failed in the chartlatest, we can see the failed flat pattern, if we cross the RSI trend downward, selloff will occur.

EOS to Correct Soon, Lock in ProfitsTaking fibs from the full price action (wick to wick) of its last major dump, EOS is now wicking down directly off the 618.
Unless BTC shows more bullish strength on smaller timeframes, which is currently waning, EOS will have a hard time clearing the 618 and running for the 786 and the prior price resistance up there.
The best offense being a good defense, consider locking in profits and protecting your capital if EOS gets a small pop back up to retest the 618, where a double-top would be highly probable unless BTC shows that further bullish momentum.

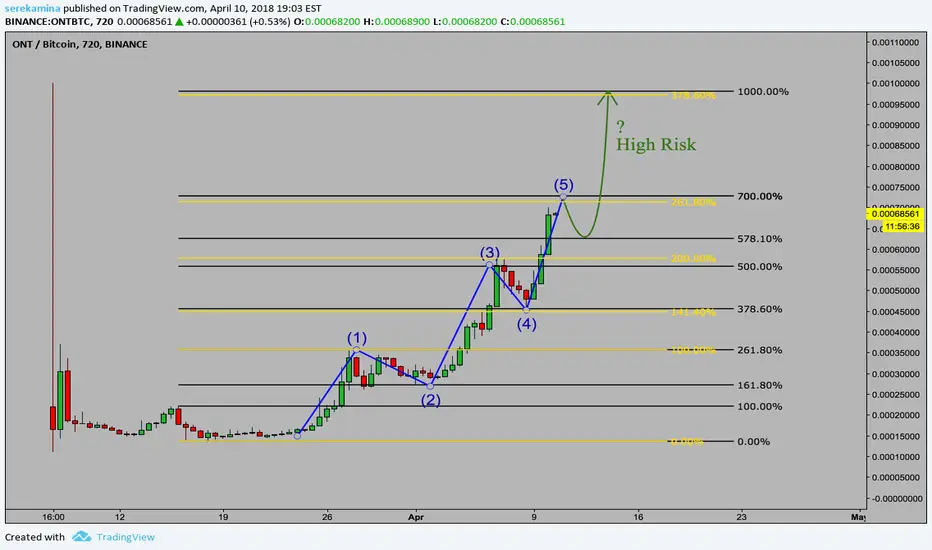
ONT to Correct Soon, Protect your CapitalONT is on its 5th elliott wave and due for a steeper correction soon.
Taking fibs from the initial pump (the black fibs), ONT has hit common targets so far:
First the 261.8 and then the 500 extension, each receiving a decent pullback.
Now a safe exit would be the 700 extension very soon, verified with the second set of yellow fibs where traders will be looking to exit the yellow 261.8 (near the black 700) since it will correlate with when wave 1 corrected after hitting the 261.8 on the black fibs.
However, if BTC holds up OK without showing immediate signs of dumping, the pump could continue to the 1000 extension.
Swing traders: consider protecting your capital and exiting the 700 and monitoring to buy the dip if it still looks strong to ride the 1000 line exit.
Long-term hodlers continue to hold.

IOTA + BTCUSDT = LONG, PIVOTAfter 3 days of my analysis...btcusdt, on pivot, and iota on pivot, 75% breakout on 1 2 and 3 resistence, pivot...simple.

WHEAT/USD HOLD ON GUYS! (UPDATE)So guys I'm currently waiting for a decisive break out of our key level.
PATIENCE GUYS, let's just be patient!
