CAD/JPY Short Term SellBased on our weekly analysis yesterday, CADJPY is one of our Sell Pairs. We are trading the CAD/JPY for a short-term sell looking for a target below 113.30. Stop loss above 114.40.
Sellsetup

Gold (XAU/USD): Potential High Probability SELL setupGold (XAU/USD) presents a compelling sell opportunity if the price retraces to the descending trend line around the 2350.00 region. Look for bearish entries at this level, targeting the initial support zone at 2285.50 as TP1. Should the downtrend continue, aim for TP2 at the ascending trend line, capturing further downside potential.

GBP/USD: 350 Pips Sell from Third Trend Line BounceGBP/USD is in the midst of a compelling sell-off following its third bounce off a critical descending trend line on the daily chart, reinforcing a strong bearish trend purely through price action. The pair has started its descent from the 1.2850 area and is expected to plummet 350 pips, targeting the 1.2500 level. This classic technical setup underscores the power of trend line resistance in dictating market direction. Jump into this move to capitalize on the ongoing momentum, aiming for significant gains as the price heads towards the key support zone!

GBPUSD 350 PIPS SELLExpecting GU to respect this 3rd touch of the Daily trend line and move all the way down as price is already showing signs of reversal with previous Daily candle closing Bearish

AUDUSD 300PIPS SELLPrice is currently rejecting the Daily trend line for the forth time, expecting price to push all the way down to the Daily lows. Lets see how this plays out

ADP - NF has a negative impact on Gold?⭐️ Smart investment, Strong finance
⭐️ GOLDEN INFORMATION:
Gold price (XAU/USD) came under renewed selling pressure on Tuesday and dropped to the $2,316-2,315 area, back closer to a multi-week low touched the previous day in the wake of a modest US Dollar (USD) strength. The attempted USD recovery from over a two-month low, however, lacked follow-through on the back of growing acceptance that the Federal Reserve (Fed) will start cutting interest rates later this year, bolstered by softer US macro data. The expectations keep the US Treasury bond yields depressed, which, in turn, is seen benefitting the non-yielding yellow metal during the Asian session on Wednesday.
⭐️ Personal comments NOVA:
Gold price continues to dispute the price range 2320-2340, still moving within the 2 H1 trend lines. Wait for BREAK points for upcoming trends
⭐️ SET UP GOLD PRICE:
🔥BUY GOLD zone: $2305 - $2307 SL $2300
TP1: $2312
TP2: $2320
TP3: $2330
🔥SELL GOLD zone: $2348 - $2350 SL $2355
TP1: $2340
TP2: $2330
TP3: $2320
⭐️ Technical analysis:
Based on technical indicators EMA 34, EMA89 and support resistance areas to set up a reasonable SELL order.
⭐️ NOTE:
Note: Nova wishes traders to manage their capital well
- take the number of lots that match your capital
- Takeprofit equal to 4-6% of capital account
- Stoplose equal to 2-3% of capital account
- The winner is the one who sticks with the market the longest

XAU/USD SELL NOWHi traders we have potential sell trade on XAU/USD. we having lower high and higher low on 15 minutes just created our high and we looking to trade downside.

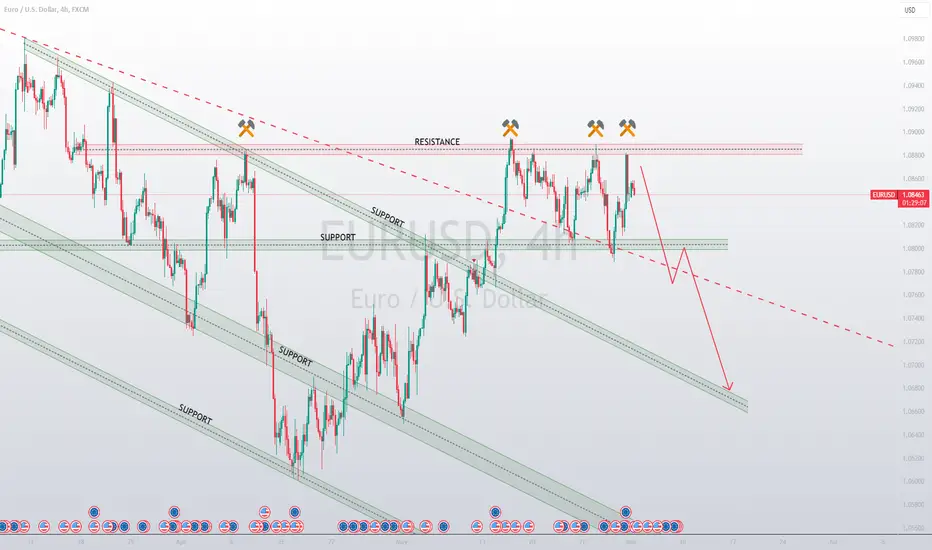
Sell EURUSDThe EURUSD pair has rejected the resistance zone at least four times and is now indicating a potential reversal to the downside. The price action on the EURUSD chart is showing signs of exhaustion as it struggles to break above the resistance zone. Traders are closely monitoring the key support levels for any potential breakdown, which could lead to a shift in market sentiment towards a bearish outlook.
DISCLAIMER
The signals provided by LeoDante_FX are for informational purposes only and do not constitute investment advice. We do not guarantee the accuracy, completeness, or timeliness of the signals, and we are not responsible for any losses or damages arising from the use of our signals.
Gold price continues to adjust DOWN⭐️ Smart investment, Strong finance
⭐️ GOLDEN INFORMATION:
Gold price (XAU/USD) trades lower on Thursday due to a stronger US Dollar (USD) and higher US yields. The reduced expectation of a September rate cut by the Federal Reserve (Fed) is putting pressure on gold as it increases opportunity costs. The second estimate of Q1 2024 US Gross Domestic Product (GDP) will be closely watched by investors, as a stronger-than-expected reading could further strengthen the USD and weigh on gold. However, geopolitical tensions in the Middle East may support gold as a safe-haven asset. Additionally, increased demand from central banks may limit downside for gold in the near term.
⭐️ Personal comments NOVA:
Gold continues its DOWN trend amid easing military tensions. Mainly waiting for US economic data to be released
⭐️ SET UP GOLD PRICE:
🔥BUY GOLD zone: $2315 - $2317 SL $2312 scalping
TP1: $2320
TP2: $2325
TP3: $2330
🔥BUY GOLD zone: $2305 - $2307 SL $2300
TP1: $2315
TP2: $2322
TP3: $2330
🔥SELL GOLD zone: $2364 - $2366 SL $2370
TP1: $2358
TP2: $2350
TP3: $2340
⭐️ Technical analysis:
Based on technical indicators EMA 34, EMA89 and support resistance areas to set up a reasonable SELL order.
⭐️ NOTE:
Note: Nova wishes traders to manage their capital well
- take the number of lots that match your capital
- Takeprofit equal to 4-6% of capital account
- Stoplose equal to 2-3% of capital account
- The winner is the one who sticks with the market the longest

GBPUSD → Trade Analysis | SELL SetupGBPUSD is trading near the lower boundary of the descending channel.
The price has fallen under the dynamic support, which now acts as resistance.
We expect the decline to continue after testing the lower boundary of the channel.
Hello Traders, here is the full analysis.
I think we can soon see more fall from this range! GOOD LUCK! Great SELL opportunity GBPUSD
I still did my best and this is the most likely count for me at the moment.
-------------------
Traders, if you liked this idea or if you have your own opinion about it, write in the comments. I will be glad 🤝

USTEC SELL Monthly Structure Analysis and Trade SetupThe USTEC monthly structure on the daily timeframe is represented by OHLC, indicating a Sell Setup . We are currently waiting for a bearish TDI cross on the daily chart to confirm the presence of sellers in the market. Additionally, the candle formation at the high is an evening star pattern, which signals a potential reversal .
If the trade moves in our favor, I have identified three take profit targets:
1. First Take Profit: 18,485.24
2. Second Take Profit: 18,193.98
3. Third Take Profit: 17,958.57
Trade with caution. If you find this post useful, please like, follow, share, and leave a comment.

Gold recovered slightly in the first session of the week⭐️ Smart investment, Strong finance
⭐️ GOLDEN INFORMATION:
Gold price (XAU/USD) gains strength on Monday, supported by a weaker US Dollar and escalating geopolitical tensions in the Middle East. The long-term outlook remains positive due to increased demand from central banks. However, expectations of fewer rate cuts by the Federal Reserve and a hawkish stance from Fed officials may put some selling pressure on gold as higher interest rates make it less attractive as a store of value.
⭐️ Personal comments NOVA:
Gold price recovered slightly in the first session of the week, still in a DOWN correction in the H1 and H4 frames
⭐️ SET UP GOLD PRICE:
🔥BUY GOLD zone: $2306 - $2304 SL $2298
TP1: $2315
TP2: $2322
TP3: $2330
🔥BUY GOLD zone: $2321 - $2319 SL $2316 scalping
TP1: $2326
TP2: $2332
TP3: $2340
🔥SELL GOLD zone: $2354 - $2356 SL $2361
TP1: $2348
TP2: $2340
TP3: $2330
⭐️ Technical analysis:
Based on technical indicators EMA 34, EMA89 and support resistance areas to set up a reasonable SELL order.
⭐️ NOTE:
Note: Nova wishes traders to manage their capital well
- take the number of lots that match your capital
- Takeprofit equal to 4-6% of capital account
- Stoplose equal to 2-3% of capital account
- The winner is the one who sticks with the market the longest

US30 Alert: Key Sell Opportunity and Potential Bullish Surge!Greetings Traders!
Brief Description🖊️:
Today, I am focusing on trading the US30, with an interest in taking a selling opportunity to reach the H4 bullish order block.
Things I Have Seen👀:
Liquidity Engineering🔄: Currently, price is engineering liquidity right above the H4 bullish order block using a retail pattern (support zone).
Confirmation Buy Zone🟢: Once the price reaches the H4 bullish order block, I will look to buy against the sell stops (stop losses) upon confirmation.
Bullish Targets📈:
-1st Objective (H1 Buy Stops): Anticipating price having to reach into the H1 buy stops, which is high probable.
-2nd Objective (Daily FVG): Anticipating a minor bullish run to reach and potentially fill the DAILY timeframe Fair Value Gap (FVG).
What's Important Now❗
Time is crucial. I only trade indices during the New York session morning and afternoon due to the favorable volatility. Stay observant for real-time developments.
Stay tuned for a video analysis on the US30.
Best Regards,
The_Architect

Sideway, correction DOWN!! XAU✍️ NOVA hello everyone, Let's comment on gold price next week from 5/27 - 5/31/2024
🔥 World situation:
Gold price stabilized on Friday after two consecutive days of losses, increasing by 0.23%. However, it experienced a weekly decline of more than 3%, marking the largest weekly loss since December 2023. The better-than-expected US Durable Goods Orders data had a reduced impact due to a downward revision in the previous month's reading, which encouraged buying of gold. The XAU/USD is currently trading at $2,332 after reaching a daily low of $2,325. Gold traders reacted before the weekend as US business activity improved, reducing the likelihood of a rate cut by the Federal Reserve (Fed). As of now, fed funds rate futures estimate only a 25 basis point interest rate cut in 2024.
🔥 Identify:
Gold price is in a DOWN correction, but sales volume is decreasing. Economics and politics are in a period of hesitation, Gold prices will mainly sideways in the range from $2300 - $2350 next week.
🔥 Technically:
Based on the resistance and support areas of the gold price according to the H4 frame, NOVA identifies the important key areas as follows:
Resistance: $2363, $2395, $2442
Support : $2306, $2280
🔥 NOTE:
Note: Nova wishes traders to manage their capital well
- take the number of lots that match your capital
- Takeprofit equal to 4-6% of capital account
- Stoplose equal to 2-3% of capital account
- The winner is the one who sticks with the market the longest

PMI continues to pressure Gold downward !!⭐️ Smart investment, Strong finance
⭐️ GOLDEN INFORMATION:
Gold price (XAU/USD) continues to decline due to the Federal Open Market Committee (FOMC) minutes being interpreted as more hawkish. This has limited the upside potential for gold. The cautious approach of the US Federal Reserve to maintain its restrictive policy for longer has boosted the strength of the US dollar, putting downward pressure on gold. Traders will monitor the preliminary reading of the US Manufacturing and Services Purchasing Managers Index (PMI) for May, as a weaker reading could spark hopes of rate cuts by the Fed and support gold prices. Geopolitical tensions, uncertainties, and inflation concerns may also provide some support for gold in the short term. Other factors to watch include the Chicago Fed National Activity Index, weekly Initial Jobless Claims, New Home Sales, and comments from Fed's Bostic.
⭐️ Personal comments NOVA:
Gold fell after yesterday's FOMC meeting - quite tough statements on inflation. When the Gold price reaches a new ATH peak, it is obvious that a downward adjustment will create more liquidity for the market, the price will continue to be under selling pressure today and tomorrow.
⭐️ SET UP GOLD PRICE:
🔥BUY GOLD zone: $2347 - $2345 SL $2340
TP1: $2352
TP2: $2360
TP3: $2370
🔥SELL GOLD zone: $2403 - $2405 SL $2410
TP1: $2395
TP2: $2380
TP3: $2370
⭐️ Technical analysis:
Based on technical indicators EMA 34, EMA89 and support resistance areas to set up a reasonable SELL order.
⭐️ NOTE:
Note: Nova wishes traders to manage their capital well
- take the number of lots that match your capital
- Takeprofit equal to 4-6% of capital account
- Stoplose equal to 2-3% of capital account
- The winner is the one who sticks with the market the longest

USDCADIs USDCAD exhausting at strong resistance level?
As the price is been on high bull run but now it seems like price is lacking bullish momentum after reaching at resistance level and bearish divergence suggesting the sell pressure is about to start.
If the bears took control , the 1st target could be 1.3630 followed by 1.3530.
What you guys think of it?

GBPUSD Bearish Reversal: Key Sell Opportunity Ahead!Greetings, Traders,
Currently, on the H1 timeframe, the price is indicating a potential reversal. We have observed a market structure shift, suggesting that the internal structure has turned bearish. With this information, we focus on premium points of interest, such as the H1 bearish order block that the price has tapped into, which aligns with the Fair Value Gap (FVG) that has been completely filled. This confluence suggests looking for sell-side delivery towards the daily FVG, which serves as our draw on liquidity.
Kind Regards,
The_Architect

Gold price falls - sideway adjustment⭐️ Smart investment, Strong finance
⭐️ GOLDEN INFORMATION:
Gold price (XAU/USD) trades lower on Wednesday after pulling back from a recent high. The Federal Reserve (Fed) has expressed the need for stronger evidence of easing inflation before considering interest rate cuts, implying that rates will likely remain higher for an extended period. This could potentially strengthen the US dollar and weigh down gold prices, although factors like US-China trade tensions, geopolitical tensions in the Middle East, and demand from central banks and Asian buyers may limit the metal's downside. Today, gold traders will focus on the release of FOMC Minutes and a speech by Fed's Goolsbee.
⭐️ Personal comments NOVA:
Gold price adjusted down within the H1 trend line, sideway accumulation
⭐️ SET UP GOLD PRICE:
🔥BUY GOLD zone: $2407 - $2409 SL $2404 scalping
TP1: $2413
TP2: $2418
TP3: $2425
🔥BUY GOLD zone: $2399 - $2397 SL $2392
TP1: $2405
TP2: $2415
TP3: $2430
🔥SELL GOLD zone: $2440 - $2442 SL $2447
TP1: $2430
TP2: $2425
TP3: $2417
⭐️ Technical analysis:
Based on technical indicators EMA 34, EMA89 and support resistance areas to set up a reasonable SELL order.
⭐️ NOTE:
Note: Nova wishes traders to manage their capital well
- take the number of lots that match your capital
- Takeprofit equal to 4-6% of capital account
- Stoplose equal to 2-3% of capital account
- The winner is the one who sticks with the market the longest

Gold price adjusted - slightly decreased⭐️ Smart investment, Strong finance
⭐️ GOLDEN INFORMATION:
Gold price (XAU/USD) loses recovery momentum due to lack of fresh catalysts in a quiet session. However, renewed demand is supported by bets on interest rate cuts from the US Federal Reserve, geopolitical tensions, and strong demand from central banks and Asian buyers. Traders will focus on Fedspeak and the upcoming FOMC Minutes. Hawkish stance from Fed officials may lift the Greenback and lower USD-denominated Gold.
⭐️ Personal comments NOVA:
Gold price in the short-term adjustment price line - creating liquidity for the market. Pay attention to the short support zones $2400, $2390
⭐️ SET UP GOLD PRICE:
🔥BUY GOLD zone: $2392 - $2390 SL $2385
TP1: $2400
TP2: $2410
TP3: $2420
🔥SELL GOLD zone: $2454 - $2456 SL $2461
TP1: $2448
TP2: $2440
TP3: $2430
⭐️ Technical analysis:
Based on technical indicators EMA 34, EMA89 and support resistance areas to set up a reasonable SELL order.
⭐️ NOTE:
Note: Nova wishes traders to manage their capital well
- take the number of lots that match your capital
- Takeprofit equal to 4-6% of capital account
- Stoplose equal to 2-3% of capital account
- The winner is the one who sticks with the market the longest

GBPUSD at Resistance zoneThe trendline has been a significant price barrier, having been rejected multiple times before. It is probable that price will be rejected once again.
Search for a selling opportunity and aim to profit at the lower support level. Look for confirmation signals such as bearish candlestick patterns or a decrease in buying volume to strengthen the selling opportunity. Keep a close eye on the price action as it approaches the lower support level for potential exit points.
Remember to manage risk carefully and consider setting stop-loss orders to protect your capital in case the trade goes against you.

BITCOIN in a range.The price of Bitcoin has been moving in sideways for some time now. Any time the price moves into the 70,000 range the bears step in and push the price lower.
I think it will be the same this time.
Look for opportunities to sell into the 60,000 level.

GBPUSD Sell Alert: Major Bearish Shift Ahead - Act Now!Currently, GBPUSD is signaling a potential reversal, indicating a shift towards bearish institutional order flow. We may see the price target sell-side objectives such as the H1 sell stops, with further movement towards the Daily Fair Value Gap (FVG) throughout the week.
For confirmation, I monitored the manipulation of the Asian session high during the London session. According to the Power of 3 strategy, London often sets the day's high when bearish momentum is expected, leading to a price distribution towards the downside.
In terms of take profits, you can distribute them as you see fit. I will be aiming for a 1:4 risk-to-reward ratio, but if your entry was a bit late, you might consider targeting the Daily Fair Value Gap (FVG).
To understand why I'm anticipating bearish momentum on GBPUSD, please watch this video for a comprehensive breakdown of this week's trading outlook.
Kind Regards,
The_Architect

GBPUSD Trading Insights: Capitalizing on Bearish Opportunities!Dear Traders,
On Friday, the GBPUSD experienced significant volatility, leading to a notable upward movement. This action resulted in the formation of a Low Resistance Liquidity Zone, indicating minimal resistance for price movement through this area. Additionally, the price left relatively equal lows, suggesting the presence of H4 Sell Stops. We anticipate the price to target this area, which aligns with the Daily Fair Value Gap (FVG), drawing liquidity in that direction.
Currently, we are considering two scenarios for potential confirmation entries towards our objectives:
H1 Bearish Order Block : We are at an H1 bearish order block, and a price sell-off from this point is possible if we receive the appropriate confirmation signals.
H1 Buy Stops : Alternatively, the price may trigger the H1 Buy Stops. In this scenario, we expect smart money to take positions against these buy stops, creating selling opportunities. Confirmation entries will be considered if this occurs.
Please stay tuned for our upcoming weekly video outlook on GBPUSD, where we will provide further insights and detailed analysis.
Best regards,
Kind Regards,
The_Architect
