Sellsetup
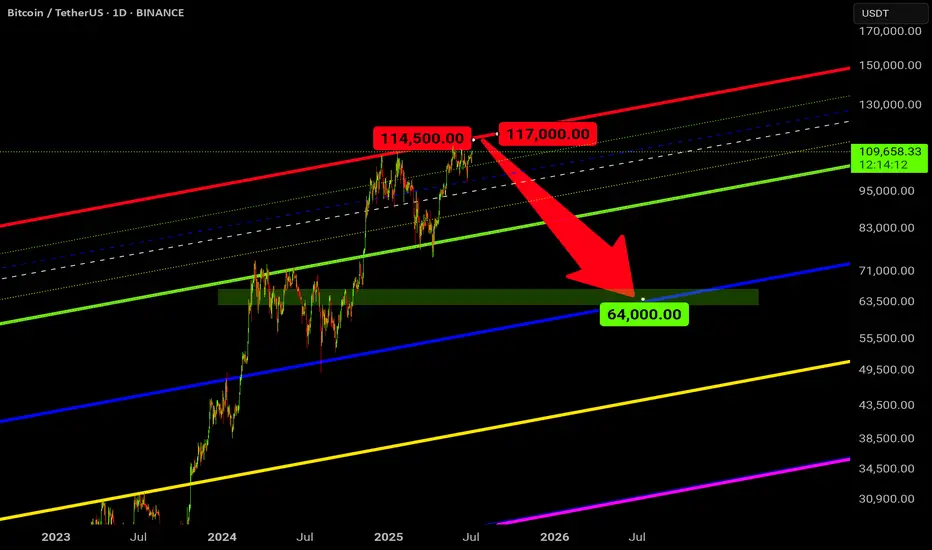
BTC Sell ShortThis is how I see Bitcoin in a year's time : the beginning of a bear market and the end of a bull market .
We hit. We failed. Now we drop.OANDA:GBPAUD
Inside this price channel, the market is forming a flag in an attempt to break out.
But given the market cycle and three failed breakout attempts,
I believe it's time for sellers to take control.
📉 I’m siding with the bears on this one!

SHORT ON BITCOINBITCOIN has continue to create lower highs at a major resistance zone.
I will be selling bitcoin looking to make over 8000 to 20,000 points.

SHORT ON EUR/USDEUR/USD has a rising wedge within a consolidation zone.
The dollar looks like it will rise which will cause this pair to fall.
I will be selling EU looking to catch 150-300 pips this week.

AUDJPY WEEKLY HIGHER TIME FRAME FORECAST Q3 W27 Y25AUDJPY WEEKLY HIGHER TIME FRAME FORECAST Q3 W27 Y25
Professional Risk Managers👋
Welcome back to another FRGNT chart update📈
Diving into some Forex setups using predominantly higher time frame order blocks alongside confirmation breaks of structure.
Let’s see what price action is telling us today! 👀
💡Here are some trade confluences📝
✅Weekly 50EMA Rejection
✅Daily Order block identified
✅1H Order Block identified
🔑 Remember, to participate in trading comes always with a degree of risk, therefore as professional risk managers it remains vital that we stick to our risk management plan as well as our trading strategies.
📈The rest, we leave to the balance of probabilities.
💡Fail to plan. Plan to fail.
🏆It has always been that simple.
❤️Good luck with your trading journey, I shall see you at the very top.
🎯Trade consistent, FRGNT X

stable tariffs, gold price impact reduction✍️ NOVA hello everyone, Let's comment on gold price next week from 06/30/2025 - 07/04/2025
⭐️GOLDEN INFORMATION:
Gold prices plunged over 1.5% on Friday as risk appetite strengthened, fueled by a combination of positive geopolitical and economic developments. Easing tensions between Israel and Iran, the formal trade agreement between the United States and China, and continued efforts by Washington to strike new commercial deals with global partners lifted market sentiment—dampening demand for safe-haven assets like bullion.
At the time of writing, XAU/USD is trading at $3,274, having pulled back from an earlier high of $3,328. On Thursday, the White House confirmed the signing of a long-awaited trade pact with China, marking an official end to the protracted trade war. US Commerce Secretary Howard Lutnick also indicated that additional agreements may be finalized ahead of the July 9 deadline
⭐️Personal comments NOVA:
Information on tariff negotiations is gradually becoming stable and favorable. Information on inflation showing signs of increasing, dxy increase is also a temporary pressure causing gold price to return to the 3200 mark.
🔥 Technically:
Based on the resistance and support areas of the gold price according to the H4 frame, NOVA identifies the important key areas as follows:
Resistance: $3307, $3348, $3390
Support: $3248, $3202
🔥 NOTE:
Note: Nova wishes traders to manage their capital well
- take the number of lots that match your capital
- Takeprofit equal to 4-6% of capital account
- Stoplose equal to 2-3% of capital account
- The winner is the one who sticks with the market the longest

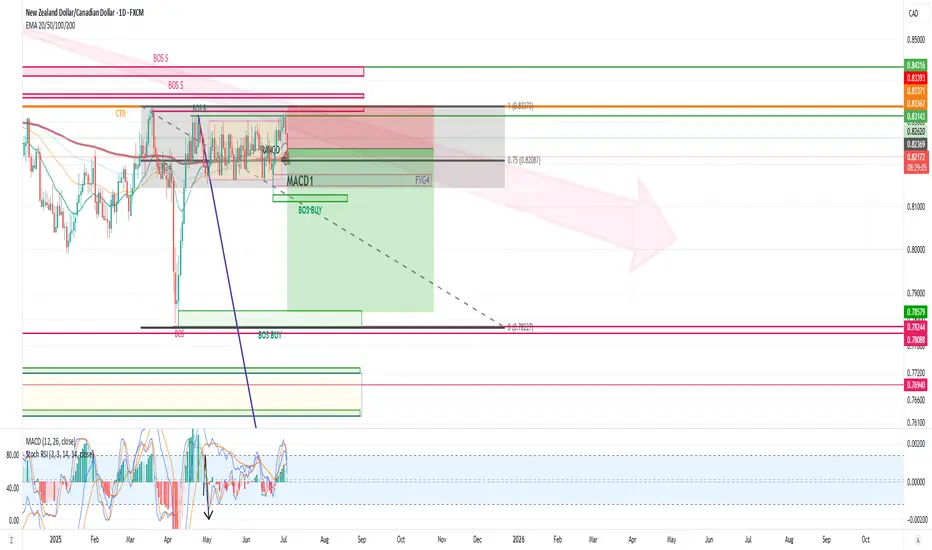
SHORT ON NZD/CADNzd/cad has given us a double top with a confirmed change of character (choc)
to the downside.
I am waiting for price to reach into supply sweeping liquidity before taking a sell to the next demand level looking to catch 100-150 pips.

Strong weekend selling pressure, below 3300⭐️GOLDEN INFORMATION:
Gold prices (XAU/USD) came under renewed selling pressure during the Asian session on Friday, retreating below the $3,300 level after a lackluster performance the previous day. The precious metal is edging closer to the two-week low seen on Tuesday, as investors await the release of the US Personal Consumption Expenditures (PCE) Price Index. This key inflation gauge is expected to offer fresh insight into the Federal Reserve’s policy outlook and could significantly influence US Dollar (USD) movements—ultimately shaping the near-term trajectory of the non-yielding yellow metal.
⭐️Personal comments NOVA:
Selling pressure at the end of the week caused gold prices to fall below 3300, maintaining selling pressure and falling today
⭐️SET UP GOLD PRICE:
🔥SELL GOLD zone: 3326- 3328 SL 3333
TP1: $3315
TP2: $3302
TP3: $3290
🔥BUY GOLD zone: $3248-$3250 SL $3243
TP1: $3260
TP2: $3270
TP3: $3280
⭐️Technical analysis:
Based on technical indicators EMA 34, EMA89 and support resistance areas to set up a reasonable SELL order.
⭐️NOTE:
Note: Nova wishes traders to manage their capital well
- take the number of lots that match your capital
- Takeprofit equal to 4-6% of capital account
- Stoplose equal to 2-3% of capital account

SHOT ON GBP/CADGBP/CAD has given nice rejection from a major supply area.
There is lots of imbalance to the downside.
I will be selling GBP/CAD looking to catch 100-200 pips to the next demand zone.

SHORT ON GBP/JPYGJ has given us a CHOC (change of character) on the Lower timeframes breaking a strong low.
I will be selling GJ to the next demand level basically catching the pullback to its overall UPTREND.
looking to catch 200-300 pips this week.

BTC, Selling pressure below 100K, 23 JunePlan BTC today: 23 June 2025
Related Information:!!!
Market capitalisation fell to $3.03 trillion over the weekend, likely due to speculators expecting a sell-off in response to US strikes on targets in Iran. However, the limited reaction from traditional financial markets brought buyers back to the crypto space, showing their willingness to buy at a discount and pushing market capitalisation back up to $3.12 trillion.
The cryptocurrency sentiment index dropped to 42 on Sunday, its lowest level in two months, but rebounded to 47 at the start of the new week, moving from the fear zone into neutral territory.
Bitcoin slipped to $98K over the weekend, briefly touching the classic support level at 61.8% of the April–May rally. However, by the start of the European trading session, it had already recovered to around $102K, compared to $102.7K at the beginning of Sunday. Still, last week’s sell-off broke the 50-day moving average support, weighed down by external factors. A breakout from the $96K–$105K range will likely determine the direction of the next major move
personal opinion:!!!
Selling pressure caused gold price to drop below 100k yesterday, macro economy has not changed much. Gold price continues to suffer selling pressure
Important price zone to consider :!!!
support zone : 100.800 ; 98.200
Sustainable trading to beat the market

SHORT ON EUR/GPBWe have a rising channel (bearish reversal chart pattern) at a major level of resistance (confluence)
Price has given us a breakout of the channel to the downside and is currently respecting resistance.
I will be selling EUR/GBP to the next support level looking to catch over 120 pips.

Gold prices continue temporary downtrend⭐️GOLDEN INFORMATION:
Gold prices (XAU/USD) came under renewed selling pressure during Friday’s Asian session, dipping to their lowest level in over a week, near the $3,344–$3,345 range. The decline was largely driven by the Federal Reserve’s hawkish tone, which emphasized persistent inflation risks and suggested a more gradual path to interest rate cuts—dampening demand for the non-yielding precious metal. Nevertheless, fragile market sentiment and a cautious risk environment may continue to lend some support to gold, potentially cushioning it against steeper declines.
⭐️Personal comments NOVA:
Selling pressure continues to maintain, pushing gold price down to 3304 today, the downtrend price line is maintaining well.
⭐️SET UP GOLD PRICE:
🔥SELL GOLD zone: 3418- 3420 SL 3425
TP1: $3400
TP2: $3382
TP3: $3370
🔥BUY GOLD zone: $3306-$3304 SL $3299
TP1: $3315
TP2: $3328
TP3: $3340
⭐️Technical analysis:
Based on technical indicators EMA 34, EMA89 and support resistance areas to set up a reasonable SELL order.
⭐️NOTE:
Note: Nova wishes traders to manage their capital well
- take the number of lots that match your capital
- Takeprofit equal to 4-6% of capital account
- Stoplose equal to 2-3% of capital account

Bears under strong pressure, gold price adjusted⭐️GOLDEN INFORMATION:
Gold prices (XAU/USD) saw a modest rebound during Thursday’s Asian session, recovering part of the prior day’s decline and stabilizing around the $3,362–$3,363 zone, marking the weekly low. Lingering trade uncertainties and escalating geopolitical tensions in the Middle East continue to weigh on global risk sentiment, supporting demand for the safe-haven metal.
Meanwhile, the U.S. Federal Reserve concluded its two-day policy meeting on Wednesday by holding interest rates steady, while signaling a more cautious approach to future rate cuts. This shift, driven in part by concerns that President Donald Trump’s tariff policies could fuel inflation, boosted the U.S. Dollar to its highest level in over a week. The resulting Dollar strength is capping gold’s upside momentum, keeping the metal below the $3,400 threshold and prompting investors to remain cautious.
⭐️Personal comments NOVA:
Bears continue to put selling pressure on gold prices. Accumulating below 3400.
⭐️SET UP GOLD PRICE:
🔥SELL GOLD zone: 3414- 3416 SL 3421
TP1: $3402
TP2: $3390
TP3: $3376
🔥BUY GOLD zone: $3347-$3345 SL $3340
TP1: $3355
TP2: $3368
TP3: $3380
⭐️Technical analysis:
Based on technical indicators EMA 34, EMA89 and support resistance areas to set up a reasonable BUY order.
⭐️NOTE:
Note: Nova wishes traders to manage their capital well
- take the number of lots that match your capital
- Takeprofit equal to 4-6% of capital account
- Stoplose equal to 2-3% of capital account

SHORT ON USD/CADUSD/CAD has given a confirmation choc (change of character) from up to down on the lower timeframe (5min) from a MAJOR supply area.
I will be selling USD/CAD looking to make over 100 pips to the next demand level.

GBPJPY LONG & SHORT FORECAST Q2 W25 D19 Y25GBPJPY LONG & SHORT FORECAST Q2 W25 D19 Y25
Professional Risk Managers👋
Welcome back to another FRGNT chart update📈
Diving into some Forex setups using predominantly higher time frame order blocks alongside confirmation breaks of structure.
Let’s see what price action is telling us today!
💡Here are some trade confluences📝
✅Daily order block
✅15' order block
✅Intraday breaks of structure
✅4H Order block
🔑 Remember, to participate in trading comes always with a degree of risk, therefore as professional risk managers it remains vital that we stick to our risk management plan as well as our trading strategies.
📈The rest, we leave to the balance of probabilities.
💡Fail to plan. Plan to fail.
🏆It has always been that simple.
❤️Good luck with your trading journey, I shall see you at the very top.
🎯Trade consistent, FRGNT X

SHORT ON AUD/JPYAUD/JPY has given us a choc (change of character) from up to down at a major resistance zone.
I will be selling AUD/JPY to the next demand level looking to catch 100-200 pips

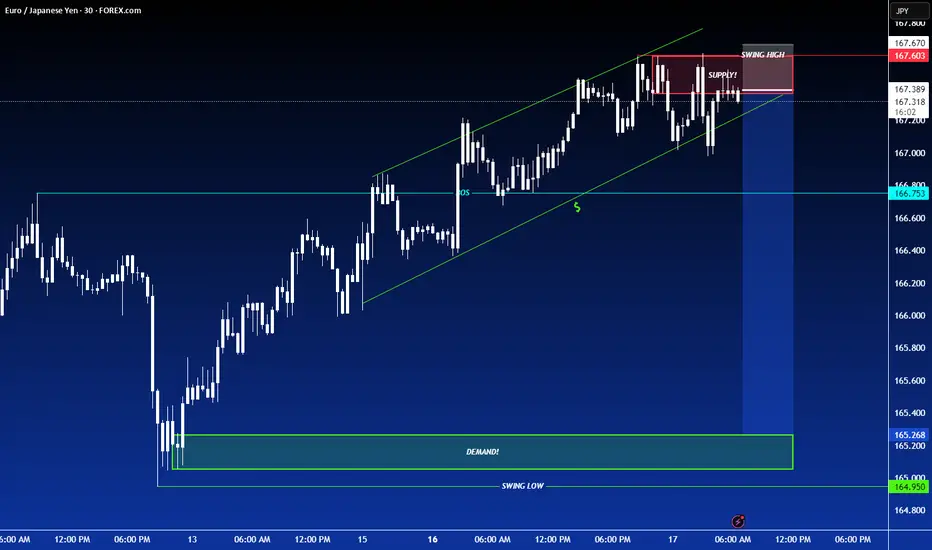
SHORT ON EUR/JPYEJ has created a (Rising Channel) with a (Double Top) at a major resistance zone.
Both Chart Patterns are Bearish Reversal Patterns.
I will be Selling EJ to the next demand level as it seeks out liquidity to the downside for 100-200 pips.
GBPUSD consolidates resistance zone and declinesPlan GBPUSD day: 16 June 2025
Related Information: !!!
The Pound Sterling (GBP) ticks up to near 1.3590 against the US Dollar (USD) so far on Monday, remaining inside Friday’s trading range. The GBP/USD pair is expected to keep trading within a tight range as investors have sidelined ahead of monetary policy announcements by the Federal Reserve (Fed) and the Bank of England (BoE), due on Wednesday and Thursday, respectively.
At the start of the week, the US Dollar Index (DXY), which tracks the Greenback’s value against six major currencies, edges down to near 98.00.
Investors will closely monitor the interest rate guidance from both central banks, while they are expected to leave those unchanged at their current levels
personal opinion:!!!
At the beginning of the week, there was not much important news. GBPUSD price was sideways and reacted to resistance and support zones.
Important price zone to consider :
SELL point: zone 1.35950
Sustainable trading to beat the market

SHOT ON EUR/USDEUR/USD Has given us a nice double top at a major resistance level.
Since then it has broken the neckline of that double bottom, creating a new low, engineering liquidity, sweeping it and now getting ready to tap into supply before it should fall.
The Dxy is also getting ready to rise from a demand level so this should also aid in pushing EU down.
Looking to catch over 200 pips.

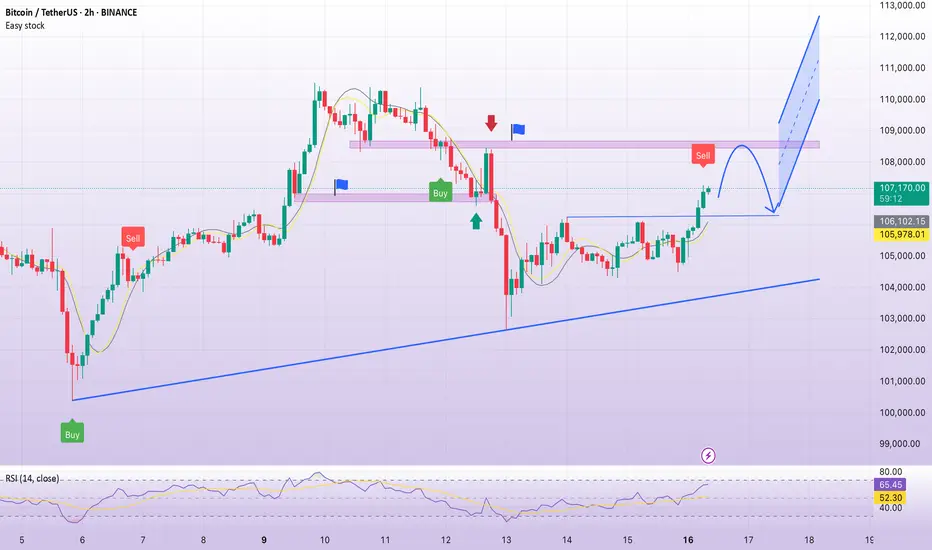
BTC accumulates, back to 108,500Plan BTC today: 16 June 2025
Related Information:
The price of gold is nearing its all-time high as tensions in the Middle East escalate, but analysts say they’re doubtful Bitcoin will do the same as investors prioritize other safe-haven assets.
The price of gold rose to $3,450 per ounce on Monday, just $50 shy of its all-time high of just below $3,500 in April, according to TradingView.
The usually slow-to-move asset has gained a whopping 30% since the beginning of the year, catalyzed by US President Donald Trump’s trade tariffs and, more recently, an escalation of military action in the Middle East following an Israeli missile strike on Iran on June 13, which caused Bitcoin prices to fall.
Gold prices have also been linked with inflationary pressures, as it is considered a safe haven and an inflation hedge by investors.
personal opinion:
The crypto market recovered at the beginning of the week after being affected by war news. It will almost certainly continue to maintain the 4.5% interest rate, so it will be difficult to break ATH this week.
Important price zone to consider :
Sell point: zone 108.400 - 108.600 SL : 109.100
Take profit : 107.900 - 107.000 - 106.000
Sustainable trading to beat the market
AUDJPY SHORT FORECAST Q2 W24 D13 Y25AUDJPY SHORT FORECAST Q2 W24 D13 Y25
Professional Risk Managers👋
Welcome back to another FRGNT chart update📈
Diving into some Forex setups using predominantly higher time frame order blocks alongside confirmation breaks of structure.
Let’s see what price action is telling us today! 👀
💡Here are some trade confluences📝
✅Weekly Order block rejection
✅15' Order block
✅1H 50EMA
✅Daily order block identified
🔑 Remember, to participate in trading comes always with a degree of risk, therefore as professional risk managers it remains vital that we stick to our risk management plan as well as our trading strategies.
📈The rest, we leave to the balance of probabilities.
💡Fail to plan. Plan to fail.
🏆It has always been that simple.
❤️Good luck with your trading journey, I shall see you at the very top.
🎯Trade consistent, FRGNT X
