AUDCAD Potential sells - 8 Jan. 2024Hey peeps,
Looking for potential sells off this 1hr zone.
We first identified our current range on the 4hr. I moved 1 timeframe lower and from the picture above on the 1hr, the counter trend towards our POI is very clear.
Once price swept the counter trend high on the 1hr within that 4hr IPA, and left an IPA we draw our fib and take it off the 78.6 zone.
Hope this helps you on your journey and follow for more!
Sellsetup

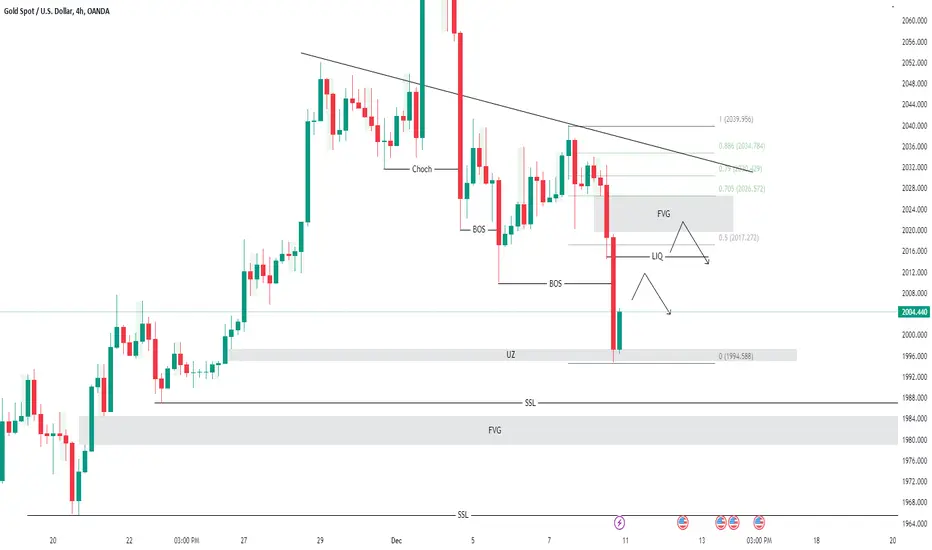
NFP XAUUSD 100% CONFIRM ANALYSIS
In anticipation of today's Non-Farm Payroll (NFP) trade news, I am strategically eyeing a selling opportunity within the range of 2054-2056, with an extreme level target set at 2062-2066. The chart analysis is remarkably clear, presenting a compelling opportunity. Despite the inherent risks, the clarity in the charts motivates me to engage in this clash during the NFP release.

DOWN adjustment rhythm for UP wave⭐️ Smart investment, Strong finance
⭐️ GOLDEN INFORMATION:
Thursday saw an increase in Initial Jobless Claims in the United States, reaching 218,000 for the week ending December 23. This exceeded the market's prediction of 210,000. Continuing Claims also rose to 1.875 million, marking the highest level in four weeks. Additionally, November's Pending Home Sales remained unchanged, failing to meet the market's expectation of a 1% increase.
Looking ahead, gold traders will be closely monitoring the release of the Chicago Purchasing Managers' Index for December on Friday. However, given that traders are entering holiday mode as they approach 2024, this data may not prompt immediate action.
⭐️ Personal comments NOVA:
After the price reached the 2090 area, it reached a new peak in the last 3 weeks. Prices have been adjusted DOWN to create more liquidity for the market
⭐️ SET UP GOLD PRICE:
🔥BUY GOLD zone: $2053 - $2055 SL $2045
TP1: $2062
TP2: $2075
TP3: $2090
🔥BUY GOLD zone: $2032 - $2034 SL $2025
TP1: $2042
TP2: $2050
TP3: $2062
Note two more Scalping support zones: 2057 - 2059 and 2046-2047
⭐️ Technical analysis:
Based on technical indicators EMA 34, EMA89 and support resistance areas to set up a reasonable SELL order.
⭐️ NOTE:
Note: Nova wishes traders to manage their capital well
- take the number of lots that match your capital
- Takeprofit equal to 4-6% of capital account
- Stoplose equal to 2-3% of capital account
- The winner is the one who sticks with the market the longest

SCALPING !! 12/28/23 test the corrective wave rhythm⭐️ Smart investment, Strong finance
⭐️ GOLDEN INFORMATION:
The price of gold (XAU/USD) experienced slight downward pressure on Thursday following its recent three-week high. The valuable metal gave up some of its gains as investors took profits after a significant rally over the past two weeks. This occurred as the cost of holding the non-interest-bearing metal increased due to the recovery of US Treasury yields.
⭐️ Personal comments NOVA:
Based on today's correction, test the price trend at 2085 and signal SELL
⭐️ SET UP GOLD PRICE:
🔥SELL GOLD zone: $2085 - $2087 SL $2090 Scalping
TP1: $2080
TP2: $2075
TP3: $2070
⭐️ Technical analysis:
Based on technical indicators EMA 34, EMA89 and support resistance areas to set up a reasonable SELL order.
⭐️ NOTE:
Note: Nova wishes traders to manage their capital well
- take the number of lots that match your capital
- Takeprofit equal to 4-6% of capital account
- Stoplose equal to 2-3% of capital account
- The winner is the one who sticks with the market the longest

GBPUSD WEEKLY ANALYSIS SELL OPPORTUNITY Complement of the season to you all. I guess this will be my last analysis for this year, i believe this year was a wonderful year to many traders, if this year was not good for you i want you to put a smile on your face because i gate something nice for you on GBPUSD going to next year. The chart 📉 before you is GBPUSD WEEKLY chart you will clearly see that wave 1 and 2 is formed already waiting for the wave 2 complete then start the wave 3. The wave 3 is the longest and the sweet wave to make easy money 🤑🤑 so I want you to put this pair on your watch list and let make money together next year. Happy new in Advance 🎄🎇🎇🎇🤗

Bearish NAS100Price already swept out weekly highs before creating an SMT reversal with displacement. Currently market retraced to the bearish OB filling up the SIBI. It's most likely market will trade on the sell curve of the MMXM.

Short on GBPAUDGBPAUD has broken the trendline and it may fall further, we will wait for the retest before taking a sell trade

Audusd looking for sell reached resistance and supplyHI. Although the trend is upward, I am looking for sell because the price has reached resistance and supply.
the entry will be taken only if all rules of the strategies will be satisfied. I suggest you keep this pair on your watchlist and see if the rules of your strategy are satisfied.
Traders, if you liked this idea or if you have your own opinion about it, write in the comments. I will be glad
** Please LIKE 👍, FOLLOW ✅, SHARE 🙌 and COMMENT ✍ if you enjoy this idea! Also share your ideas and charts in the comments section below! *

EURUSD ,. Looking Attractive Hello Guys . On EURUSD we Have a Good Day Trading Selling Opportunity, Which the Market Have Been Trending Up and Finally Switch to The Downside Plus The Support of The Higher Time Frame Reacting From a Strong Supply Area On The Higher Time frames and am Expecting a Pullback to One of The Supply Zone and Continue The Sell to The Down side.
Drop your Opinion on The Comments Section ..Thanks

Europe 50 pullback expectedThe market is very overbought. Pullback is a matter of time.
As Christmas holiday is coming not sure if it happens in Dec or beginning of Jan.
4330 previously was a strong resistance so I’m expecting this it become strong support durrring market correction.

GBP/NZD ! 11/12 SELL NOW at the beginning of the week⭐️ Smart investment, Strong finance
⭐️ Personal comments NOVA:
Monday, set up a SELL signal right at the nearest resistance zone, no important economic data today
⭐️ SET UP GBPNZD PRICE:
🔥SELL zone: 2.05200 - 2.05350 SL 2.05800
TP1: 2.05000
TP2: 2.04700
TP3: 2.04300
⭐️ Technical analysis:
Based on technical indicators EMA 34, EMA89 and support resistance areas to set up a reasonable SELL order.
⭐️ NOTE:
Note: Nova wishes traders to manage their capital well
- take the number of lots that match your capital
- Takeprofit equal to 4-6% of capital account
- Stoplose equal to 2-3% of capital account
- The winner is the one who sticks with the market the longest

RAREUSDTRAREUSDT is in strong bearish trend and also form bearish flag pattern. Recently the instrument has break through important support zone.
Now the price is trading within the bearish flag and seems like it getting ready to break it.
Will the sellers took benefits from these bearish confluences?

GOLD H4 Road-map BearishGold Market Structure Shifts to Bearish on two Major Time frames H4 and D1.
Be-careful Retailers, always trade with proper Risk management and Stop loss.
Happy trading
NZD/CHF! 6/12 Any opportunity to give DOWN prices?⭐️ Smart investment, Strong finance
⭐️ Personal comments NOVA:
The price continues to circle around the nearest resistance zone, today there is no news that will have too much impact. The price cannot break through this zone yet, NOVA will give a SELL signal here
⭐️ SET UP NZD/CHF PRICE:
🔥SELL zone: 0.54000 - 0.54150 SL 0.54600
TP1: 0.53700
TP2: 0.53400
TP3: 0.53000
⭐️ Technical analysis:
Based on technical indicators EMA 34, EMA89 and support resistance areas to set up a reasonable SELL order.
⭐️ NOTE:
Note: Nova wishes traders to manage their capital well
- take the number of lots that match your capital
- Takeprofit equal to 4-6% of capital account
- Stoplose equal to 2-3% of capital account
- The winner is the one who sticks with the market the longest

EUR/ USD!! 5/12/2023 supporting the DOWN trend⭐️ Smart investment, Strong finance
⭐️ EUR/USD INFORMATION:
The US Census Bureau released data on Monday revealing a 3.6% month-on-month decrease in US factory orders in October, following a 2.3% increase in the previous report. In addition, the Institute for Supply Management (ISM) reported that the US ISM Manufacturing PMI remained unchanged at 46.7 in November, falling short of expectations.
According to Federal Reserve (Fed) Chair Jerome Powell, the US monetary policy has been successful in slowing down the economy, as predicted, with the overnight interest rate now in restrictive territory. Although Powell emphasized the Fed's readiness to further tighten policy if necessary, market sentiment suggests that the rate-hike cycle has reached its conclusion. Consequently, this has put downward pressure on the US dollar across all markets.
⭐️ Personal comments NOVA:
The price area touches the downtrend line, Scalping during the day is a SELL signal
⭐️ SET UP EURUSD PRICE:
🔥SELL EUR/USD zone: 1.08500 - 1.08650 SL 1.09100
TP1: 1.08000
TP2: 1.07700
TP3: 1.07400
⭐️ Technical analysis:
Based on technical indicators EMA 34, EMA89 and support resistance areas to set up a reasonable SELL order.
⭐️ NOTE:
Note: Nova wishes traders to manage their capital well
- take the number of lots that match your capital
- Takeprofit equal to 4-6% of capital account
- Stoplose equal to 2-3% of capital account
- The winner is the one who sticks with the market the longest

EURAUD shortWe can expect a pullback on Monday into zone 0.62 fib retracement and then bearish continuation.

#XAUUSD #Gold UpdateIn the time of 15 minutes, it has corrected a complete cycle, and now a three-wave can move up to the red area, and then it can continue to correct until the green area.

#NZDUSDIn the daily time, it is moving in a descending channel, which is currently at the ceiling of the channel, and it has formed a divergence in MACD, which has also formed a corner pattern that can create a pullback to the neckline and then continue to the specified area. It has to continue its growth and get out of the downward channel.

GBPUSDIs GBPUSD exhausting at highs?
As the price is been on high bull run but now it seems like price is lacking bullish momentum after printing double top pattern at resistance level and bearish divergence( on lower time frame) suggesting the sell pressure is about to start.
If the bears took control , the 1st target could be 1.2300 followed by 1.2100
What you guys think of it?


EURCHFIs EURCHF exhausting at highs?
As the price is been on high bull run but now it seems like price is lacking bullish momentum after printing double top pattern at resistance level and bearish divergence suggesting the sell pressure is about to start.
If the bears took control , the 1st target could be 0.9560 followed by 0.9500.
What you guys think of it?

EURAUD AT SUPPLY..... WHAT'S NEXT?If we understand the concept of supply and demand, then making trading decisions won't be so hard for us. trading is simple plus and minus. all you need is to identify a good supply{resistance} and then plan a sell trade from it. and or identify a good demand{support} and plan a buy trade from there.
Supply and Demand are no different from support and resistance, they are simply an area and not a line.... they are the zones that makes things happen. price moves impulsively to the opposite direction once it approaches these areas.
so with that in mind, I am looking to short EURAUD. as price just retested a supply zone and rejected for a second time. creating a double top like structure. Meanwhile, price had just broken out from a recent uptrend here in this 4hr chart. closing below a recent low... now I expect a pullback to the 1.67800 price area for a nice entry and a tighter stop loss.
it may or may not pullback that much, but it is only right that it does. GOODLUCK GUYS!!!

NAS100. Will the Harmonics play its role ?Is NAS100 exhausting at strong resistance level?
As the price is been on high bull run but now it seems like price is lacking bullish momentum after reaching at resistance level and bearish divergence suggesting the sell pressure is about to start.
If the bears took control , the 1st target could be 0.5660 followed by 0.5610.
What you guys think of it
