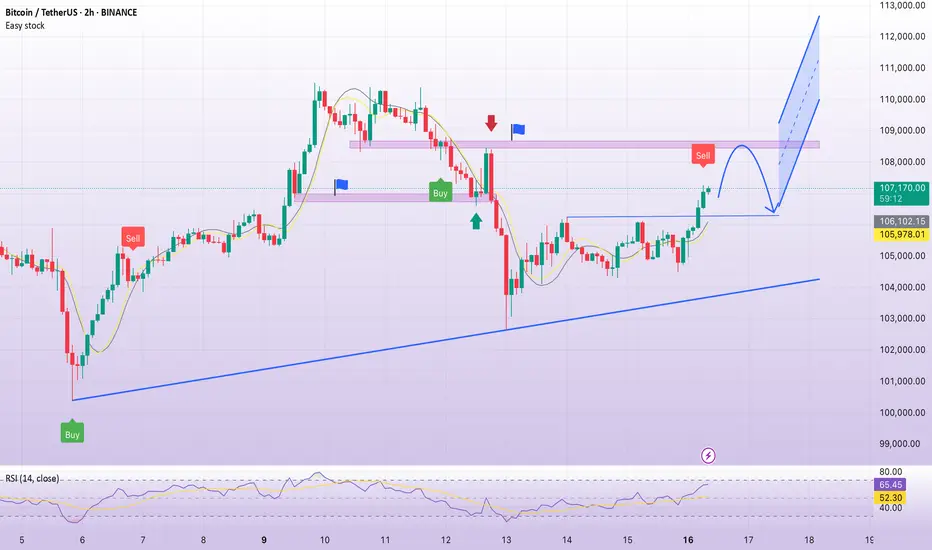
BTC accumulates, back to 108,500Plan BTC today: 16 June 2025
Related Information:
The price of gold is nearing its all-time high as tensions in the Middle East escalate, but analysts say they’re doubtful Bitcoin will do the same as investors prioritize other safe-haven assets.
The price of gold rose to $3,450 per ounce on Monday, just $50 shy of its all-time high of just below $3,500 in April, according to TradingView.
The usually slow-to-move asset has gained a whopping 30% since the beginning of the year, catalyzed by US President Donald Trump’s trade tariffs and, more recently, an escalation of military action in the Middle East following an Israeli missile strike on Iran on June 13, which caused Bitcoin prices to fall.
Gold prices have also been linked with inflationary pressures, as it is considered a safe haven and an inflation hedge by investors.
personal opinion:
The crypto market recovered at the beginning of the week after being affected by war news. It will almost certainly continue to maintain the 4.5% interest rate, so it will be difficult to break ATH this week.
Important price zone to consider :
Sell point: zone 108.400 - 108.600 SL : 109.100
Take profit : 107.900 - 107.000 - 106.000
Sustainable trading to beat the market
Sellsetup
AUDJPY SHORT FORECAST Q2 W24 D13 Y25AUDJPY SHORT FORECAST Q2 W24 D13 Y25
Professional Risk Managers👋
Welcome back to another FRGNT chart update📈
Diving into some Forex setups using predominantly higher time frame order blocks alongside confirmation breaks of structure.
Let’s see what price action is telling us today! 👀
💡Here are some trade confluences📝
✅Weekly Order block rejection
✅15' Order block
✅1H 50EMA
✅Daily order block identified
🔑 Remember, to participate in trading comes always with a degree of risk, therefore as professional risk managers it remains vital that we stick to our risk management plan as well as our trading strategies.
📈The rest, we leave to the balance of probabilities.
💡Fail to plan. Plan to fail.
🏆It has always been that simple.
❤️Good luck with your trading journey, I shall see you at the very top.
🎯Trade consistent, FRGNT X

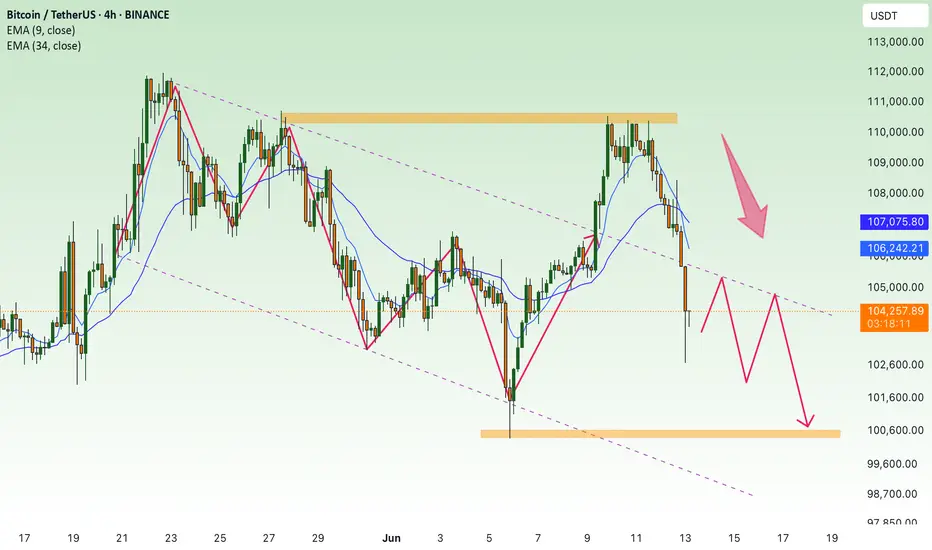
BTC Short-term selling pressure due to war news💎 BTC PLAN UPDATE (June 13)
NOTABLE NEWS ABOUT BTC:
Prices of Bitcoin (BTC), Ethereum (ETH), and Ripple (XRP) slipped as rising geopolitical tensions between Israel and Iran sparked a wave of risk aversion across crypto markets. As uncertainty deepens, the three largest cryptocurrencies by market capitalization are on track to close the week in the red, with current price action signaling the potential for a deeper correction.
Bitcoin bears regain control
After failing to reclaim its all-time high of $111,980 earlier in the week, Bitcoin lost upward momentum and began a steady pullback, slipping below key support at $106,406 on Thursday. As of Friday, BTC continues its downward trajectory, hovering near the 50-day Exponential Moving Average (EMA) at $102,447.
TECHNICAL ANALYSIS PERSPECTIVE:
We successfully identified the peak at the 110K resistance level. As predicted, BTC dropped $7,000 following disappointing CPI and PPI reports. Currently, the price has fallen back into a descending channel pattern and is expected to decline further.
Bitcoin’s upward trend is under threat as funding rates become more constrained.
Earlier this week, Bitcoin hovered near its all-time high of $111,980, but market sentiment remained alarmingly cautious—likely due to uncertainty in the macroeconomic environment.
The path of least resistance is gradually shifting downward, especially as the Relative Strength Index (RSI) falls to the midline at 50 from a recent high of 64 on the daily chart. Traders will look for bearish confirmation signals from the Moving Average Convergence Divergence (MACD) indicator—signaled when the blue MACD line crosses below the red signal line.
Watch for long positions around the 100K price area, with a target back to 103K. If the price breaks below the 100K support level, we should avoid holding onto a bullish bias.
At this time, whether you’re a newcomer or experienced trader, it’s advisable to spend time practicing and reinforcing technical analysis knowledge. Explore educational posts on the channel to build a stronger foundation and avoid potential losses.
==> This analysis is for reference only. Wishing all investors successful trades!
SHORT ON EUR/JPYOn the 1 min Timeframe EJ has given us a choc (change of character) to the downside with a nice break and retest to a major supply area.
The JPY index is bullish which should cause EJ to fall.
I will be selling EJ to the next level of demand looking to catch 100-200 pips.

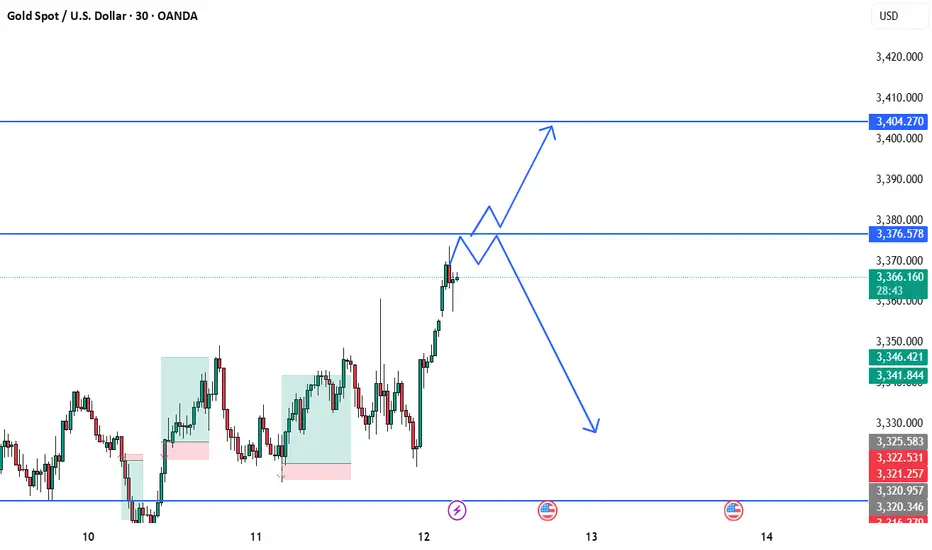
BEST XAUUSD M30 BUY AND SELL SETUP FOR TODAY Gold has shown a strong bullish push, breaking above recent consolidation and approaching a key resistance zone around $3,376. ⚔️ This area will be decisive — if price holds above it and confirms support, we could see a further rally toward $3,404. 📈✨ However, failure to sustain above this level could trigger a bearish rejection, pulling the market back toward the $3,330–$3,340 range. 📉🔄 Traders should wait for clear price action confirmation before entering. React, don’t predict! 🎯🧠
CPI, US inflation, gold price waiting to decrease⭐️GOLDEN INFORMATION:
Gold (XAU/USD) drew fresh bids in Wednesday’s Asian trading, reclaiming the $3,340 level and edging back toward this week’s high. A U.S. federal appeals court decision allowing President Donald Trump’s broad tariffs to remain in force—for now—added a fresh layer of trade uncertainty and stoked safe-haven demand. Heightened geopolitical tensions and growing expectations that the Federal Reserve will cut rates in September further bolstered the non-yielding metal. Even so, optimism surrounding ongoing U.S.–China talks has lifted broader risk sentiment, while a mildly stronger U.S. Dollar is helping keep gold’s upside in check.
⭐️Personal comments NOVA:
Gold price recovered, buying power increased gradually in Asian session, approaching resistance zone 3348
⭐️SET UP GOLD PRICE:
🔥SELL GOLD zone : 3373- 3375 SL 3380
TP1: $3360
TP2: $3350
TP3: $3340
🔥BUY GOLD zone: $3278- $3280 SL $3273
TP1: $3290
TP2: $3300
TP3: $3314
⭐️Technical analysis:
Based on technical indicators EMA 34, EMA89 and support resistance areas to set up a reasonable sell order.
⭐️NOTE:
Note: Nova wishes traders to manage their capital well
- take the number of lots that match your capital
- Takeprofit equal to 4-6% of capital account
- Stoplose equal to 2-3% of capital account

Selling pressure, bears active⭐️GOLDEN INFORMATION:
Gold prices (XAU/USD) edge higher toward $3,325 during the early Asian session on Tuesday, supported by a softer US Dollar as markets turn cautious ahead of key developments in US-China trade negotiations.
Delegations from the United States and China are set to continue discussions for a second consecutive day in London. President Donald Trump expressed optimism, stating the talks “should go very well.” According to US officials, discussions may lead to Washington lifting certain tech export restrictions in exchange for Beijing easing controls on rare earth exports — materials vital to sectors ranging from energy and defense to advanced technology. The outcome of these negotiations could provide fresh direction for the precious metal.
⭐️Personal comments NOVA:
The market is mainly sideways and accumulating, under selling pressure below 3300 due to the US-China trade negotiations taking place today.
⭐️SET UP GOLD PRICE:
🔥SELL GOLD zone : 3350- 3352 SL 3357
TP1: $3340
TP2: $3330
TP3: $3320
🔥BUY GOLD zone: $3276- $3274 SL $3269
TP1: $3285
TP2: $3300
TP3: $3312
⭐️Technical analysis:
Based on technical indicators EMA 34, EMA89 and support resistance areas to set up a reasonable sell order.
⭐️NOTE:
Note: Nova wishes traders to manage their capital well
- take the number of lots that match your capital
- Takeprofit equal to 4-6% of capital account
- Stoplose equal to 2-3% of capital account
SHORT ON NZD/JPYNZD/JPY has given us a CHOC (change or character) to the downside breaking a previous low.
I will be looking for NZD/JPY to retouch the supply area before dropping.
Aiming for 100-200 pips easy!

BTC Returns to Highest ATH💎 Update Plan BTC (June 10)
BlackRock’s spot Bitcoin ETF has made history, becoming the fastest-growing exchange-traded fund (ETF) ever by surpassing $70 billion in assets under management (AUM).
The iShares Bitcoin Trust (IBIT), launched in January 2024, has achieved this milestone in record time, reflecting surging demand for Bitcoin exposure through regulated, mainstream investment vehicles. IBIT’s exceptional growth trajectory has outpaced all previous ETFs, eclipsing even established funds like the SPDR Gold Shares (GLD) in terms of asset accumulation speed.
The ETF recently returned to net inflows — posting a $274 million single-day increase — following a brief period of outflows during a broader market pullback. This rebound signals renewed investor confidence, with capital flowing in from both institutional players and retail investors alike, underscoring Bitcoin’s growing role in diversified portfolios.
Technical analysis angle
Congratulations to investors when the Plan transaction has detected the bottom of 100k and is currently the highest at 110.5k. It is a prosperous signal for investors who are holding this power currency
Another good news is that the organizers have breaked out of the decrease price channel to confirm the trend of increasing and confidence in the price increase continues to be enhanced by the Buyer.
Currently, the BTC price area is slowed by the resistance level with Fibo 0.786 around the 110k price area. We expect the adjustment of the investors to collect goods before the price area goes further around 111.5k even 115k
At this time, whether new or old, should spend more time to practice, load more knowledge about the PTKT, as well as find knowledge posts at the channel ..., to strengthen the solid foundation, as well as avoid losing money at this time offline
==> Comments for trend reference. Wishing investors successfully trading

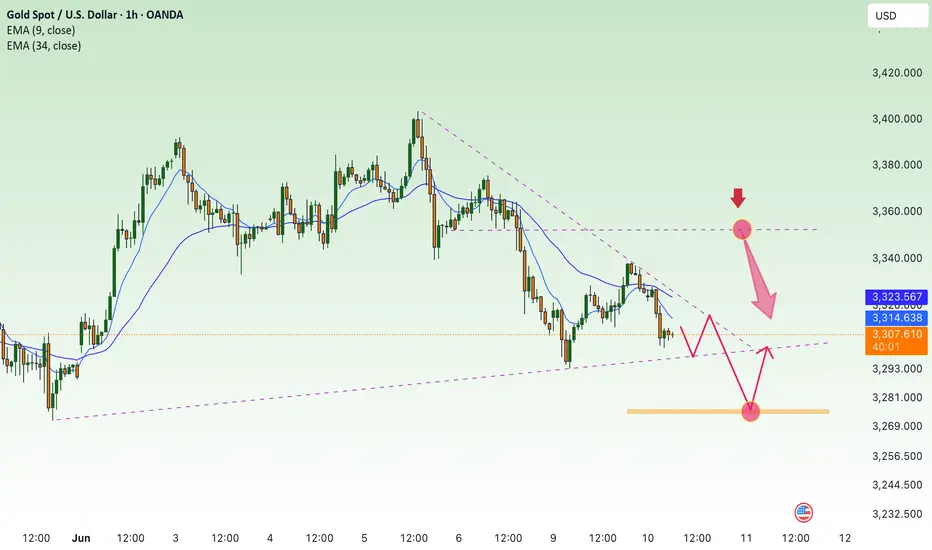
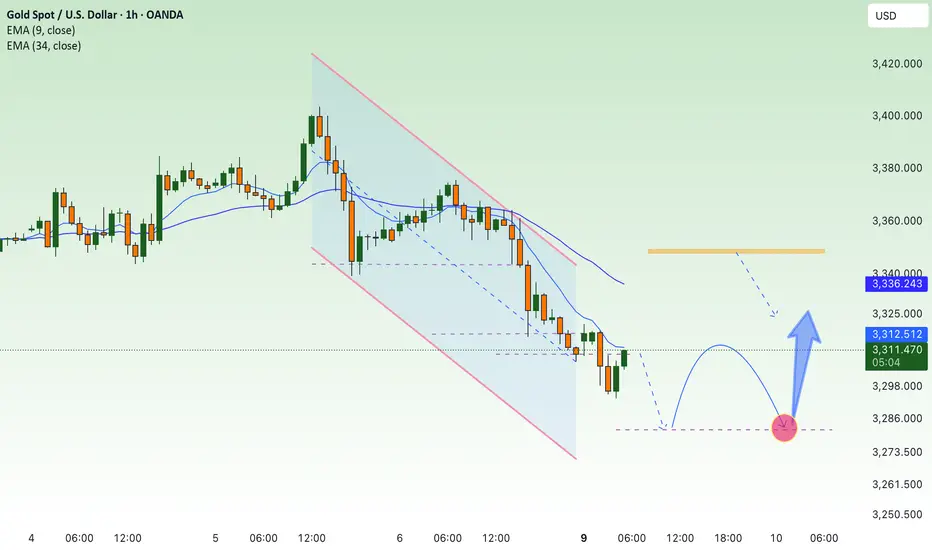
BEST XAUUSD BUY AND SELL SETUP FOR TODAY 📉📊 Gold (XAU/USD) Analysis – Key Levels in Focus! 📈🧐
Gold is currently trading around the 3,326 zone after a recent pullback. Price is approaching the key support level at 3,310, where a potential bullish bounce may occur, targeting the next resistance near 3,350. 🛑 However, if price fails to hold above 3,310, we may see further downside movement towards the 3,293 support. 📉 Traders should watch for reaction and confirmation around these zones before taking entries. ⚠️💡 A bullish reversal could trigger strong buying momentum, while a bearish break may lead to deeper correction. 🎯💰

SHORT ON GBP/USDGBP/USD has just broken a uptrend line and has given us a nice break and retest to that same trendline.
The bearish have shown up and the dollar is currently looking bullish
I will be selling GBP/USD to the next level of demand for 50-80 pips

Gold price recovers, accumulates new week⭐️GOLDEN INFORMATION:
Gold prices (XAU/USD) hold steady near $3,310 during the early Asian trading hours on Monday, with the precious metal struggling to gain traction amid renewed strength in the US Dollar (USD). While a firmer Greenback poses headwinds for gold, lingering uncertainty surrounding President Donald Trump’s tariff strategy continues to offer some support.
On Friday, upbeat labor market data bolstered the dollar, pressuring dollar-denominated assets like gold. The US Bureau of Labor Statistics (BLS) reported that Nonfarm Payrolls rose by 139,000 in May, outpacing expectations of 130,000 and surpassing the previous month's downwardly revised figure of 147,000 (from 177,000). The stronger-than-expected jobs report has dampened hopes of near-term Fed rate cuts, weighing on bullion’s appeal.
⭐️Personal comments NOVA:
Gold price takes liquidity 3294, below 3300 GAP zone last week. Accumulate and react at lower support zones
⭐️SET UP GOLD PRICE:
🔥SELL GOLD zone : 3348- 3350 SL 3355
TP1: $3340
TP2: $3330
TP3: $3320
🔥BUY GOLD zone: $3281- $3279 SL $3274
TP1: $3292
TP2: $3300
TP3: $3315
⭐️Technical analysis:
Based on technical indicators EMA 34, EMA89 and support resistance areas to set up a reasonable sell order.
⭐️NOTE:
Note: Nova wishes traders to manage their capital well
- take the number of lots that match your capital
- Takeprofit equal to 4-6% of capital account
- Stoplose equal to 2-3% of capital account
SHORT ON ETHEREUM ETH/USDEthereum has created a lower high after a triple top and is currently looking very bearish.
Huge imbalance to the downside to be filled.
I will be selling eth to the next demand level looking to catch over 500-600 points.

SHORT ON US30US30 Has given us a change of character to the downside with a nice retest creating a lower high.
I will be selling us30 to the next demand zone looking to catch 500-1000 points.

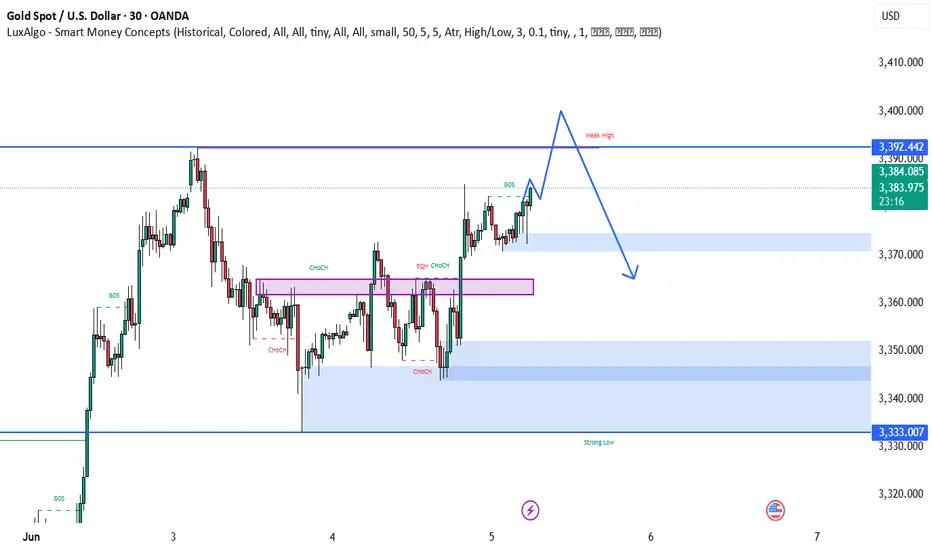
BEST XAUUSD M30 BUY AND SELL SUTUP FOR TODAY📊 Gold is currently showing bullish strength with a break above key structure levels and multiple CHoCH confirmations. Price is approaching a weak high near 3,392, which may act as a liquidity target before potential reversal. 🔄 After sweeping this high, a bearish move could unfold, aiming for the demand zones between 3,350–3,333 where buyers may step back in. 🧠 Traders should prepare for a liquidity grab scenario, with bullish continuation likely invalidated if price closes below the strong demand. ⚠️ Watch price action closely near the weak high and key imbalance zones. 🚀🔁📉
SHORT ON XPT/USD PLATINUMXPT/USD Platinum has given us a choc (change of character) to the downside from a recent push up.
It has currently completed the pullback of that new change to the downside and I expect it to fall from the supply area/zone to the next level of demand.
Lost of imbalance to the downside making this trade a nice setup.

BEST XAUUSD M30 SELL SETUPNFOR TODAY 📉 Gold Analysis Summary – Bearish Setup Alert ⚠️
Gold is currently showing signs of weakness after a strong bullish push. A Change of Character (CHOCH) has confirmed a potential shift in trend. Price is approaching a supply zone (highlighted in purple), and rejection from this level could trigger a downward move. 🔄 The projected path suggests a potential lower high formation, followed by a drop towards the 3,348 and 3,331 key demand levels. 🧠 Watch for bearish confirmation near resistance before entering short positions. 📊💥

Crude oil futures Trade the range In this video I look at the current range that we are in and I have laid out a plan in the scenario that we break that range to the upside and what we could possibly expect .
I have given some reaction zones where I anticipate price to react when we reach there .
I have used Fibonacci, volume profile, and vwap in this video .
Thankyou for your support

SHORT ON EUR/USDEUR/USD has just swept a previous high and has plenty of liquidity to the downside to capture.
I will be selling EU to the next swing low looking to catch 80-100 pips.

BTC short term correction: zone 100k💎 BTC PLAN UPDATE (June 2)
NOTABLE NEWS ABOUT BTC:
Meta shareholders have decisively voted down a proposal to explore adding Bitcoin to the company’s balance sheet, signaling limited appetite for crypto exposure at the tech giant.
According to a regulatory filing dated May 28, the “Bitcoin treasury assessment” proposal garnered just 3.92 million votes in favor — representing a mere 0.08% of total shares — while nearly 5 billion votes against it.
Given that CEO Mark Zuckerberg holds 61% of Meta's voting power, as disclosed in an April filing, it is likely he played a pivotal role in rejecting the measure.
TECHNICAL ANALYSIS PERSPECTIVE
Bitcoin closed below the daily support level of $106,406 on Thursday and fell another 1.50% the following day. However, prices saw a slight recovery over the weekend. As of Monday's writing, BTC is trading below $105,500.
Assuming BTC faces resistance around the $106,406 daily level and continues correcting, it could extend the decline to retest the psychologically important $100,000 mark.
The Relative Strength Index (RSI) on the daily chart is at 53, trending down toward the neutral level of 50, indicating weakening bullish momentum. The Moving Average Convergence Divergence (MACD) also showed a bearish crossover last week. The increasing red histogram bars below the baseline further signal a potential correction ahead.
At this point, whether you are new or experienced, it’s advised to spend more time practicing and enhancing your knowledge of technical analysis. Consider exploring educational posts on the channel (…) to strengthen your foundation and avoid losses during this period.
==> This is a trend-based analysis for reference only. Wishing all investors successful trades!

Tapped In & Tapped Out – Smart Money’s About to Dump AUDUSDAUDUSD has just executed a classic liquidity raid, sweeping a short-term high into a high-probability 1H Order Block (OB) — which also aligns with the continuation move that broke prior structure to the downside.
This OB sits directly above equal highs that served as a clear magnet for buy-side liquidity — a textbook inducement for retail breakout traders. Smart money logic suggests these stops were used to fill sell orders.
Notably, there’s a Fair Value Gap (FVG) resting just below, which increases the probability of a displacement move to the downside. We now expect price to deliver into the Sellside Liquidity (4H) resting beneath the equal lows, a highly attractive draw on liquidity from an institutional perspective.
Key Confluences
✅ 1H OB tapped with precision
✅ Buy-side liquidity swept via equal highs
✅ Clear FVG imbalance below
✅ Sellside liquidity target aligned with equal lows
✅ Weekly bias still leans bearish
This is a high-probability setup when following ICT/SMC principles — refined entry, defined target, clean structure.
🔍 Watch for:
A clean bearish displacement from current levels
Potential lower timeframe confirmations (BOS/CHoCH) for tighter risk entries
📌 Target: 0.64071
🧠 Bias: Bearish
⚠️ As always — DYOR (Do Your Own Research). Institutional concepts work best with context and personal backtesting.

Nasdaq Signals Economic Instability – Are You Watching CloselyDear traders,
You may be witnessing a “first” — a pivotal moment right before things begin to spiral.
We’re not fortune tellers. We don’t claim to predict the future.
But what you’re about to read is based entirely on publicly available data, interpreted not through speculation, but through a deep, rational analysis of interconnected facts — the kind of connections that most overlook, and few dare to question.
We may not know how the future is being orchestrated behind the scenes...
But one thing seems certain: crisis always comes first... and then we are given a narrative to justify it — be it war, a pandemic, or a "global emergency."
This is the correct sequence... and it’s the one they never teach you.
Yet for those of us who navigate the financial markets, one question matters more than all others:
How do we profit from this?
We recently shared an important setup on the Nasdaq index, the benchmark that reflects — to a large extent — the true state of the U.S. economy.
As a proxy for the 100 largest American corporations, the Nasdaq plays a critical role in signaling macro trends.
And while some are just now waking up to the storm ahead, our outlook has been clear since October 2022:
A major economic crisis was not only probable… it was inevitable.
Some analysts chalk this up to uncontrolled money printing post-2019 as governments tried to patch the damage from the COVID-19 crisis. That’s one explanation.
But at Glich, our vision is different.
More complex.
And for now… not something we can fully release.
For years, strong correlations between risk markets — especially U.S. equities and crypto — held firmly in place.
But something changed on May 30th, 2025. Completely and unmistakably.
The link was severed.
Now ask yourself:
Why was Bitcoin created in the first place?
It wasn’t just digital money.
It was a bold, revolutionary idea. A system designed for a future economy no longer shackled by inflation, central banking failures, or hidden agendas.
A fluid, transparent, and secure network for a world in desperate need of change.
The current financial model is obsolete. It’s no longer evolving — just surviving.
And it can no longer answer the challenges of what's to come.
2008 was not the collapse; it was the setup. A convenient pretext to slowly roll out something new.
And "Satoshi Nakamoto"? Well, let’s just say...
That name means more than you think.
"HIDDEN INFORMATION" 👁️
What does NEO mean when he says:
"This has all happened before… yet it’s happening for the first time"?
And what does that have to do with us?
This analysis is not just about charts or setups.
It’s a hidden message — a spotlight on a once-in-a-generation opportunity lying in plain sight.
But not everyone is trained to read between the lines.
Let us ask:
Why was Donald Trump specifically pushed into position?
Why is crypto — after being suppressed, banned and attacked worldwide — now being quietly promoted and fast-tracked in legislation during 2024 and 2025?
Something’s moving beneath the surface.
🔍 In summary:
Expect a tidal wave of global crypto legislation to pass in the coming days/weeks/months.
Crypto — particularly BTC and ETH — will become silent stores of value during the economic storm.
Expect record-breaking levels:
400
K
f
o
r
B
i
t
c
o
i
n
∗
∗
,
∗
∗
400KforBitcoin∗∗,∗∗40K for Ethereum.
Yes, this may sound like science fiction…
But keep your eyes and ears wide open. 👁️
And brace yourself for a historic collapse in U.S. equities. Possibly… something we’ve never seen before.
The show is starting.
And we won’t spoil the ending — because watching it unfold is part of the experience.
But here’s what we can say, thanks to our proprietary algorithmic system:
The U.S. economy will bleed.
And crypto will blow past expectations — fulfilling the very purpose it was built for.
🛒 Load your bags in the coming days...
Because when this train leaves the station —
It won't be stopping for anyone.

SUI analysis In this video I go through the recent bullish trend in SUI and anticipate where I think the retrace will take us for a possible long entry . I also highlight a possible short setup off of the Value area high if it comes in .
Tools used in the video TR Pocket / Fibs , Volume Profile and Pivots .
Appreciate your support any questions then please leave them in the comments
Have a great day
