GoldViewFX - DAILY CHART UPDATED LEVELS & TARGETS$Hey Everyone,
We have been following this daily chart for a while now to give an overall picture of the direction. Price found support at the 1804 zone, as identified and then went onto HITTING 1858 target.
We are now looking for a cross and lock above 1858 to confirm further push up to the next Goldturns.
We can also see EMA5 is on the verge of crossing MA21 hopefully with another daily candle, which will confirm the lock. This will provide the momentum needed for another push up. Failure to cross and lock will see price rejected back to low 1800's.
As always we will keep this chart updated to keep in mind the overall picture and structure. Please don't forget to like, comment and follow to support us, we really appreciate it!
GoldViewFX
XAUUSD TOP AUTHOR
Sellsetup

GoldViewFX - 4H CHART UPDATED LEVELS & TARGETS$Hey Everyone,
We have been following this chart from last week, which has been playing out perfectly! Hitting level to level in sequence, finishing off Friday with our final TARGET hit.
We had the 1862 target HIT and now rejected here and potentially opening retracement to 1842 zone. However we are expecting 1862 to be hit again, as our next TARGET and we also have a gap open to 1879. 1879 is still quite far off and therefore targeting buys from dips and banking 30 to 40 pips at a time is the safer strategy for this market, when chasing a trend in volatile conditions.
BULLISH TARGETS
1862, 1879
RETRACEMENT TARGET
1842
SWING RANGE TO MANAGE RISK
1835
As always we will keep you all updated with any changes to our setups, please don't forget to like, comment and follow to support us, we really appreciate it!
GoldViewFX
XAUUSD TOP AUTHO

XRPUSDTThe price of putty does not seem to have a strong uptrend.
It is likely that the price will have a downtrend from the out of the base range specified at 0.4221 to the price range of 0.383.

More downside for the NASDAQWhats happening traders. So as some of you know i use the ichimoku cloud trading strategy, and 3 of the alerts and signals have just triggered. Signals being the red cloud, base line and conversion line crossover and the lagging span has breached to the underside of the cloud. If we dont get a bullish rally this week and the lagging span remains under the cloud for the week then we could see price dropping down towards 1100 and 10300 which in my opinion seem to be the next resistance areas.
Keep in mind we have had 7 weeks of red so we could potentially see and upwards rally.
Keep an eye on this.
cheers.

AAPL 4h breakout predictionOn the chart there are major and minor levels marked. AAPL has moved within the pink 4h range since Jan with multiple attempts to break higher that failed. Smart traders buy the lows of these ranges. However the market is very bearish in general and it looks like a good opportunity to look for a lower level move. Good 15min trade setups can be cooking here for the open space move down to 151 area with lower targets below.. but don't get greedy if you get in this move. a break back up into the range is more likely than a complete breakdown. Keeping a small portion runner is ok though. Happy trading.

GoldViewFX - Updated LEVELS & TARGET$$Hey Everyone,
As you can see our trading plan has played out perfectly!! We saw price test the support area 1811, as identified on the chart and then followed by the anticipated breakout to MA200, 1822, 1836 and 1847.
We are expecting another challenge to 1847. An EMA5 break and lock above 1847 will confirm further move up to 1855, 1861. 1861 is a gap that has also been left open from the previous run.
It will be nice to see a retracement challenge at 1836 and see this level turn into a support level to continue further movement up. Failure to hold this level as support will see price head back for 1822 and 1811 for support.
Please see the 1H chart below with the potential setup broken down using our ascending Goldturn channel, which price has just broken out of with ema5 lock. The maximum retracement we can see for now is 1830 should price break back into the channel otherwise a clean breakout is taking place.
As always we will keep you all posted with any changes to our plans. Please don't forget to like, comment and follow to support us, we really appreciate it!
GoldViewFX
XAUUSD TOP AUTHOR

Eurusd for bearishAccording to 200 EMA 1H, it's possible for EURUSD turned back to the bearish trend. If u have some patience to waiting for complete confirmation. U can enter the sell position when it's break the trend line, but if u are an aggressive trader. U can sell on the red zone.
Please take care of ur own money management, i won't take responsibility if u losing big money or mc

GoldViewFX - Market UPDATEHey Everyone,
As you can see our roadmap has been playing out level to level with targets not only getting HIT but in order.
We were expecting movement down to support zone identified on the chart, which we took with a signal and then, as per our chart idea, we saw price bounce off to target 1822 Goldturn.
We have a candle body close above 1822 Goldturn, which opens 1836 again, however this is without EMA5 cross, so not as strong. However we have all MA's converging together, which usually happens before a breakout and we have ma200 sitting just above close to 1836 away from all the converging MA's, which may get magnetised for a HIT, strengthening the 1836 TARGET.
We also have a candle body close below 1811 opening 1804 for a lower target. As you can see the converging MA's are creating gaps in both directions, which happens when price ranges side by side in a tight range.
BULLISH TARGETS
1822, 1836, 1847, 1861
BEARISH TARGETS
1811, 1804, 1797, 1788
We will look for EMA5 cross and lock with candle body close to determine direction level to level and we will use our daily intraday levels that we share for exits and entries.
Please don't forget to like, comment and follow to support us, we really appreciate it!
GoldViewFX
XAUUSD TOP AUTHOR

EUR/USDEur/usd seems to be heading to wards a strong drop,judging by what I see,it seems as if a short is being cooked.I stand to be corrected

GBPJPY breach below will drag the pairGBPJPY continues to trade weak for a fourth consecutive week and lost more than 1000 pips on the weak pound sterling. It showed a minor pullback from a 2-year low
Technicals:
On the lower side, immediate support is around 157,

GoldViewFX - UPDATED LEVELS & TARGETS$Hey Everyone,
We had another smashing day today with a buy signal with the perfect exit using our custom intraday levels to then follow with a sell signal. Both signals HIT target and out! The market continued to break through levels, as we anticipated this yesterday highlighting the lower levels being open and to consider this while chasing any bull targets.
We have had a weekly chart MA83 touch, which may provide some dynamic support. We have now drawn a Goldturn channel, which highlights a upper challenge at 1851 and a lower challenge at 1793. We need to consider this range while trading Goldturn to Goldturn.
Bullish TARGETS
1825, 1842, 1851
BEARISH TARGETS
1814, 1804, 1793
SWING RANGE
1780
As always we will keep you updated with any changes to our plans, please don't forget to like, comment and follow to support us, we really appreciate it!
GoldViewFX
XAUUSD TOP AUTHOR

GoldViewFX - MARKET UPDATEHey Everyone,
We had an awesome day today with our trading plan playing out to perfection!!! (see related post below)
We hit all our projected targets from retracement to 1832 to find support, as identified - followed by 1839, 1844, 1849, 1854, and then to finish of with a BOOM 1857.
Why do we stick to buys I hear a lot of you ask? well I've been trading the Gold market for over 10 years and have traded and managed most market conditions. Every so often a winning streak is broken with getting stuck in a big swing. Back test the Daily chart structure and you will see getting stuck in a swing with buys is far safer than a sell swing. The last 3 years I have found it both safer and profitable to have a 70/30 ratio with buys vs sells.
The lower range has opened up so we must keep that in mind while taking buys and manage risk accordingly. Markets are volatile so we expect swings both ways.
We expect some retracement and then continuation of movement up.
BULLISH TARGETS
1854, 1857, 1863
BEARISH TARGETS
1849,1844
SWING RANGE
1832
As always we will keep you all updated with any changes to our plans throughout the day. Please don't forget to like, comment and follow to support us, we really appreciate it!
GoldViewFX
XAUUSD TOP AUTHOR

GBPAUD sell price hit a very strong support on the daily/weekly, it could be getting ready to bounce back up.
currently selling due to the trend and price is below my resistance zone

GoldViewFX - MARKET UPDATEHey Everyone,
Quick update on todays movement. We saw Gold move down today with strong momentum. Each level was confirmed using EMA5 cross and lock and fulfilled the gaps. Well done for anyone taking advantage of this movement. We did not take advantage of this movement down as we remain Bullish waiting for the right entries.
We cam see price is challenging the daily chart Goldturn trendline and hoping it find support here. If momentum continues we can see this go as low as 1835 for support otherwise we should see some movement back up.
We will watch the daily chart closely for a break in the structure and setup. Please don't forget to like, comment and follow to support us.
GoldViewFX
XAUUSD TOP AUTHOR

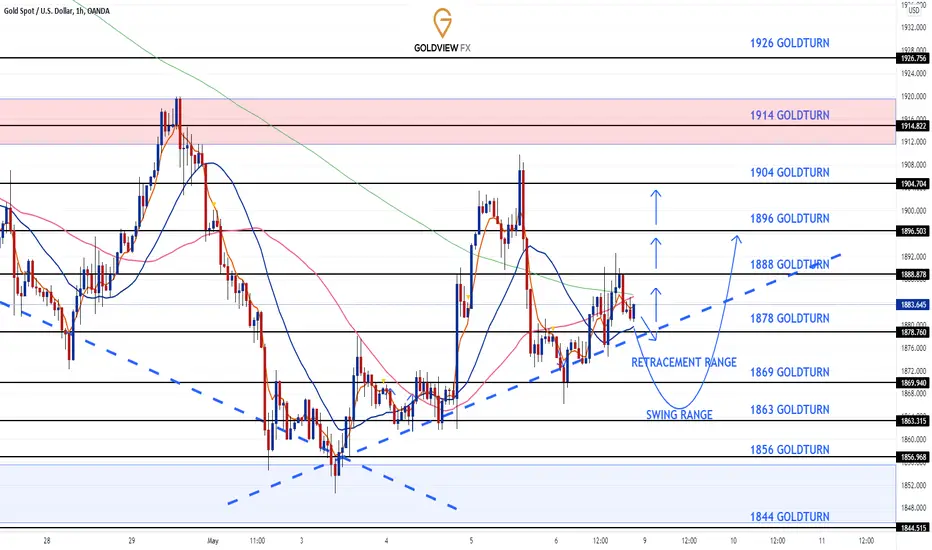
GoldViewFX - 1H CHART UPDATED LEVELS & TARGETSHey Everyone,
Please see updated Goldturns and Targets for the 1H chart.
We will be looking for EMA5 cross on the Goldturns followed with a candle body close to confirm the next level.
Bullish TARGETS
1888, 1896, 1904
RETRACEMENT RANGE (layering range)
1878 - 1869
SWING RANGE (risk management range)
1863
We plan on buying from drops to support levels and taking 20 to 30 pips at a time to avoid getting stuck in swings. We will also be using EMA5 cross and lock to confirm targets to each level before starting to layer entries from support.
As always we will keep our followers updated with daily updates. Please don't forget to like, comment and follow to support us, we really appreciate it!
GoldViewFX
XAUUSD TOP AUTHOR
NZDCAD getting ready for a drop!Hello guys,
Based on the chart we have a good bearish trend and we can consider this slight bullish movement as correction and getting ready for another sell.
Note: This post will be update base on market reaction.
✅✅ If you found our analysis useful, please Like and Subscribe us to receive more signals in future. ✅✅
Good luck!

XAUUSD - KOG REPORT - NFP!KOG Report NFP:
This is our view for NFP today, please do your own research and analysis to make an informed decision on the markets. It is not recommended you try to trade the event if you have less than 6 months trading experience and have a trusted risk strategy in place. The markets are extremely volatile and can cause aggressive swings in price.
We’re going to keep this brief today as its very likely we won’t be trading this release unless our key levels are hit and then we may look to take a position. So far this week we’ve hit the lower target on Gold and we’ve hit the 1913-15 target on Gold. This leaves us with two values, one above and one below that we now want to target. The level above is illustrated on the chart and is around the 1925 price region, this level we feel would represent an opportunity to take the short trade back towards the lower targets starting at 1840.
The lower target is an aggressive low which is situated around the 1825 region. A push on the price towards this level we feel would represent an opportunity to take the long trade back up to target the 1850, 1860 and above that 1880 levels. Just as we saw with the FOMC report we swung into our zone and the price reacted giving the short. This time we’ll wait again at the higher or lower regions and not get involved on the intraday levels, especially on a Friday!
Hope this helps in preparation for NFP. Please do support us by hitting the like button, leaving a comment and giving us a follow. We’ve been doing this for a long time now providing traders with in-depth free analysis on Gold, so your likes and comments are very much appreciated.
As always, trade safe.

GBPJPY SHORTResistance broke so lets aim for 159.64
Im looking out for news but should go smooth enough

GoldViewFX - UPDATED LEVELS & TARGETSHey Everyone,
Another awesome finish to today!!! All our targets from our trading plan posted yesterday 1878 and 1888 targets were HIT perfectly. We also had a pre FOMC target at 1875, which we took before FOMC and then the FOMC CANDLE gave us the TP to finish off nicely.
Bullish TARGETS
1888, 1896
RETRACEMENT RANGE
1869 - 1863
SWING RANGE
1856
DAILY CHART
Keep this chart in mind when asking why we keep buying dips. The daily chart always reminds us of the overall long term trend and the BULLISH STRUCTURE.
We will keep you posted with any changes throughout. We expect a volatile week and therefore keeping the swing range in mind to manage risk effectively.
Please don't forget to like, comment and follow to support us, we really appreciate it!
GoldViewFX
XAUUSD TOP AUTHOR

GoldViewFX - 1H CHART UPDATED LEVELS & TARGETS$Hey Everyone,
We had another awesome day of trading. We waited patiently for the support at 1856 and once we saw a new Goldturn being created on that level, it gave us the confidence to take buys banking on each intraday level all the way to our SIGNAL TARGET AT 1873.
We have a swing range at 1844 inline with the Goldturn trendline. As long as EMA5 remains above 1844 on the hourly chart we can continue to take those sniper entries. We saw a lot of negative pressure on Gold due to FOMC Wednesday and the anticipated rate hike, which seems to have been priced in.
We have updated the 1h chart with the most upto date weighted GOLDTURNS for everyone.
We are taking it slow and observing and waiting for the right entries and banking in stages using our custom intraday levels for our members to avoid getting stuck in swings. This has been working out beautifully for us!
We have Bullish TARGETS at 1869, 1878, 1888
Bearish TARGETS at 1863, 1856
SWING RANGE - 1844
As always we will keep you all updated with any changes to our setups daily. Please don't forget to like, comment and follow to support us, we really appreciate it!
GoldViewFX
XAUUSD TOP AUTHOR

GoldViewFX - 4H CHART LEVELS & TARGETSHey Everyone,
We have updated the Goldturn support and resistance levels on the 4h chart and we can see 1884 providing support with a new Goldturn. As long as we see EMA5 remain above 1884 we should resume back to a Bullish movement and range into hitting the immediate Bullish Targets.
If we see EMA5 break 1884 then we may see a deeper correction the 1835 inline with the Goldturn trendline support otherwise we remain confident to see price climb back up again.
Bullish Targets
1914, 1930, 1939
RETRACEMENT RANGE
1884, 1869
Our plans are to take buys from support levels and bank 20 to 30 pips at a time to avoid getting stuck in any swings. We will only take sells should we get a strong signal activate.
As always we will continue to update any changes to our plans daily.
Please don't forget to like, comment and follow to support us, we really appreciate it!
GoldViewFX
XAUUSD TOP AUTHOR

GoldViewFX - 1H CHART UPDATED LEVELS & TARGETSHey Everyone,
We have updated the Goldturn levels and drawn a GOLDTURN channel. We can see price has broken out of the GOLDTURN descending channel and challenged 1920 GOLDTURN before retracing down again. We expect some retracement to the channel support at 1888 and 1878 at some point to test the channel for support otherwise we are happy to start using our intraday levels to buy dips for the immediate Bullish TARGETS.
BULLISH TARGETS
1896, 1904, 1914, 1920
RETRACEMENT TARGETS
1888, 1878
EMA5 break above 1920 GOLDTURN will open the upper targets and EMA5 break below 1878 will open the lower TARETS 1869 and below. The current immediate range we can see is 1920 to 1869.
As always please don't forget to like, comment and follow to support us, we really appreciate it
GoldViewFX
XAUUSD TOP AUTHOR

GoldViewFX - 1H & 4H CHART UPDATED LEVELS & TARGET$$Hey Everyone,
Being patient while price worked its way down, paid off. We avoided getting stuck while we completed the bull run with all targets HIT, without getting stuck using our strategy. We took sniper entries with safe exits and today we started to take sells with our Sell signal HITTING TP.
The 4H chart GOLDTURNS have been updated and we can see we have a EMA5 break and close below 1896 opening TARGET to 1881 (complete) and 1869 with a retracement range of 1914.
Please see 1H CHART below with updated lower GOLDTURN levels. We have broken out of two ranges and EMA5 has also crossed and locked below 1888 opening the lower levels of 1885 and 1877. We still have a retracement range of 1907 and 1917. A retest and failure on these two resistance levels will give us more confidence in adding to our SELL targets.
We are trading small LOTs to avoid getting stuck as the upper range is still in view and we have some retracement due when the steam runs out. This is where we need to be careful, as BULLISH retracements can easily gain momentum when the Bulls make a run.
As always we will keep you all updated with and changes to our plans. Please don't forget to like, comment and follow to support us, we really appreciate it.
GoldViewFX
XAUUSD TOP AUTHOR
