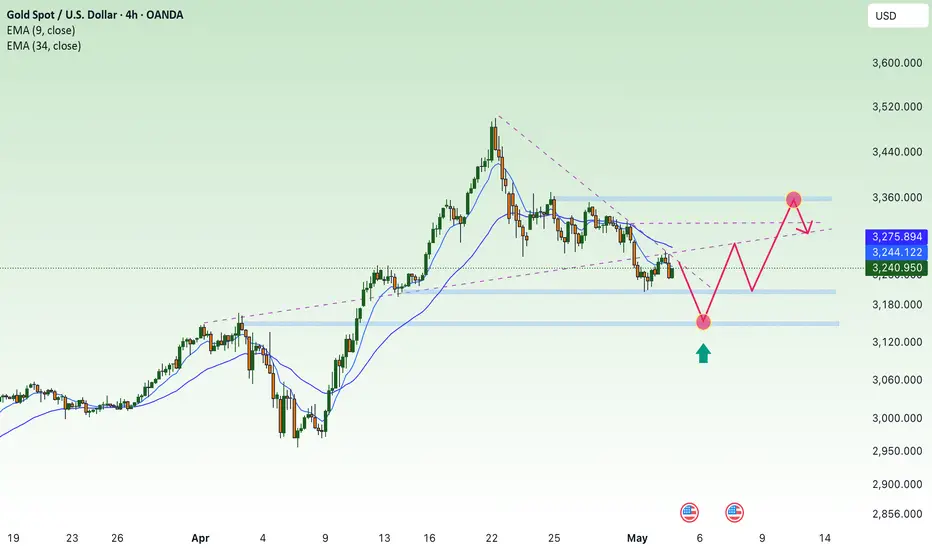
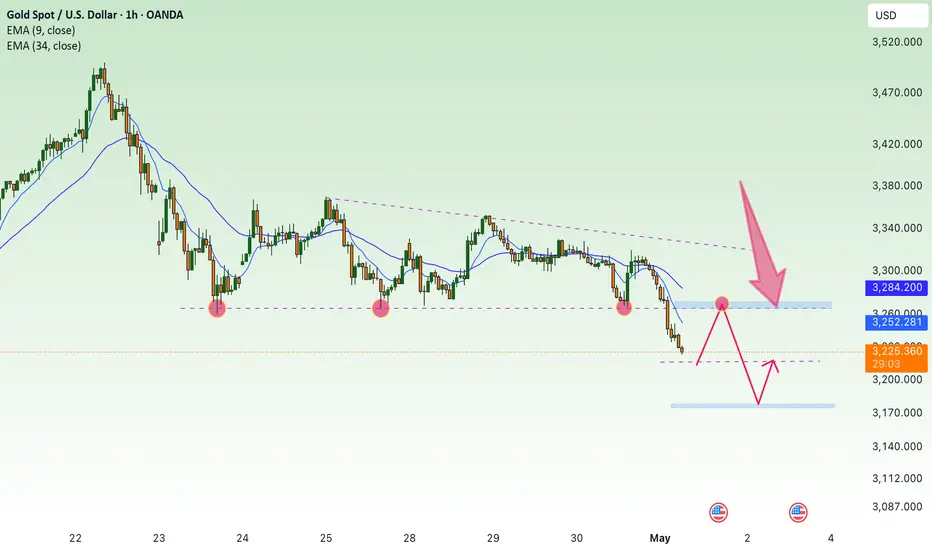
XAU/USD continues sideways above 3200 zone⭐️GOLDEN INFORMATION:
U.S. President Donald Trump stated on Monday that he does not anticipate reinstating the 145% tariffs on Chinese imports following the current 90-day suspension. In a Fox News interview on Wednesday, he emphasized the "excellent" relationship with China, which fueled trade optimism and weighed on safe-haven demand for Gold during the Asian session.
Meanwhile, on the geopolitical front, Russia and Ukraine are preparing for their first high-level, in-person negotiations since 2022, scheduled to take place in Istanbul this week. The talks come amid mounting international pressure for Moscow to accept a proposed 30-day ceasefire. Representing the U.S., Secretary of State Marco Rubio, along with special envoys Steve Witkoff and Keith Kellogg, are expected to participate in the discussions.
⭐️Personal comments NOVA:
Accumulation price zone, gold price sideways around 3200 - 3270, balance between buyers and sellers
⭐️SET UP GOLD PRICE:
🔥SELL GOLD zone : 3282- 3284 SL 3289
TP1: $3270
TP2: $3260
TP3: $3250
🔥BUY GOLD zone: $3167 - $3165 SL $3160
TP1: $3178
TP2: $3189
TP3: $3200
⭐️Technical analysis:
Based on technical indicators EMA 34, EMA89 and support resistance areas to set up a reasonable sell order.
⭐️NOTE:
Note: Nova wishes traders to manage their capital well
- take the number of lots that match your capital
- Takeprofit equal to 4-6% of capital account
- Stoplose equal to 2-3% of capital account
Sellsignal

CPI - inflation assessment, gold accumulation⭐️GOLDEN INFORMATION:
Swap markets have now fully priced in a 25 basis point rate cut by the Federal Reserve in September, with expectations for two additional reductions by year-end. This marks a slight shift from last week, when traders had anticipated the first cut as early as July and a total of three rate cuts in 2025.
On the geopolitical front, Indian Prime Minister Narendra Modi stated on Monday that military operations against Pakistan are merely on hold, warning that future actions will depend on Islamabad’s conduct. Meanwhile, Ukrainian President Volodymyr Zelensky expressed willingness to meet Russian President Vladimir Putin later this week, following US President Donald Trump's call for him to "immediately" accept a peace summit invitation in Turkey. Heightened geopolitical risks from these developments could fuel demand for safe-haven assets like gold, reinforcing the metal’s appeal amid ongoing global uncertainty.
⭐️Personal comments NOVA:
CPI assesses the level of inflation in the US economy, gold prices continue to strive to maintain the price range around 3200
⭐️SET UP GOLD PRICE:
🔥SELL GOLD zone : 3281- 3283 SL 3288
TP1: $3270
TP2: $3260
TP3: $3250
🔥BUY GOLD zone: $3176 - $3174 SL $3169
TP1: $3185
TP2: $3198
TP3: $3210
⭐️Technical analysis:
Based on technical indicators EMA 34, EMA89 and support resistance areas to set up a reasonable sell order.
⭐️NOTE:
Note: Nova wishes traders to manage their capital well
- take the number of lots that match your capital
- Takeprofit equal to 4-6% of capital account
- Stoplose equal to 2-3% of capital account

Bears are active at the beginning of the week, prices are down⭐️GOLDEN INFORMATION:
The United States and China announced “substantial progress” following two days of trade negotiations in Switzerland, marking a potential turning point in efforts to ease tensions between the world’s two largest economies. Chinese Vice Premier He Lifeng characterized the discussions as “an important first step” toward stabilizing bilateral trade, while US Treasury Secretary Scott Bessent echoed the sentiment, noting meaningful advancements were made. The US is expected to release more details about the outcome of the talks on Monday.
While signs of progress may dampen demand for safe-haven assets like gold, lingering uncertainty around the specifics of any deal could still lend some support to the precious metal. “Ongoing ambiguity surrounding tariffs remains one of the most influential factors sustaining gold,” noted David Meger, Director of Metals Trading at High Ridge Futures.
⭐️Personal comments NOVA:
The short-term downtrend is maintained, gold price accumulates around 3300 and continues to go down to lower support zones.
⭐️SET UP GOLD PRICE:
🔥SELL GOLD zone : 3315- 3317 SL 3322
TP1: $3300
TP2: $3290
TP3: $3280
🔥BUY GOLD zone: $3223 - $3225 SL $3218
TP1: $3238
TP2: $3245
TP3: $3260
⭐️Technical analysis:
Based on technical indicators EMA 34, EMA89 and support resistance areas to set up a reasonable sell order.
⭐️NOTE:
Note: Nova wishes traders to manage their capital well
- take the number of lots that match your capital
- Takeprofit equal to 4-6% of capital account
- Stoplose equal to 2-3% of capital account

SHORT ON GBP/JPYGJ Has finally pulled back to a Major Resistance area.
This previous high broke a low in the past and is a strong resistance zone.
I expect price to fall to the pervious swing low / demand are for over 300-400 pips.

H4 frame accumulation 2 trend lines✍️ NOVA hello everyone, Let's comment on gold price next week from 05/12/2025 - 05/16/2025
🔥 World situation:
Gold prices advanced over 1% on Friday, rebounding as the US Dollar (USD) softened following a two-day winning streak, pressured by declining US Treasury yields. Renewed risk-off sentiment, fueled by persistent geopolitical tensions, bolstered demand for the safe-haven metal. At the time of writing, XAU/USD is trading near $3,338.
US equity markets slipped as investors adopted a cautious stance ahead of Saturday’s high-stakes meeting between US and Chinese delegations in Switzerland. While hopes for a de-escalation in trade tensions remain elevated, uncertainty continues to dominate sentiment.
Adding to the volatility, US President Donald Trump reignited trade concerns by stating on social media, “80% Tariff on China seems right! Up to Scott B.”
🔥 Identify:
Gold prices slow down, starting to accumulate more. Trade negotiations will appear more, putting selling pressure on gold prices in the near future.
🔥 Technically:
Based on the resistance and support areas of the gold price according to the H4 frame, NOVA identifies the important key areas as follows:
Resistance: $3402, $3435
Support : $3282, $3203
🔥 NOTE:
Note: Nova wishes traders to manage their capital well
- take the number of lots that match your capital
- Takeprofit equal to 4-6% of capital account
- Stoplose equal to 2-3% of capital account
- The winner is the one who sticks with the market the longest

Downtrend - will gold price return to 3233?⭐️GOLDEN INFORMATION:
Gold price (XAU/USD) rebounded from an early Asian session drop to a multi-day low, reclaiming ground above the $3,300 psychological level in the past hour. The precious metal continues to draw support from persistent geopolitical uncertainties, including the Russia-Ukraine conflict, intensifying tensions in the Middle East, and renewed friction along the India-Pakistan border. That said, the upside appears constrained by improving risk sentiment, driven by renewed optimism surrounding a US-UK trade agreement and the launch of US-China tariff negotiations over the weekend.
⭐️Personal comments NOVA:
Gold prices are under great selling pressure as trade negotiations on tariffs are becoming more active. They may return to the 323x price zone and continue to accumulate.
⭐️SET UP GOLD PRICE:
🔥SELL GOLD zone : 3351- 3353 SL 3358
TP1: $3340
TP2: $3330
TP3: $3320
🔥BUY GOLD zone: $3232 - $3234 SL $3227
TP1: $3245
TP2: $3260
TP3: $3270
⭐️Technical analysis:
Based on technical indicators EMA 34, EMA89 and support resistance areas to set up a reasonable sell order.
⭐️NOTE:
Note: Nova wishes traders to manage their capital well
- take the number of lots that match your capital
- Takeprofit equal to 4-6% of capital account
- Stoplose equal to 2-3% of capital account

bullish momentum, accumulating around 3400⭐️GOLDEN INFORMATION:
Gold price (XAU/USD) regained strong upward momentum during the Asian session on Thursday, rebounding sharply above the $3,400 level in the past hour and recovering much of its overnight pullback from a two-week high. The renewed demand for the safe-haven metal comes as US President Donald Trump downplayed expectations of an imminent resolution to the US-China trade dispute, stating he feels "no rush" to finalize an agreement. Heightened geopolitical tensions—including the ongoing Russia-Ukraine war, instability in the Middle East, and escalating military friction between India and Pakistan—further support gold's appeal as a defensive asset.
⭐️Personal comments NOVA:
Gold price continues to recover well around 3400, FED's speech is quite moderate, predicted early by investors, the market is positive in the recovery trend this week
⭐️SET UP GOLD PRICE:
🔥SELL GOLD zone : 3438- 3440 SL 3445
TP1: $3425
TP2: $3410
TP3: $3395
🔥BUY GOLD zone: $3352 - $3350 SL $3345
TP1: $3365
TP2: $3380
TP3: $3400
⭐️Technical analysis:
Based on technical indicators EMA 34, EMA89 and support resistance areas to set up a reasonable sell order.
⭐️NOTE:
Note: Nova wishes traders to manage their capital well
- take the number of lots that match your capital
- Takeprofit equal to 4-6% of capital account
- Stoplose equal to 2-3% of capital account

SHORT ON NZD/CHFNZD/CHF is currently falling from a major resistance level.
I will be selling this pair to the next level of demand/support for 150-200 pips.

Interest rates, will gold prices fall sharply today?⭐️GOLDEN INFORMATION:
However, US Dollar bulls appear cautious, holding back from making bold moves as they await clearer signals regarding the Federal Reserve’s (Fed) future rate-cut trajectory. This wait-and-see stance, combined with ongoing geopolitical tensions—particularly the prolonged Russia-Ukraine conflict and unrest in the Middle East—continues to bolster demand for safe-haven assets like gold. As such, investors are likely to remain on the sidelines until the conclusion of the closely watched two-day FOMC policy meeting on Wednesday.
⭐️Personal comments NOVA:
Gold price awaits today's interest rate result, there was a good recovery above 3400 but then fell immediately after, showing that the market is not ready for the first interest rate cut if any, gold price may face strong selling pressure today
⭐️SET UP GOLD PRICE:
🔥SELL GOLD zone : 3438- 3440 SL 3445
TP1: $3425
TP2: $3410
TP3: $3395
🔥SELL GOLD zone : 3396- 3398 SL 3402 scalping
TP1: $3390
TP2: $3380
TP3: $3365
🔥BUY GOLD zone: $3308 - $3306 SL $3301
TP1: $3315
TP2: $3330
TP3: $3345
⭐️Technical analysis:
Based on technical indicators EMA 34, EMA89 and support resistance areas to set up a reasonable sell order.
⭐️NOTE:
Note: Nova wishes traders to manage their capital well
- take the number of lots that match your capital
- Takeprofit equal to 4-6% of capital account
- Stoplose equal to 2-3% of capital account

Ethereum Prepares for Major Pectra UpgradeEthereum—the second-largest cryptocurrency by market capitalization—is set to undergo a major upgrade in May 2025, known as “Pectra.” This update promises to significantly improve scalability, performance, and user experience. But what exactly does it entail?
Pectra follows the groundbreaking "Merge" event of 2022, which shifted Ethereum from proof-of-work to proof-of-stake consensus. With that transition complete, developers have now turned their focus to making the network faster, cheaper, and more user-friendly.
The upgrade includes several Ethereum Improvement Proposals (EIPs), targeting transaction processing, wallet functionality, and validator operations. Some key highlights are improvements in staking, partial withdrawals, adaptive fee structures, and better client compatibility.
Most notably, Pectra enhances staking mechanics, allowing validators to partially withdraw funds—something that was previously restricted. This change is expected to attract more participants to Ethereum’s staking ecosystem.
Transaction efficiency is also a central focus. The upgrade aims to reduce network congestion and lower gas fees, which have long been a pain point for users of decentralized finance (DeFi) platforms and NFT marketplaces.
Investor sentiment is cautiously optimistic. Though ETH price action remains relatively stable, trading volumes have increased as traders position themselves ahead of the upgrade. Analysts suggest that a successful implementation could trigger a rally in Ethereum’s price, especially if the changes deliver on promised performance gains.
Ethereum continues to dominate the smart contract space despite increasing competition from blockchains like Solana and Avalanche. Pectra could further solidify Ethereum’s lead, especially if it improves network speed and lowers costs without compromising decentralization.
This upgrade isn’t just a technical patch—it’s a strategic move to future-proof the Ethereum ecosystem in the Web3 era. With Pectra, Ethereum reinforces its role as the foundational infrastructure for decentralized applications.

GBPUSD Sell Insight Last week cleared the previous week's high 1.34232 and closed below it.
This signifies more push to the downside from the weekly perspectives
I'm anticipating the previous weekly low to be the first draw on Liquidity 🧲
On the daily timeframe we have a break of structure from 1.33044 to the downside and the QML level 1.33784 whic6also aligns within an imbalance on the H4 would be used for sell continuation after the short reversal that happens.
Look for entry on the H4 and sell to the draw on Liquidity zone
Kindly share if you find this insightful.
It's been a while here. I'm more active on X (Twitter) now

SHORT ON NAS100Nice Double Top on NAS at a major resistance level.
I will be selling nas to the next demand level for 2000-3000 points.

SHORT ON SPYNice Double Top at a Major supply zone on spy.
I will be selling spy to the next demand zone for almost 900 points. (INSANE)

Sideway range, gold price accumulates below 3302⭐️GOLDEN INFORMATION:
Gold price (XAU/USD) kicked off the week on a positive note, rising toward the $3,271 level during Monday’s Asian session as a blend of geopolitical and economic concerns fueled demand for the safe-haven asset. The prolonged Russia-Ukraine conflict, coupled with renewed tensions in the Middle East, continues to elevate global risk sentiment. Meanwhile, lingering uncertainty surrounding US President Donald Trump's tariff agenda has added to investor caution, further supporting the appeal of gold as a hedge in times of instability.
⭐️Personal comments NOVA:
Gold price continues to accumulate, low amplitude at the beginning of the week, waiting for the most important interest rate information this week
⭐️SET UP GOLD PRICE:
🔥SELL GOLD zone : 3302- 3304 SL 3309
TP1: $3290
TP2: $3280
TP3: $3270
🔥BUY GOLD zone: $3204 - $3206 SL $3199
TP1: $3215
TP2: $3224
TP3: $3240
⭐️Technical analysis:
Based on technical indicators EMA 34, EMA89 and support resistance areas to set up a reasonable SELL order.
⭐️NOTE:
Note: Nova wishes traders to manage their capital well
- take the number of lots that match your capital
- Takeprofit equal to 4-6% of capital account
- Stoplose equal to 2-3% of capital account

Lack of bullish momentum, gold price waits, slight decrease✍️ NOVA hello everyone, Let's comment on gold price next week from 05/05/2025 - 05/09/2025
🔥 World situation:
Gold (XAU/USD) slipped by more than 0.35% on Friday and is on track to close the week with a decline exceeding 2.5%, as easing trade tensions and upbeat US labor market data boosted investor risk appetite. This shift in sentiment encouraged profit-taking ahead of the weekend, weighing on the safe-haven asset. At last check, XAU/USD was trading around $3,226, pulling back from an intraday peak of $3,269.
Adding to the improved market mood, China’s Commerce Ministry confirmed that the US has shown a willingness to resume discussions on tariffs, while reiterating that Beijing remains open to dialogue.
🔥 Identify:
Gold price continues to adjust down, lacking momentum to increase price. around price range 3200 - 3350
🔥 Technically:
Based on the resistance and support areas of the gold price according to the H4 frame, NOVA identifies the important key areas as follows:
Resistance: $3285, $3316, $3355
Support : $3202, $3155
🔥 NOTE:
Note: Nova wishes traders to manage their capital well
- take the number of lots that match your capital
- Takeprofit equal to 4-6% of capital account
- Stoplose equal to 2-3% of capital account
- The winner is the one who sticks with the market the longest
NF fluctuates in a downward trend⭐️GOLDEN INFORMATION:
China’s Ministry of Commerce announced Friday that the United States has recently initiated communication through official channels, expressing interest in reopening talks on tariffs. Beijing is currently evaluating the proposal, fueling optimism that a resolution to the prolonged tariff standoff between the world’s two largest economies may be on the horizon.
This renewed hope for a breakthrough in trade negotiations helped lift the US Dollar to a three-week high on Thursday, pressuring Gold prices down toward the $3,200 mark. However, bullish momentum for the USD remains tempered as markets increasingly price in the likelihood of more aggressive rate cuts by the Federal Reserve, especially with the closely watched US Nonfarm Payrolls data looming.
⭐️Personal comments NOVA:
NF news volatility is certain, with the big accumulation from last week. Gold price has confirmed the trend after breaking 3267, will fluctuate in a downtrend below 3200
⭐️SET UP GOLD PRICE:
🔥SELL GOLD zone : 3312- 3310 SL 3317
TP1: $3290
TP2: $3280
TP3: $3270
🔥BUY GOLD zone: $3175 - $3177 SL $3170
TP1: $3185
TP2: $3200
TP3: $3210
⭐️Technical analysis:
Based on technical indicators EMA 34, EMA89 and support resistance areas to set up a reasonable SELL order.
⭐️NOTE:
Note: Nova wishes traders to manage their capital well
- take the number of lots that match your capital
- Takeprofit equal to 4-6% of capital account
- Stoplose equal to 2-3% of capital account

SHORT ON EUR/JPYEUR/JPY has created a head and shoulders pattern at a major resistance area.
I will be selling EJ to the pervious swing low / demand level.

Gold price weakens, correction 3176⭐️GOLDEN INFORMATION:
Gold’s intraday decline appears partly driven by technical selling pressure after decisively breaking below the key $3,265–$3,260 support zone. However, the US Dollar (USD) struggles to sustain any significant recovery as expectations grow for more aggressive Federal Reserve (Fed) rate cuts—fueled by an unexpected contraction in US GDP and signs of softening inflation. These factors may continue to support demand for the non-yielding precious metal, suggesting that traders should remain cautious before anticipating a deeper pullback from the recent all-time high near $3,500.
⭐️Personal comments NOVA:
Crossing the 3264 mark in the sideways price zone, gold prices continue to weaken.
⭐️SET UP GOLD PRICE:
🔥SELL GOLD zone : 3270- 3272 SL 3277
TP1: $3260
TP2: $3250
TP3: $3240
🔥BUY GOLD zone: $3178 - $3176 SL $3171
TP1: $3185
TP2: $3200
TP3: $3210
⭐️Technical analysis:
Based on technical indicators EMA 34, EMA89 and support resistance areas to set up a reasonable SELL order.
⭐️NOTE:
Note: Nova wishes traders to manage their capital well
- take the number of lots that match your capital
- Takeprofit equal to 4-6% of capital account
- Stoplose equal to 2-3% of capital account
EURJPY SellLadies and gentlemen, I’ve activated a sell position on EURJPY. The TP level looks quite promising. As shown on the chart, there are 4 different TP levels — feel free to adjust your trade accordingly. I’ll personally be setting my position with a 1:2.50 Risk-Reward Ratio.
🔔 I post detailed trade ideas and daily market analysis like this every day on my TradingView profile.
👉 Follow me to get notified and read the full breakdowns.

The SPX Sell Off at 5500Hi all,
It has been a while since we posted as we waited for a really good trade setup. The SPX is hovering at 5500 and we believe it is the right level to sell.
1) There is a shark pattern at this level
2) RSI is overbought on every time frame except H4 and D1
3) There are smaller patterns to sell
4) There is very strong structural resistance at 5510 to 5520
The first target will be 5306 which has a great risk to reward of 1:5.
We will wait for M15 divergence and a trend line break to enter.

continue to accumulate, gold price waiting for NF⭐️GOLDEN INFORMATION:
Gold price (XAU/USD) continues its downward trajectory, slipping toward $3,315 during early Asian trading on Wednesday as improving global risk sentiment and signs of easing trade tensions weigh on demand for the safe-haven asset. Market participants remain cautious ahead of key US economic data releases, including the ADP Employment Change, the Core PCE Price Index, and the preliminary Q1 GDP figures, all scheduled for later in the day.
Meanwhile, US President Donald Trump is reportedly aiming to reduce the overall impact of automotive tariffs by avoiding cumulative duties on foreign vehicles and loosening restrictions on imported parts used in domestic production. Treasury Secretary Scott Bessent added that major trade partners have made “very good” proposals to avert further US tariffs. Furthermore, exemptions on select US goods from retaliatory duties suggest a growing intent to de-escalate ongoing trade disputes.
⭐️Personal comments NOVA:
Gold price maintains accumulation range of 3265 - 3360, temporary stability awaits big fluctuations
⭐️SET UP GOLD PRICE:
🔥SELL GOLD zone : 3368- 3370 SL 3375
TP1: $3350
TP2: $3340
TP3: $3330
🔥BUY GOLD zone: $3264 - $3262 SL $3257
TP1: $3280
TP2: $3300
TP3: $3318
🔥BUY GOLD zone: $3285 - $3283 SL $3280 scalping
TP1: $3290
TP2: $3295
TP3: $3300
⭐️Technical analysis:
Based on technical indicators EMA 34, EMA89 and support resistance areas to set up a reasonable SELL order.
⭐️NOTE:
Note: Nova wishes traders to manage their capital well
- take the number of lots that match your capital
- Takeprofit equal to 4-6% of capital account
- Stoplose equal to 2-3% of capital account

SHORT ON GOLDGOLD has created a nice head and shoulders pattern and has also broke the neckline.
Since then we have created a lower high and are starting to push down.
Dollar should rise after news today at 8:15 this would aid in pushing gold down.
I will be selling gold to the 3000 price level looking to catch 2000 pips.

What is gold waiting for? Stuck in the 3300 area⭐️GOLDEN INFORMATION:
Gold price (XAU/USD) fails to build on Monday’s rebound from the key $3,265–$3,260 support zone, encountering renewed selling pressure during the Asian session on Tuesday. Although signals from the US and China remain mixed, investor sentiment remains buoyed by hopes of a potential easing in trade tensions between the world’s two largest economies. Additionally, signs of advancement in tariff negotiations have further bolstered optimism, dampening the appeal of the safe-haven metal.
⭐️Personal comments NOVA:
Gold price needs to be boosted by economic news to break out of the sideways price range around 3300, continue to wait today around 3300
⭐️SET UP GOLD PRICE:
🔥SELL GOLD zone : 3366- 3368 SL 3373
TP1: $3350
TP2: $3340
TP3: $3330
🔥BUY GOLD zone: $3267 - $3265 SL $3260
TP1: $3280
TP2: $3300
TP3: $3318
🔥BUY GOLD zone: $3301 - $3299 SL $3296 scalping
TP1: $3305
TP2: $3310
TP3: $3320
⭐️Technical analysis:
Based on technical indicators EMA 34, EMA89 and support resistance areas to set up a reasonable SELL order.
⭐️NOTE:
Note: Nova wishes traders to manage their capital well
- take the number of lots that match your capital
- Takeprofit equal to 4-6% of capital account
- Stoplose equal to 2-3% of capital account
