Gold prices cool after tariff announcement⭐️GOLDEN INFORMATION:
Gold prices (XAU/USD) surged to a new all-time high during the Asian session on Thursday as investors flocked to safe-haven assets amid heightened risk aversion. Market sentiment took a sharp downturn after US President Donald Trump unveiled sweeping reciprocal tariffs on Wednesday evening, igniting fears of a global economic slowdown and a potential US recession.
The announcement triggered a broad sell-off in equity markets, reinforcing the risk-off mood and further fueling demand for gold as a traditional store of value.
⭐️Personal comments NOVA:
Gold hits 3167 peak, buying pressure gradually decreases. Adjustment waiting for new moves from other countries on Trump's tariff policy
⭐️SET UP GOLD PRICE:
🔥 SELL 3165 - 3168 SL 3172
TP1: $3160
TP2: $3150
TP3: $3140
🔥BUY GOLD zone: $3108 - $3110 SL $3103
TP1: $3115
TP2: $3130
TP3: $3140
⭐️Technical analysis:
Based on technical indicators EMA 34, EMA89 and support resistance areas to set up a reasonable SELL order.
⭐️NOTE:
Note: Nova wishes traders to manage their capital well
- take the number of lots that match your capital
- Takeprofit equal to 4-6% of capital account
- Stoplose equal to 2-3% of capital account
Sellsignal

SHORT ON AUD/NZDAUD/NZD has given a perfect setup for a sell.
I has bearish divergence as well as a rising channel/wedge into a Major Supply Area from the Higher TF.
We have also change structure from Up to Down on the Lower Timeframe.
I will be selling AUD/NZD to the pervious swing low / demand area for about 100 pips. OANDA:AUDNZD

Trading GER30 on Tariff DayToday will be a big day for the stock market in 2025. The tariffs to be implemented promises to either make or break the market.
Last week we saw a massive sell off and on Monday and Tuesday we have seen the markets gain a decent amount. However here is what needs to be noted for all indexes:
1) The Daily downtrend is intact
2) The H4 MA is pointing down
3) On GER30,we see a bat pattern to sell
4) H1, M30, M15 is OB and has a double top
We should not follow the news, but instead focus on the charts. Based on this, we will enter a short position and expect the market to resume the downtrend.
Stop loss will be 200 pips around 25700. Good luck!

SHORT ON GBP/CADPrice has finally changed from up to down on the higher timeframe for GBP/CAD.
It has given us a change of character to the downside with a nice retest of a key supply area.
I will being selling GBP/CAD looking to make 200-300 pips.

NEULANDLAB short opportunityUpon the breakdown of the trendline NEULANDLAB has immense downside of 42 odd percentage. Next quarter results will be the catalyst, making or breaking the stock. Negative surprise in last two consecutive results declare us participants to beware of the liquidity present below this key level.
Short below daily close of 11,100
Stoploss - 8%
TP - Trail the 50 DMA close above

Quick sell on USDJPYUSDJPY is currently reacting off the resistance zone on a 1hr and this might see a bearish continuation off that zone

INVERSE CUP AND HANDLE $TSLA TO $120 The inverted cup and handle, also known as the upside-down cup and handle pattern, is a bearish chart formation that can occur in both uptrends and downtrends. Unlike the traditional bullish cup and handle pattern, this inverse pattern features two key components: the "cup," which forms an inverted U-shape, and the "handle," a brief upward retracement following the cup.
Sell NASDAQ:TSLA right now with fact check:
brand reputation risk, high competition, loss of EV market leadership, cyber truck/ product recalls, declining sales with lower margin, stock volatility concern, insider selling, investors buy it based on expected future earnings rather than its current profitability.
+ Head and shoulder/ inverse cup and handle, P/E ratio 79.8-161.23 (overpriced), falling knife, dead cat bounce, the lowest target estimate stands at $120.00, below the 50-day, 100-day, and 200-day moving averages, MACD indicator is -19.8, bearish signals.
+ potential stagflation, tariff war, slow economic growth, inflation, rising public debt, geopolitical tensions, ai bubble, and more

ETHUSD SELLSETHUSD is bearish. Price is consistency making LHs & LLs. 1539.00 area will be the next support hit.

A Gold'en Newtonian Sell-Off Porjected By MedianlinesSir Isaac Newton stated the Third Law of Motion in his landmark work, Philosophiæ Naturalis Principia Mathematica (commonly called the Principia), which was first published in 1687. This law appears in Book I, in the section titled Axioms, or Laws of Motion.
(Axiom: A self-evident truth)
Newton did explicitly present it as an axiom. In fact, it's Axiom III (or Law III) of his three fundamental laws of motion. Here's how he phrased it in the original Latin and in his own English translation:
"To every action there is always opposed an equal reaction: or the mutual actions of two bodies upon each other are always equal, and directed to contrary parts."
And what does this have to do with Medianlines / pitchforks?
This tool measures exactly that: the action — and the potential reaction!
Medianline traders know that pitchforks project the most probable direction that a market will follow. And that direction is based on the previous action, which triggered a reaction and thus initiated the path the market has taken so far.
…a little reciprocal, isn’t it? ;-)
So how does this fit into the chart?
The white pitchfork shows the most probable direction. It also outlines the extreme zones — the upper and lower median lines — and in the middle, the centerline, the equilibrium.
We see an “undershoot,” meaning a slightly exaggerated sell-off in relation to the lower extreme (the lower median line). And now, as of today, we’re seeing this overreaction mirrored exactly at the upper median line!
Question:
What happened after the lower “overshoot”?
New Question:
What do you think will happen now, after the market has overshot the upper median line?
100% guaranteed?
Nope!
But the probability is extremely high!
And that’s all we have when it comes to “predicting” in trading — probabilities.
Why? Because we can’t see the future, can we?
Gold?
Short!
Looking forward to constructive comments and input from you all

SHORT ON US30US30 Has given a change of character (choc) on the 4hr TF indicating the end of its uptrend pullback on its overall downtrend.
I will be selling US30 to the next level of demand looking to capture over 1000 points.

GBPAUDGBPAUD Potential Sell Idea, price fell down from the channel indicating Aggressive selling pressure, Currently Correction from the 50% Retracement of the fresh Sell Moove align with the Previous Keylevel, Indicating break & Retest Pattern

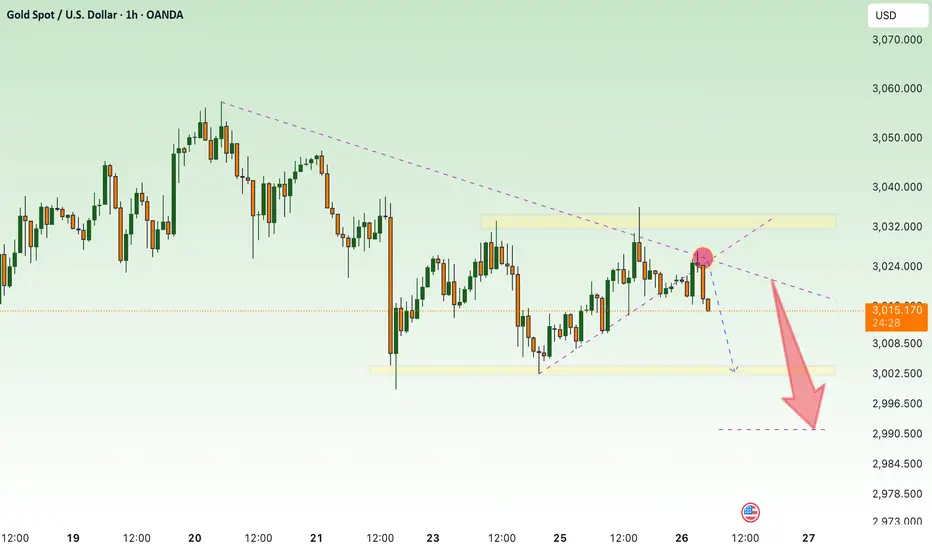
continue downtrend , GOLD⭐️GOLDEN INFORMATION:
Gold price (XAU/USD) holds steady above the key $3,000 level for the second consecutive day on Wednesday, though it struggles to reclaim the previous session’s peak. Ongoing uncertainty surrounding US President Donald Trump’s proposed reciprocal tariffs set for next week continues to bolster demand for the safe-haven metal. At the same time, the US Dollar (USD) remains under pressure following Tuesday’s weaker-than-expected macroeconomic data, providing additional support for gold’s upward momentum.
⭐️Personal comments NOVA:
Gold price continues to decrease, around 2990 - 3000
⭐️SET UP GOLD PRICE:
🔥SELL GOLD zone: $3039 - $3041 SL $3046
TP1: $3030
TP2: $3020
TP3: $3010
🔥BUY GOLD zone: $2992 - $2990 SL $2985
TP1: $3000
TP2: $3008
TP3: $3018
⭐️Technical analysis:
Based on technical indicators EMA 34, EMA89 and support resistance areas to set up a reasonable SELL order.
⭐️NOTE:
Note: Nova wishes traders to manage their capital well
- take the number of lots that match your capital
- Takeprofit equal to 4-6% of capital account
- Stoplose equal to 2-3% of capital account
XAUUSD sell signal* zone at 3039 - 3044.5
_SL: 30 pips above the entry zone (3048)_
* tp1 - 3031
* tp2 - 3027
* tp2 - 3021
* tp4 - open
*take entry with proper confirmation M15/M5/M1 📊*

AUD/JPY SELL IDEA (R:R=8.7)Selling AUD/JPY now. I have been waiting for this to close below the trend line. Overall direction is BEARISH according to Monthly timeframe.
Stop Loss is: 95.260
Please move SL to break even when trade is 70+ pips in profit.
1st Target: 93.500
2nd Target: 92.715
Happy Trading! :)

SHORT ON EUR/GBPPrice is currently pulling back from its over uptrend on this pair.
Just following the current downtrend structure looking to make 80-100 pips to the next demand zone or imbalance.

Tesla Update 2 Plan the trade and be PreparedUpdate on the Monthly chart with revised level which is worth noting on your charts and being prepared for . Enjoy the update and thanks for watching

SHORT ON GBP/AUDGBP/AUD has the same setup as EUR/AUD from my post yesterday.
I am selling GBP/AUD for the same exact reasons.
Looking to catch 600 pips long term but over 200 pips easily this week!

SHORT ON EUR/AUDEUR/AUD is currently at major resistance area.
It has given a nice change of character (choc) to the downside from being over brought for a long time.
I am selling EUR/AUD looking to catch over 500 pips as a swing trade.

Gold declines, accumulate and wait for April news⭐️GOLDEN INFORMATION:
Gold price (XAU/USD) continues its pullback, slipping toward $3,025 in early Asian trading on Monday. The metal retreats from Thursday’s record high, driven by renewed optimism over a potential Ukraine peace deal. However, expectations of Federal Reserve (Fed) rate cuts and lingering economic uncertainties could provide support, limiting further downside for the yellow metal.
⭐️Personal comments NOVA:
Gold is under pressure to sell and take profits in the short term. There is still a lot of liquidity in the 3000 price zone. The price will continue to accumulate around $3000.
⭐️SET UP GOLD PRICE:
🔥SELL GOLD zone: $3031 - $3033 SL $3038
TP1: $3020
TP2: $3010
TP3: $3000
🔥BUY GOLD zone: $2991 - $2993 SL $2986
TP1: $3000
TP2: $3008
TP3: $3017
⭐️Technical analysis:
Based on technical indicators EMA 34, EMA89 and support resistance areas to set up a reasonable SELL order.
⭐️NOTE:
Note: Nova wishes traders to manage their capital well
- take the number of lots that match your capital
- Takeprofit equal to 4-6% of capital account
- Stoplose equal to 2-3% of capital account

NZD/USD 4H Analysis – Smart Money Perspective🔍 NZD/USD – 4H Smart Money Concept Analysis by "Asif Brain Wave"
Key Zones Marked:
🔴 Weekly Fair Value Gap (FVG) and Order Block (OB) marked as strong resistance zones.
🟢 Two Bullish Order Blocks (+OB) highlighted below – potential areas for retracement or reaction.
🔵 +FVG (H4) near the Monthly Target, indicating a possible price magnet.
Market Structure & Expectation:
A clear CISD (Change in Structure Direction) indicates bearish market behavior.
The red path projection shows:
A potential short-term retracement into the upper OB area.
Followed by a sharp bearish drop toward the monthly target.
💘 Final target near 0.55154, marked with a heart symbol as a visual touch – representing your target zone with a personal flair.
Highlighted Price Levels:
High: 0.58305
Current Price: 0.57272
Projected Target (Low): 0.55154

AUD/USD– Bearish Momentum Unleashed!AUD/USD 🐨💵 – Bearish Momentum Unleashed! 🚨📉
Price rejected from Daily & H4 FVG zones 🔥
Pullback expected… then a potential drop toward 0.61872 💔
Weekly Bias = Bearish ✅
Eyes on liquidity grab below recent lows 👀💣
Are you ready for the move? 💼💸 #ForexTrading #AUDUSD #SmartMoneyConcepts #FVG #PriceAction #LiquidityHunt

Gold price start to adjust yet?⭐️GOLDEN INFORMATION:
Gold prices (XAU/USD) face renewed selling pressure during the Asian session on Friday, retreating toward the $3,030 level in recent trading, inching closer to the previous session’s low. The US Dollar (USD) maintains its upward trajectory for the third consecutive day, prompting some profit-taking on the precious metal ahead of the weekend. However, a confluence of supportive factors is likely to keep bullion resilient, positioning it for a third consecutive week of gains.
⭐️Personal comments NOVA:
Breaking the trend, has gold price really been in the weekend price adjustment rhythm? According to NOVA, it has started. Before the tax policies in early April, the market needs a little balance in terms of liquidity on the selling side.
⭐️SET UP GOLD PRICE:
🔥SELL GOLD zone: $3040 - $3042 SL $3047
TP1: $3030
TP2: $3020
TP3: $3010
🔥BUY GOLD zone: $3019 - $3017 SL $3014 scalping
TP1: $3023
TP2: $3030
TP3: $3040
🔥BUY GOLD zone: $3000 - $3002 SL $2995
TP1: $3010
TP2: $3020
TP3: $3030
⭐️Technical analysis:
Based on technical indicators EMA 34, EMA89 and support resistance areas to set up a reasonable SELL order.
⭐️NOTE:
Note: Nova wishes traders to manage their capital well
- take the number of lots that match your capital
- Takeprofit equal to 4-6% of capital account
- Stoplose equal to 2-3% of capital account

SMCI -- more weakness ahead near term!looking for additional sell sequences to fill gap targets at 33.7 and 31.5 levels as we approach tariffs being implemented on 4/2/25.
holding put options for 4/17 expiration
