SHORT ON CAD/JPYCAD/JPY is currently at a major resistance level/zone and has formed a minor double top just breaking the neckline on the lower timeframes.
I will be selling cad/jpy to the next major swing low for about 200 pips.
Sellsignal

Bitcoin’s Final Surge? One Month Before the Post-Halving Drop!Bitcoin Halving Cycles: What History Tells Us About 2025
The Bitcoin halving is a highly anticipated event that occurs approximately every four years, reducing the block reward by 50% ⛏️. This supply shock has historically been a major catalyst for price movements. By analyzing previous cycles, we can attempt to forecast what might happen in the upcoming halving cycle of 2025.
Historical Performance of Bitcoin Halving Cycles
First Halving (2012)
365 Days Before Halving: 📈 +385%
365 Days After Halving: 🚀 +8069%
Peak-to-Trough Decline After Peak: 🔻 -76.98%
Second Halving (2016)
365 Days Before Halving: 📈 +142%
365 Days After Halving: 🚀 +284%
Peak-to-Trough Decline After Peak: 🔻 -82.88%
Third Halving (2020)
365 Days Before Halving: 📈 +17%
365 Days After Halving: 🚀 +559%
Peak-to-Trough Decline After Peak: 🔻 -75.64%
Current Cycle and 2025 Halving Expectations
- Last Halving Date: 📅 April 15, 2024
- 365 Days Before Halving: Bitcoin gained 📈 +130% from $28,827 (April 2023) to around $65,000.
- Projected 365 Days After Halving (April 2025): If history rhymes, we could see a price increase of around 📊 +72%, with a potential closure at the current Peak of $110,000.
- Post-Peak Decline Estimate: Previous post-halving peaks saw declines of 📉 75%–82%. With Bitcoin's all-time high around $110,000, a 🔻 75% drawdown would target a bottom of ~$30,000 before the next recovery cycle.
Key Takeaways
Bitcoin's price tends to rally leading up to the halving, but the largest gains historically occur in the year following the halving. 📊
Post-bull run drawdowns are severe with past declines ranging from 🔻 -75% to -82%.
While the Pre and Post-Halving theory suggests that the decline starts around 365 days after the halving, the full bear market typically unfolds between ⏳ 486 to 510 days post-halving. This aligns with the ⛓️ 70,000-block mark post-halving, as Bitcoin halvings occur approximately every 210,000 blocks. This means that while the peak may occur within a year after the halving, the deep bearish phase historically becomes evident around 1.3 to 1.4 years after the halving, reinforcing the long-term cyclical nature of Bitcoin’s market trends 🔄.
Final Thoughts
Bitcoin halving events are pivotal moments in the crypto market cycle 🔥. The data suggests that 2025 could see significant gains, but we should also be prepared for the inevitable correction that follows 📉.
What are your thoughts on the upcoming cycle? Share your insights in the comments!
Disclaimer
This article is for informational and educational purposes only and does not constitute financial, investment, or trading advice. The historical performance of Bitcoin halving cycles does not guarantee future results, and past trends may not necessarily repeat. Cryptocurrency markets are highly volatile, and investing in Bitcoin or any other asset carries risks, including the potential loss of capital.
Readers should conduct their own research, assess their risk tolerance, and consult with a licensed financial advisor before making any investment decisions. The information provided is based on publicly available data and historical observations, which may be subject to change.
Sources:
Nakamoto, S. (2008). Bitcoin: A Peer-to-Peer Electronic Cash System.
Bitcoin block time and halving data: Blockchain.com
Historical Bitcoin price data: CoinMarketCap
Bitcoin halving cycles and trends: Messari
Market performance metrics: Glassnode
By reading this article, you acknowledge that you are solely responsible for your own financial decisions and that the author assumes no liability for any losses incurred from trading or investing. 🚀

wait and watch... if breakout below then go for short. It seems that USD MNX is on breakout. If it close below then go for short.

EURUSD gains bearish momentumAfter Trumpinho stated increasing he may increase wine taxes in case Canada do the same on whiskey. The financial turbulence is just winding up, as US PPI data appaered lower as previously expected. All EUR based pairs are turned down.

Bearish thesis for GOLD for the weekend XAU had been on a steady Bullish Run , Rightfully so.
if any asset deserves to appreciate in its price while doing the most amount of Good, its GOLD
But we traders , look for technical opportunities
that's where this trade idea comes in.
- Gold is pressuring its recent range with limited bullish strength
- also its its most popular cross - USD gaining substantial momentum the last 2 Quarters can make room for a correction before the trend continues to the upside.
therefore falling back on pure technical calculations leads us back to our excel sheets for daily range projections which put our range to be exactly 1.03% or 3034 /303* pips depending your brokerage metrics.
which leads me to make this 1:4 Trade idea for this week.
cheers.

Gold price recovers, waiting for CPI inflation data today⭐️Smart investment, Strong finance
⭐️GOLDEN INFORMATION:
The US 10-year Treasury yield rebounds, rising six basis points to 4.282% as markets focus on potential Federal Reserve rate cuts.
Meanwhile, US real yields—measured by the 10-year Treasury Inflation-Protected Securities (TIPS), which typically move inversely to gold prices—climb 5.5 basis points to 1.963%, posing a headwind for the non-yielding metal.
The Atlanta Fed’s GDP Now model projects a -2.4% contraction for Q1 2025, marking the first negative reading since the COVID-19 pandemic.
⭐️Personal comments NOVA:
Recovering in the sideway price range below 2930
⭐️SET UP GOLD PRICE:
🔥SELL GOLD zone: $2928 - $2930 SL $2935
TP1: $2920
TP2: $2910
TP3: $2900
🔥BUY GOLD zone: $2894 - $2896 SL $2889
TP1: $2900
TP2: $2910
TP3: $2920
⭐️Technical analysis:
Based on technical indicators EMA 34, EMA89 and support resistance areas to set up a reasonable SELL order.
⭐️NOTE:
Note: Nova wishes traders to manage their capital well
- take the number of lots that match your capital
- Takeprofit equal to 4-6% of capital account
- Stoplose equal to 2-3% of capital account

Bears dominate gold continues today⭐️Smart investment, Strong finance
⭐️GOLDEN INFORMATION:
Gold prices (XAU/USD) find support near the $2,880 level during Tuesday’s Asian session, drawing dip-buyers and partially recovering from the previous day’s drop to a one-week low.
Investor sentiment remains cautious amid uncertainty over US President Donald Trump’s trade policies and their potential impact on the global economy. The prevailing risk-off mood, compounded by geopolitical tensions, continues to fuel demand for the safe-haven metal
⭐️Personal comments NOVA:
US economy plummets, fears of recession due to rising trade tensions
⭐️SET UP GOLD PRICE:
🔥SELL GOLD zone: $2915 - $2917 SL $2922
TP1: $2910
TP2: $2900
TP3: $2890
🔥BUY GOLD zone: $2860 - $2862 SL $2855
TP1: $2870
TP2: $2880
TP3: $2890
⭐️Technical analysis:
Based on technical indicators EMA 34, EMA89 and support resistance areas to set up a reasonable SELL order.
⭐️NOTE:
Note: Nova wishes traders to manage their capital well
- take the number of lots that match your capital
- Takeprofit equal to 4-6% of capital account
- Stoplose equal to 2-3% of capital account
SHORT ON EUR/CHFEUR/CHF is currently at a major resistance level and his recently mitigated a FVG sitting in the same zone.
Price has been rising in what seems like forever on this pair, we finally have gotten our change of character (choc) to the downside with sweeps of liquidity and fvg's now balanced out.
I expect price to fall to the next demand level where plenty of liquidity sits.
I am selling EUR/CHF now looking to make over 200 pips to the downside.

GBP/USD SELL IDEA (R:R=5)Selling GBP/USD now. I placed a sell earlier at 1.29276 after seeing a wonderful BUTTERFLY form on the 30 min chart. Already starting to form lower highs and lower lows on smaller timeframes.
Stop Loss is: 1.29552
(Due to SL hunting)
Please move SL to break even when trade is 100+ pips in profit.
1st Target: 1.26730
2nd Target: 1.26072
3rd Target: 1.25680
Happy Trading! :)

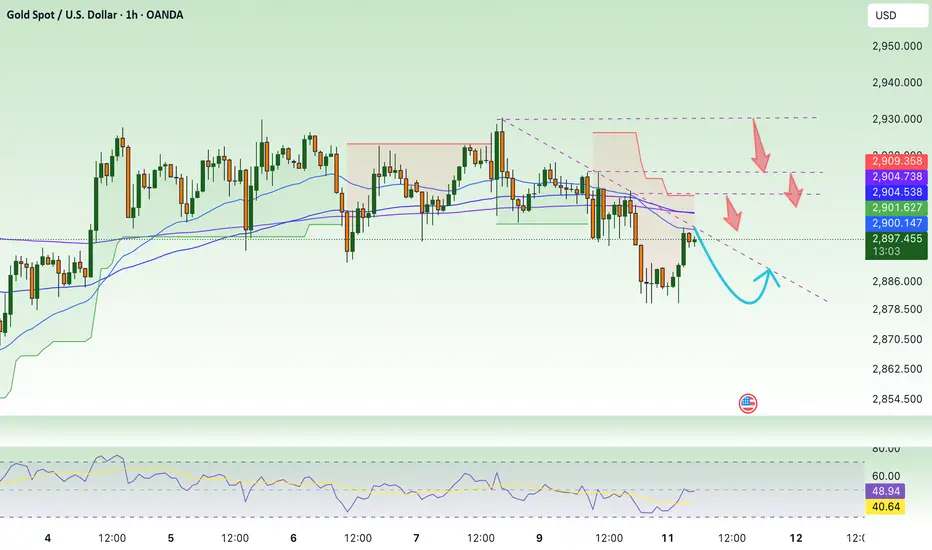
H1 bearish pattern appears , XAU / USD ⭐️Smart investment, Strong finance
⭐️GOLDEN INFORMATION:
The US labor market showed signs of slowing last month, reinforcing expectations that the Federal Reserve will proceed with multiple rate cuts this year. This sentiment pressured the US Dollar while boosting the price of USD-denominated commodities.
Data from the US Bureau of Labor Statistics (BLS) on Friday revealed that Nonfarm Payrolls (NFP) rose by 151,000 in February, following January’s upwardly revised 125,000 (previously 143,000), falling short of the 160,000 market forecast.
Meanwhile, the Unemployment Rate edged up to 4.1% from 4.0% in January, while annual wage inflation, measured by Average Hourly Earnings, ticked higher to 4.0% from 3.9%, though it was revised down from an initial 4.1%.
⭐️Personal comments NOVA:
Gold price is sideways around 2910 at the beginning of the week, H1 frame shows head and shoulders pattern, downtrend
⭐️SET UP GOLD PRICE:
🔥SELL GOLD zone: $2928 - $2930 SL $2935
TP1: $2920
TP2: $2910
TP3: $2900
🔥BUY GOLD zone: $2891 - $2893 SL $2886
TP1: $2900
TP2: $2910
TP3: $2920
⭐️Technical analysis:
Based on technical indicators EMA 34, EMA89 and support resistance areas to set up a reasonable SELL order.
⭐️NOTE:
Note: Nova wishes traders to manage their capital well
- take the number of lots that match your capital
- Takeprofit equal to 4-6% of capital account
- Stoplose equal to 2-3% of capital account

SHORT ON GBP/CADGBP/CAD is rejecting a key supply area on the 15min after continuing to make (Lower Highs) on the Higher Time Frames.
There has been a change in market structure from Up to down on the lower timeframe signaling a possible drop.
GBP/CAD is highly over brought and I believe its ready to fall.
I will be selling GBP/CAD to the next swing low for about 100-150 pips. OANDA:GBPCAD

USD/JPY SHORTSorry for the late one but this was a good trade and if you guys got involved that's a amamzing return.
Keep upto date by following my trades and stay tunes for more signals
This analysis is based on the provided image and should not be considered financial advice. Trading involves risks, and it is essential to conduct your own research and consult with a financial advisor before making any trading decisions.

GBP/JPY SELL IDEA (R:R=4.8)I just placed a sell order for GBP/JPY at 191.700. We have a wonderful X BAT that just formed on the 1 HOUR chart.
Please trade with proper risk management, since we have news announcements coming out at 8:15 AM EST today.
ADP Non-Farm Employment Change
Stop Loss: 192.368 (Daily High)
Take Profit: 188.450
Happy Trading!

SIDEWAY waiting for news this week⭐️Smart investment, Strong finance
⭐️GOLDEN INFORMATION:
As a result, investors turned to bullion for safety, driving prices toward the $2,900 mark. Meanwhile, the US 10-year Treasury yield dropped two basis points to 4.176%, its lowest level since December 2024.
Commenting on the economy, St. Louis Fed President Alberto Musalem acknowledged steady economic growth but cautioned that recent data indicate potential downside risks.
⭐️Personal comments NOVA:
Continue in correction phase - gold price under selling pressure below 2900. Sideway and waiting for important news this week
⭐️SET UP GOLD PRICE:
🔥 BUY GOLD zone: $2851 - $2853 SL $2846
TP1: $2860
TP2: $2870
TP3: $2880
🔥 SELL GOLD zone: $2898 - $2900 SL $2905
TP1: $2890
TP2: $2880
TP3: $2870
⭐️Technical analysis:
Based on technical indicators EMA 34, EMA89 and support resistance areas to set up a reasonable SELL order.
⭐️NOTE:
Note: Nova wishes traders to manage their capital well
- take the number of lots that match your capital
- Takeprofit equal to 4-6% of capital account
- Stoplose equal to 2-3% of capital account

Gold short term recovery - downtrend⭐️Smart investment, Strong finance
⭐️GOLDEN INFORMATION:
Gold prices (XAU/USD) start the week on a strong footing, rebounding further from Friday’s three-week low near $2,833–2,832. Despite US inflation data aligning with expectations, traders remain confident that the Federal Reserve will implement two quarter-point rate cuts by year-end. Additionally, renewed selling pressure on the US Dollar supports the appeal of the non-yielding yellow metal.
⭐️Personal comments NOVA:
Gold price recovers in short term, sellers are dominating, retesting liquidity zone 2883
⭐️SET UP GOLD PRICE:
🔥 BUY GOLD zone: $2832 - $2834 SL $2827
TP1: $2840
TP2: $2850
TP3: $2960
🔥 SELL GOLD zone: $2883 - $2885 SL $2890
TP1: $2875
TP2: $2868
TP3: $2860
⭐️Technical analysis:
Based on technical indicators EMA 34, EMA89 and support resistance areas to set up a reasonable SELL order.
⭐️NOTE:
Note: Nova wishes traders to manage their capital well
- take the number of lots that match your capital
- Takeprofit equal to 4-6% of capital account
- Stoplose equal to 2-3% of capital account

EUR/USD: Bearish Outlook – Targeting 1.03630 & Below 📊 Market Structure & Key Levels
EUR/USD is currently rejecting a key supply zone (1.0450 - 1.0480), showing strong signs of continued downside pressure. The pair is in a bearish trend, with price action confirming lower highs and lower lows, as seen in the Prime Market Terminal charts.
📉 Key Levels to Watch:
Supply Zone: 1.0450 - 1.0480 (Strong resistance & liquidity zone)
Demand Zone: 1.03630 - 1.03219 (Institutional liquidity target)
Extended Bearish Target: 1.02687 (Deep liquidity grab area)
🔍 Trade Setup: Bearish Bias Towards Key Support Levels
📌 Entry: Sell between 1.0450 - 1.0480
🎯 TP1: 1.03630 (Liquidity Zone)
🎯 TP2: 1.03219 (Institutional Liquidity Grab)
🎯 TP3: 1.02687 (Extended Downside Target)
❌ SL: 1.05150 (Above Key Resistance)
📉 Why This Trade? (Prime Market Terminal Analysis)
✔️ Bearish Market Structure – The 1D & 4H trend remains bearish, confirming a downward trajectory. Supertrend is bearish, and price is trading below the 72 EMA & 288 EMA, showing weak bullish momentum.
✔️ Liquidity Targets Identified – Market depth analysis from Prime Market Terminal reveals a lack of strong buy orders above 1.0450, suggesting that sellers dominate.
✔️ Volume Profile Analysis – The visible range (VPVR) highlights a high-volume node at 1.03630, making it a strong area for price to seek liquidity.
✔️ Commitment of Traders (COT) Data – Institutional positioning indicates an increase in short contracts for the EUR, aligning with the bearish trend.
✔️ Order Flow & Market Depth – Prime Market Terminal shows institutional sellers stacking sell orders at 1.0450, while liquidity pools rest below 1.03630 and 1.03219, making these ideal targets for price.
📰 High-Impact News to Watch
⚠️ HICP Flash Inflation Data (EUR - March 3, 2025) – Any deviation from expectations could drive EUR volatility.
⚠️ ISM Manufacturing PMI (USD - March 3, 2025) – A stronger-than-expected report could strengthen USD and drive EUR/USD lower.
⚠️ Fed's Musalem Speech (March 3, 2025) – A hawkish stance could accelerate EUR/USD downside pressure.
📌 Final Thoughts: Follow the Trend & Manage Risk!
EUR/USD remains firmly bearish, with liquidity resting below 1.03630. The confluence of institutional positioning, bearish trend confirmation, and market depth insights support a sell bias. Watch price action at key levels and manage your risk accordingly!
🔥 What’s your bias? Drop your thoughts in the comments! 🔥

CAKE Breakdown – Major Bearish Move Incoming?#CAKE has broken a critical support level after forming a Triangle Pattern on the 1-hour timeframe.
🔻 Key Observations:
✅ Triangle Breakdown – The price failed to sustain inside the pattern.
✅ Support Break – A major support level has been breached, confirming the bearish structure.
✅ Retest Zone – Price may retest the broken support before further decline.
🎯 Trading Plan:
🔹 Entry: Short at CMP or on a retest of support.
🔹 Target: Next support zone.
🔹 Stop-Loss: Above the retest level (tight risk management).
💡 What do you think? Will #CAKE continue its downtrend or surprise us with a reversal? Drop your thoughts in the comments! 👇👇
📊 Like & follow for more real-time market insights! 🚀🔥

SOL/USD SELLThis analysis is based on the provided image and should not be considered financial advice. Trading involves risks, and it is essential to conduct your own research and consult with a financial advisor before making any trading decisions.

Downward momentum, downtrend next week, XAU ✍️ NOVA hello everyone, Let's comment on gold price next week from 03/3/2025 - 03/07/2025
🔥 World situation:
US President Donald Trump confirmed that 25% tariffs on Mexican and Canadian goods will take effect next week on March 4. Meanwhile, the Fed’s preferred inflation gauge, the Core PCE Price Index, signaled continued progress toward the central bank’s 2% target.
Following the data, expectations for further Fed policy easing grew. According to Prime Market Terminal, the Fed is anticipated to cut rates by 70 basis points this year, with investors betting on the first reduction in June.
🔥 Identify:
Breaking the trend, gold continues to maintain a downtrend
🔥 Technically:
Based on the resistance and support areas of the gold price according to the H4 frame, NOVA identifies the important key areas as follows:
Resistance: $2876, $2903, $2956
Support : $2810, $2773
🔥 NOTE:
Note: Nova wishes traders to manage their capital well
- take the number of lots that match your capital
- Takeprofit equal to 4-6% of capital account
- Stoplose equal to 2-3% of capital account
- The winner is the one who sticks with the market the longest

EURUSD Potential Short Setup - 1HR Swing TradeThis trading idea proposes a short position in EURUSD on the 1-hour timeframe, based on the expectation of a continued downward move. The entry point is strategically located at a resistance level, with a stop-loss order to manage risk and a take-profit target set at a potential support zone.
Disclaimer :
This analysis is based on the provided image and should not be considered financial advice. Trading involves risks, and it is essential to conduct your own research and consult with a financial advisor before making any trading decisions.

SELL TRADE IDEASell the currency pair.. continuation sell set up...the pair has been in a uptrend but without a clear opportunity. But a selling opportunity has arises in a form of a breakout.

trend towards 2845, trend continues to strengthen! gold ⭐️ Smart investment, Strong finance
⭐️ GOLDEN INFORMATION:
Gold price (XAU/USD) declines for the second consecutive day, hitting a two-week low around $2,860 during Friday's Asian session. The US Dollar (USD) continues its recovery for the third straight day, supported by expectations that the Federal Reserve (Fed) will maintain its hawkish stance due to persistent inflation. This strengthens the USD and weighs on the non-yielding gold.
⭐️ Personal comments NOVA:
The gold price adjustment is mandatory, along with the influence of the world financial sectors, selling off at the same time. The trade war is very close, gold is also negatively affected by investors.
⭐️ SET UP GOLD PRICE:
🔥 SELL GOLD zone: $2891 - $2893 SL $2898
TP1: $2885
TP2: $2878
TP3: $2870
🔥 BUY GOLD zone: $2846 - $2844 SL $2839
TP1: $2852
TP2: $2860
TP3: $2870
⭐️ Technical analysis:
Based on technical indicators EMA 34, EMA89 and support resistance areas to set up a reasonable SELL order.
⭐️ NOTE :
Note: Nova wishes traders to manage their capital well
- take the number of lots that match your capital
- Takeprofit equal to 4-6% of capital account
- Stoplose equal to 2-3% of capital account

Shorting the S&P at 6000We previously picked the turning point of the S&P at the all time high.
We now expect this to continue with the downtrend as it approaches the strong 6000 resistance.
1) There is pattern
2) H4 and D1 are down
3) M15 is overbought, awaiting divergence
We target the low of 5915 which will give a 1:2.5 R:R
