EURUSD-Weekly Market Analysis-Nov19,Wk1Having a mixed sentiment on EURUSD across all 3 timeframe traders will have to be careful and precise with their analysis.
I'm waiting for a retracement on the 1-hourly chart for a selling opportunity and extend my final target to 4-hourly bullish bat completion.
Upon the confirmation of the bat, I will have an extended target to the bearish shark on the daily chart.
Sellzone

NZDUSD TRADE IDEAS I SEE A SMALL BULLISH TREND .. AND THEN WE WAIT FOR THE SELL ZONE.. OR MAYBE A BREAKOUT FOR MORE BULLS ACTION

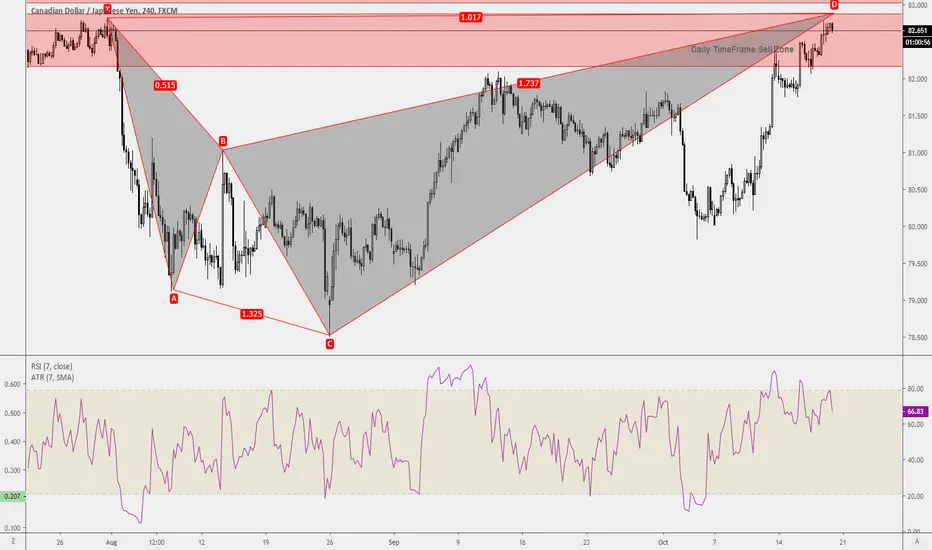
Trade Ideas Position: CADJPY SharkA great reward:risk for this shark pattern even for the 1st target. Pending order will be set as there is also a rising wedge with rsi divergence.
Based on the candle movement in this timeframe, it looks more like a sideways pattern.
EURAUD BREAK KEY LEVEL EURAUD in running in major down trend , retracement up trend already broken
Important key level broken @ 1.6260
volume profile show HVN at the same level , which is very strong area
MACD show sell signal

GBPUSD-Weekly Market Analysis-Oct19,Wk4A bearish butterfly forms a selling opportunity, thought its too early as the earliest it should happen is on 24Oct2019, but I do believe a massive drop may occur when market open as UK doesn't have a consensus on the Brexit deal and it got further delayed till 31Jan2020.

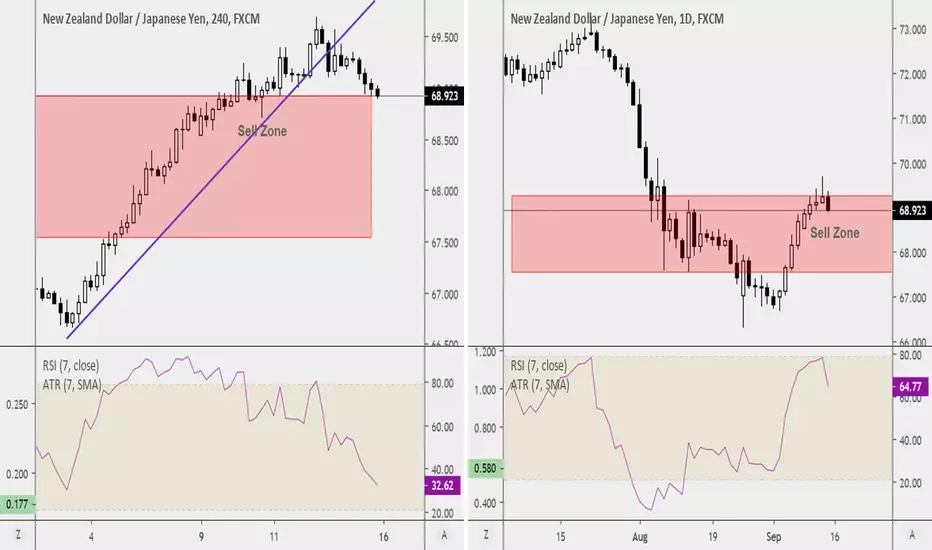
Trade Ideas Position: NZDJPY SharkWell this setup is interesting, it has a bearish shark setup and the light red box you see is not the PRZ of shark, that is the equal distant move indicated by the blue line. A way that I trade.
So the estimation of completion of the blue line and shark completion is closed so I've decided to box it up and observe the movement, the candle close before I engage the trade.
The real ABCD Pattern completes at the much higher price which still falls into the valid setup of the shark pattern. Yes! Shark Pattern is a crafty 1, if one is not ready to tame the beast, shouldn't trade shark.


Trade Ideas Educator: NZDUSD TrendlineFOCUS!! Let's dissect this chart 1 by 1 like how we did our oral exam when we were much younger. :P
At a bigger picture, I have spotted a bearish shark pattern, noted on that as a potential reversal zone and I want to get involved with that but is too early to say.
Situation Awareness: Right now the market is in the sell zone until it breaks and closes above the sell zone(light red box) it still have some level of risk in this setup.
Trendline is 1 of my important filters because Structure is KEY!!! I will want to wait for a retest back into the trendline and look for a buying opportunity.
Students will understand how I use trendline.

GBPUSD-Weekly Market Analysis-Oct19,Wk3Nothing much for me to look for on the smaller timeframe, for countertrend trader you may have to wait for a retracement on the smaller timeframe for a buying opportunity.
On the daily chart, a bearish butterfly pattern forming up within the sell zone. I'm definitely interested to see the development of this setup and might just participate in it.

S&P 500Buy zone in 2969 - 2960 for intraday oportunitys, im not here for 1 or 2 points. 8-10 points can be done in a day if you trade raw price action and good zones, i dont use indicators, they confuse me. P.A is always the answer for the market you are gonna trade. Right now im taking a funding challenge for some extra money. lets show that we can do it.

GBPUSD-Weekly Market Analysis-Sep19,Wk4A bearish shark completes at 1.2528 and right now having an RSI Divergence on this trade within the Sell Zone.
Is this the setup for you?

Trade Ideas Educator: GBPAUD ButterflyA trend trading opportunity setup once again on GBPAUD chart. The bearish Gartley has already in a valid state for a selling opportunity but I'm just not comfortable for such a strong bullish candle close before market close on Saturday. I would need more confirmation for this.
This trade decision will definitely be an epic 1 for me as it either is a great call for the "Great Escape" and walk out of the market unscathed or it will be the greatest miss in trading of my life.
Alternatively, I can always wait for the bearish Butterfly Pattern setup at a much higher price with a better reward:risk.
What's your call? Comment down below.

Trade Ideas Position: CADJPY CrabA bearish deep crab setup for a trend trading opportunity on the daily timeframe.
Having this countertrend setup on the 4-hourly timeframe does stage a great trend trading opportunity for the higher timeframe.

Trade Ideas Educator: GBPJPY BatA bearish bat setup for a trend trading trade, not quite sure at this moment if you would love to short it right away when market open or wait for further confirmation(that's more for me) as I have spotted all GBP related pair has a relatively strong bullish candle before market closes on Saturday(Singapore Time).
More read up on Brexit related topic on Bloomberg and make your decision o just simply wait for further confirmation or simply stay out of the trade.
Do note that pt C touches pt A too, typically not my favourite set and forget trade.

Trade Ideas Educator: NZDJPY TrendlinesOn the daily chart, is a nice bearish engulfing after a magic candle(indecision candle) for a selling opportunity and it closes within the sell zone(pink box).
Although on the 4-hourly chart(left) the candle break and close below the trendline, it still rested above the sell zone box show insufficient weakness on the market.
Having this conflicting market signal, you can:
1) choose not to engage the trade
2) wait for further confirmation ie:
i) close and break below the sell zone then engage
ii) a retracement after a strong bearish engulfing the short
iii) a bearish harmonic pattern to engage for a shorting opportunity.
The choice is yours.
Trade Ideas Educator: NZDJPY TrendlinesYes, both trendlines are pointed at different directions but you can see how similar it can be based on my analysis.
First, we have to register the fact that the trend on the 4-hourly chart is still bearish and the market is within the sell zone. I am waiting for a shorting opportunity.
So a bearish engulfing might just set up well for me to engage a short trade. If that didn't happen, I would just need a break and close below the bullish trendline on the left, a break and close below the trendline will set off a short position.

EURUSD-Weekly Market Analysis-Sep19,Wk2Within the double sell zone, forms a bearish deep Gartley and its only valid if Pt C touches 1.1006. Harmonic Patterns there are minimum 8 rules to it and an extension to 15rules if you are very conservative traders that will increase your winning rate but affect your profits as some of the trades you may miss.
Or you can simply wait to engage a short within the sell zone.


Trade Ideas Position: AUDUSD SharkA bearish shark setup as a shorting opportunity. The trade is now live with better entry price opportunity and a fantastic Reward:Risk.
Trade is engaged as a countertrend trade with an RSI Divergence within the sell zone.


Trade Ideas Educator: NZDUSD SharkRight now the market is on a downtrend channel as a trend trading setup, if the channel holds it produces another shorting opportunity.
However, if it fails, a bearish shark appears within the sell zone for a trend trading opportunity.

Trade Ideas Educator: AUDCAD SharkA bearish shark on the 1-hourly chart will be the 1st level of resistance for a shorting opportunity.
On the 4-hourly chart a bearish bat setup for another trend trading opportunity. Let's see how the market reverse and head towards the trading opportunity.
If all do well, the bearish shark should hit by Wednesday this week.
