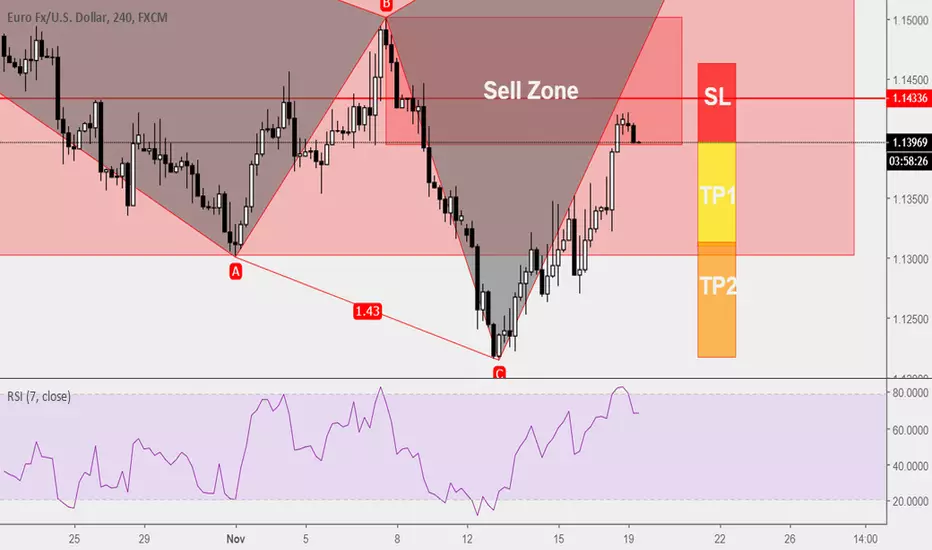
Trade Ideas Position: EURUSD SharkBearish Shark Formation, shorted this pair and will be sharing the stops and targets to my subscribers.
Like our facebook page to be informed of the next facebook live event.
www.facebook.com
Sellzone

USDCAD Sell IdeaH1 - Price is moving inside a channel.
If the price move higher, breaks above the top of this channel and reaches the possible sell zone shown in the chart, we may then start looking for sells with bearish evidences.

USDJPY-Weekly Market Analysis-Feb19,Wk1Waiting for market hit back into the Daily and 4-hourly sell zone to wait for a short opportunity.
Proud of my student who spotted the bear bat by himself in just a 1-day course. So it is possible.
On M15 Pt A might be a good opportunity for me to head in for a buying opportunity.
Will be sharing with my subscribers should this trade is valid.

GBPAUD - SELL Primary Target - 1.79900GBPAUD - SELL
Primary Target - 1.79900
Secondary Target - 1.73900
Thirdary Target - 1.70100
Stop Loss: 1.87500
Signals:
1) Completed Gartley Pattern (H4).
2) RSI Ovesold Market Condition (D1).
3) Price is bounced a strong SELL ZONE.
4) H&S Pattern (H1)

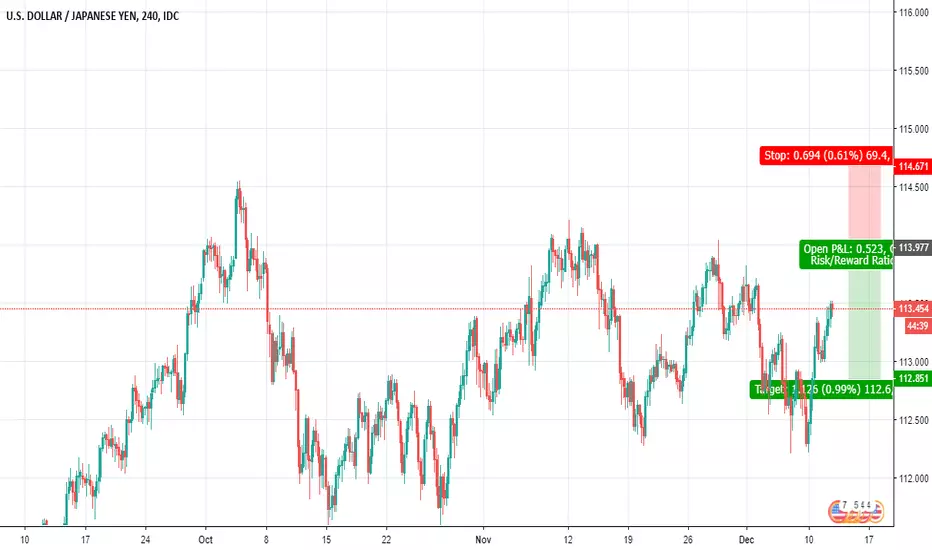
Trade Ideas Position : USDJPY GartleyBearish Gartley on double sell zone, and falls on resistance,
A great reward:risk trade for me, for those who have joined our facebook live, good on you, you might have seen my rationale on the trade.
If you have not like our facebook page please do:
www.facebook.com
If you like to receive our entry, stops end targets just subscribe to us, have a look on our amazing Oct18 results:
forex100academy.com

USDJPY-Weekly Market Analysis-Jan19,Wk3Market has to break above and close above the high on 1-hourly chart, then I will be looking for shorting opportunity at 108.91.
Having an ABCD formation that inline within the double top structure, further strengthen the potential downwards movement.
If you don't wish to miss any great trading ideas, just subscribe to us and join us in our inner-circle.
Have a look on our October 2018 results that we shared a total of 2,333pips of Net Profit in a single month. If not now, when?
forex100academy.com

Trade Ideas Position: EURUSD GartleyOn this daily chart, the Bearish Gartley has form but I've developed another trade ideas on this.
Will be sharing this with my subscribers if you like to join us in our fun loving community, feel free to check out our website on October Results, where we hit a total of 2,333pips of net profits:
forex100academy.com

GBPUSD-Weekly Market Analysis-Jan19,Wk2GBPUSD still on its bearish tone but do note that recent Bullish candle is pretty aggressive.
2 Trade Ideas I've developed under Trade Ideas Analysis Program
1) Waiting for the pull back on 1-Hourly Chart and head up for a Trend Trading base on 1-Hourly Chart.
2) Within the Sell Zone and extension of the Market movement on H1 Chart, I will head in for a shorting opportunity as a Trend Trading on 4-Hourly Chart.
Subscribe to us on our Trade Ideas Package so you won't miss another Great Trade Ideas.
In the month of Oct 2018, we have achieve a total of 2,333pips of net profits.
Check this out:
forex100academy.com
This Wednesday, 9 Jan 7pm-9pm(+8GMT) we are going to do a live analysis on 12 currency pairs in 3 timeframe, like our facebook page so you won't miss the live session:
www.facebook.com

USDJPY-Weekly Market Analysis-Jan19,Wk2On the Daily Chart , market breaks the sideways consolidation and break towards the downside.
With the Wed 2 Jan Asian Market Flash Crash, the market touches the Major Support on the weekly chart and provide a potential selling opportunity on the 1-hourly Potential Sell Zone.
I need more confirmation to look for potential selling opportunity, just subscribe to us so you won't miss out.
Some say out Trade Ideas Results in Oct 2018 is equivalent to most youtube traders 1 year net profit results.
Well, I don't know about if 2,333pips of net profits in the month of Oct is good enough for my subscribers but their continuous support may just show that they are happy.
forex100academy.com
Seeing is believing, we are going LIVE on Facebook this Wednesday, 9 Jan 2019, 7pm-9pm(+8GMT), just follow us on Facebook to receive the online notification:
www.facebook.com

Trade Ideas Position: EURUSD SharkShark Pattern on H1 chart(Left) within the sell zone of its higher timeframe, H4(right).
Pending Order Place as it give great RewardLRisk and its within the sell zone which is also the trending trend.
Exact Stops and Targets share to my subscribers, if you do not want to miss another great trade ideas, just subscribe to us.
In the month of Oct 2018, we share a total of 2,333pips of net profits to our subscribers.
Check this out and we are pleased to share that we are happy to extend the promotion for you.
forex100academy.com

EURUSD-Weekly Market Analysis-Jan19,Wk1EURUSD on the Daily chart it is still on its bearish tone and in the 4-hourly chart having the D completion just right at the sell zone gives me a perfect opportunity to short the market.
So just we thought that the last 2 week of December is a quiet period where market hibernate, this December is definitely 1 of the most active market in the past 14years.
forex100academy.com

Trade Ideas Analysis: USDJPY ABCDA double trading opportunity presents itself. ABCD is usually a counter trend trade, hence, not ignoring that, if the market presents a double bottom, I will head in for a long opportunity.
However, when the market head back to the sell zone and if it ends at the blue arrow ends, I may engage as an shorting opportunity.
Is amazing for developing 2 trade strategy within 1 setup, isn't it?
If you don't want to miss another great opportunity, just subscribe to us on Trade Ideas.
Did I not mention that in the month of October 2018, we have produced a total of 2,333pips trade ideas, 1 that look like this in advance of the movement and share it with our subscribers.
In order not to miss another great trading ideas again, just subscribe to us at the link below:
forex100academy.com

EURUSD-Weekly Market Analysis-Dec18,Wk3EURUSD is still on its bearish move. I'm waiting for the retest back into the sell zone for a shorting opportunity.
And of course, with Wayne's analysis, it is possible to look for a buying opportunity at D completion as a counter trend trade.
To Receive the Weekly Market Analysis, Subscribe to our YouTube Channel & Click the BELL Notification to receive alert once we have posted a video that might interest you:
www.youtube.com

Trade Ideas Position: GBPUSD SharkLooking to short GBPUSD on this Shark formation as it head back up to the sell zone.
Exact Entry, Stops and Targets share to my subscribers.
In order not to miss another great trading ideas again, just subscribe to us at the link below:
forex100academy.com


EURUSD opportunitySell zone holds and shows sellers coming in. With Brexit and renewed trade tensions with China, HUAWEI scandal, expected risk off mood to strengthen the dollar. Unless Brexit miracle happens...

EURUSD-Weekly Market Analysis-Dec18,Wk2EURUSD on daily chart shows a bearish movement. On 4-hourly chart it is a sideway consolidation.
The red zone is within the sell zone, within the sell zone sit a deep gartley setup, if the market touches Point D and close below the upper trendline will give a perfect shorting opportunity.
The trendline shows a sideway consolidation, breaking out of the trend line is inevitable, but the direction of the break will show a likelihood of market direction.

AUDCAD / SHORT OPPORTUNITY / D1AUDCAD
Trading Bias: Short
Technical Strategy: Harmonic Crab + Daily Resistance Level
*Wait for price to reach sell zone. You may enter either at the completion of the crab or once we reach the sell zone look for a trigger on lower timeframe*

GBPUSD-Weekly Market Analysis-Nov18,Wk5UK Pound still on its bearish run, we have took extended target on this Bearish Bat Pattern and we are glad we did.
Target 2 hit a total of 107pips profit.
As for counter trend trader, do note on the black line that seems to be a strong support, if it is broken, it may extend lower. As for me, I would need additional confirmation before engage on this counter trend trade.
To Receive the Weekly Market Analysis, Subscribe to our YouTube Channel & Click the BELL Notification to receive alert once we have posted a video that might interest you:
www.youtube.com

EURUSD-Weekly Market Analysis-Nov18,Wk5Overall market direction for EURUSD is still on its bearish tone. However, at the Pt D Completion of the Bullish Bat Pattern(red) does provide a great counter trend trade opportunity.
Will be taking conservative targets should the bat pattern still valid upond touching D Completion.
To Receive the Weekly Market Analysis, Subscribe to our YouTube Channel & Click the BELL Notification to receive alert once we have posted a video that might interest you:
www.youtube.com

EURUSD-Weekly Market Analysis-Nov18,Wk5Still waiting for market to hit Point D for a shorting opportunity.
Do note that, there might be a bullish bat pattern lurking into this setup.
I will be sharing the trading opportunity with my subscriber.
Subscribe to our inner circle for only $200, last month our trade ideas produced a total of 2,333pips of net profit in a single month.
Don't miss that again, link below.
forex100academy.com

Trade Ideas Analysis: EURUSD Support and ResistanceA trend trading trade with great reward:risk ratio.
Exact entry, stop and targets shared with my inner-circle.