AMD: Potential Mid-Term Reversal from Macro SupportPrice has reached ideal macro support zone: 90-70 within proper proportion and structure for at least a first wave correction to be finished.
Weekly
As long as price is holding above this week lows, odds to me are moving towards continuation of the uptrend in coming weeks (and even years).
1h timeframe:
Thank you for attention and best of luck to your trading!
Semiconductors

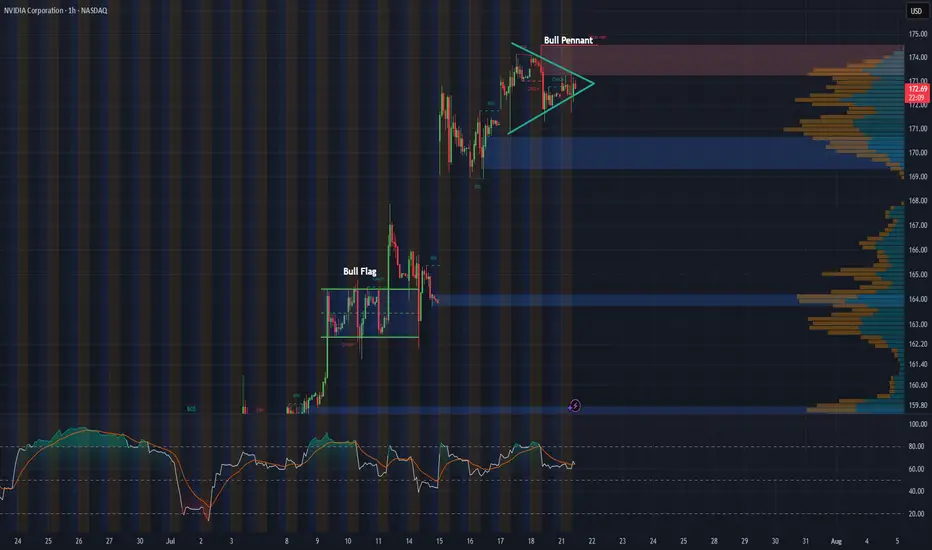
NVDA 1-Hour Chart UpdateHey everyone, just wanted to share a quick update on NVDA’s 1-hour chart. Following last week’s bull flag breakout, the stock appears to be consolidating into what looks like a solid bull pennant formation.
With major tech earnings on the horizon and the recent approval to sell H20 chips to China, this pattern could be setting the stage for another breakout. Will NVDA continue its impressive rally, or is this just a breather before the next move?
NVIDIA -- Major Resistance // Confluence of 3 FactorsHello Traders!
WOW... This chart is quite incredible I must say.
It's amazing how price is currently at an exact point where 2 major trendlines converge which also nearly coincides with the 1.618 Fibonacci extension. Price closed almost to the penny just above the major trendline connecting the prior highs. It will be very interesting to see what price does over the next few days.
What Does These Converging Trendlines Mean?: Think of a trendline like a wall... Depending on how "strong" the trendline is, this wall could be made from wood all the way through to vibranium straight from Captain Americas shield! These two trendlines converging would likely resemble a steel wall and would be extremely hard to penetrate. (Although there are no gurantees in trading)
What To Watch For: I will be watching to see if price can both break and confirm above both resistance trendlines. It will take MEGA buying pressure to accomplish this and would likely mean continuation to the upside. If price cannot break and confirm above then we will likely see a large retrace to support.
Thanks everyone and best of luck on your trading journeys!

Advanced Micro Devices | AMD | Long at $126.00Advanced Micro Devices NASDAQ:AMD may be the sleeping giant in the semiconductor / AI space. While all eyes on NVidia NASDAQ:NVDA , earnings for NASDAQ:AMD grew by 800% over the past year... and are now forecast to grow 40% per year. Any other company would be soaring right now (like NVidia), but that company is getting all the attention. And, to me, this means opportunity for the future. The cashflow is likely to grow tremendously for
NASDAQ:AMD into 2027 and beyond, which may inevitably reward investors with dividends.
From a technical analysis perspective, NASDAQ:AMD just entered my historical simple moving average zone. This area (currently $108-$126) is where I will be gathering shares. Something tremendous would have to change regarding the fundamentals of this company (like a scandal) for the overall thesis to change. There may be some near-term price pains as NVidia gets all the focus, but to meet demand in the semiconductor and AI space, NASDAQ:AMD is poised to fulfill that roll in the future.
Target #1 = $158.00
Target #2 = $175.00
Target #3 = $188.00
Target #4 = $205.00

Applied Materials | AMAT | Long at $169.75Republican Ashley Moody recently dropped $200k-$500k on Applied Materials $NASDAQ:AMAT. The semiconductor boom may not be over...
Price-to-earnings: 21.68x (great in comparison to others...)
Debt-to-equity: 0.34x (low)
Cash flow: $10.4 billion (FY2024)
Insiders awarded options recently
Unless NASDAQ:NVDA brings the market down, NASDAQ:AMAT is in a personal buy zone at $169.75. While the price may dip in the near-term to the $140s, bullish until the semi boom dies...
Targets:
$195.00
$215.00
$240.00

SMCI buy cycle in progress into yr endStrong buy rates on order flow indicating buy-side targets as follows
tp1 = 88
tp2 = 96
tp3 = 105
...by end of 2025
Still expecting strong sell wave sometime by mid-2026 all the way back to 20's as the semiconductor space continues dealing with growing bearish forces. Recent weakness should be seen as "shots across the bow" or warning shots. Next set of highs will be opportunities to EXIT and go short imo.

Semis ready to rip to price discoveryAMEX:SOXL NASDAQ:SMH
Semiconductors just waiting for the tarrif announcements to pass to blast off to all time highs

$NVDA: Levitating higher: Next Stop 175$: 250$ Before cycle endsIn this summer bull market, it makes more sense to talk about the large cap winners. NASDAQ:NVDA chart is a beauty to watch with the steady climb of this mega cap stock levitates all the indices including S&P500 and NASDAQ. After hitting 90$ during the Liberation Day drawdown the stock is 60% up since then and recovered all its losses and hitting a new ATH. With stock at 158 $ it is targeting the highs of the upward sloping Fib Retracement channel which indicates that stock can reach a price of 175$ before this run loses its steam. At RSI of 65 this is not overbought compared to its historical level of 84. Hence there might be more room left in this bull run for $NVDA. My prediction is that before end of July 2025 the stock hits 175$.
But where do we like to see this outperforming stock during this cycle of bull run. Will it hit 5T USD before Dec 2024? If NASDAQ:NVDA hits 5T USD, then the stock will be 205 $ which in my opinion not impossible before Dec 2025. 40% Upside in the Market Cap and the stock price is achievable in a momentum stock like $NVDA.
Verdict: NASDAQ:NVDA @ 175 $ before July 2025 & 205 $ or 5 T USD Market Cap before Dec 2025

INTC getting ready to start it's upward trajectoryINTC has been ranging and coiling since July of 2024. It finally, is starting to look like bullish movement is about to break upwards.
As you can see, INTC has just broken the downward trend line as well as the triangle pattern. A break and hold above $24.40 would indicate the start of a new uptrend in the chart.
Indications that the stock is gaining bullish momentum on the weekly chart:
The Williams %R is approaching and getting ready to break the 50 line.
The MACD is bullish and approaching the zero line.
The stock has bounced off of the volume shelf on the AVP 4 times and is now breaking out of technical patterns.
Money flow on market cipher B has crossed over green.
EMA's are starting to turn upward to flip bullish.
The marked move on this triangle pattern is approximately $40.
From a fundamental standpoint, Intel is trying to fix the business on two tracks at one time:
1)Near-term – ship competitive AI-centric products now (CPUs, GPUs, Gaudi accelerators) to put revenue and margins back on a growth path.
2) Long-term – reinvent itself as a contract chip-maker (Intel Foundry) so it can win outside customers and leverage its huge fab investments.
Think of it as “sell more chips today, sell more manufacturing tomorrow.”
Let's see Intel can build enough momentum to break this range for the bigger move up. The table is set from a technical standpoint.
Not financial advice. Do your own research.

Is AMD Poised to Redefine the Future of AI and Computing?Advanced Micro Devices (AMD) is rapidly transforming its market position, recently converting a Wall Street skeptic, Melius Research, into a bullish advocate. Analyst Ben Reitzes upgraded AMD stock to "buy" from "hold," significantly raising the price target to \$175 from \$110, citing the company's substantial progress in artificial intelligence (AI) chips and computing systems. This optimistic outlook is fueled by a confluence of factors, including surging demand from hyperscale cloud providers and sovereign entities, alongside colossal revenue opportunities in AI inferencing workloads. Another upgrade from CFRA to "strong buy" further underscores this shifting perception, highlighting AMD's new product launches and an expanding customer base, including key players like Oracle and OpenAI, for its accelerator technology and the maturing ROCm software stack.
AMD's advancements in the AI accelerator market are particularly noteworthy. The company's MI300 series, including the MI300X with its industry-leading 192GB HBM3 memory, and the newly unveiled MI350 series, are designed to deliver significant price and performance advantages over rivals like Nvidia's H100. At its "Advancing AI 2025" event on June 12, AMD not only showcased the MI350's potential for up to 38x improvement in energy efficiency for AI training but also previewed "Helios" full-rack AI systems. These comprehensive, plug-and-play solutions, leveraging future MI400 series GPUs and Zen 6-based EPYC "Venice" CPUs, position AMD to directly compete for the lucrative business of hyperscale operators. As AI inference workloads are projected to consume 58% of AI budgets, AMD's focus on efficient, scalable AI platforms puts it in a prime position to capture a growing share of the rapidly expanding AI data center market.
Beyond AI, AMD is pushing the boundaries of traditional computing with its upcoming Zen 6 Ryzen CPUs, reportedly targeting "insane" clock speeds, well above 6 GHz, with some leaks suggesting peaks of 6.4-6.5 GHz. Built on TSMC's advanced 2nm lithography node, the Zen 6 architecture, developed by the same team behind the successful Zen 4, promises significant architectural improvements and a substantial increase in performance per clock. While these are leaked targets, the combination of AMD's proven design capabilities and TSMC's cutting-edge process technology makes these ambitious clock speeds appear highly achievable. This aggressive strategy aims to deliver compelling performance gains for PC enthusiasts and enterprise users, further solidifying AMD's competitive stance against Intel's forthcoming Nova Lake CPUs, which are also expected around 2026 and feature a modular design and up to 52 cores.

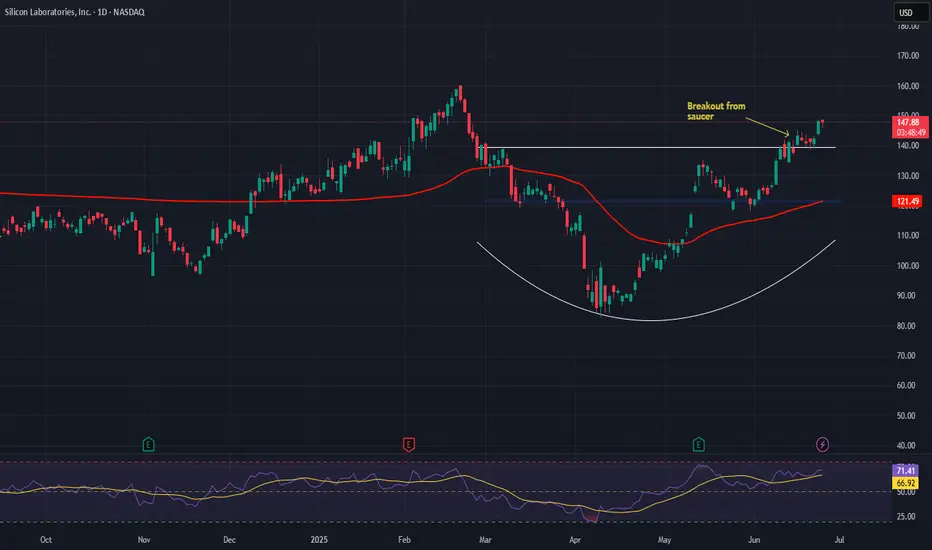
Silicon (SLAB)–Leading the Charge in Next-Gen IoT InfrastructureCompany Overview:
Silicon NASDAQ:SLAB Laboratories is a top-tier fabless semiconductor firm, specializing in low-power mixed-signal ICs and connectivity software for IoT, industrial, automotive, and consumer applications. With deep OEM integration, it’s a pivotal player in the connected devices ecosystem.
Key Catalysts:
Long-Term Growth Strategy 🚀
Management is targeting 20%+ long-term revenue growth, outpacing the broader IoT sector (mid-teens CAGR).
Fueled by megatrends in smart cities, connected health, and industrial automation.
$10B+ in Design Wins 🔧
Over $10 billion in cumulative design wins across Bluetooth, Zigbee, Thread, Z-Wave, and Wi-Fi platforms.
These wins translate to $2–2.5B in annualized revenue potential, reinforcing deep OEM trust and product stickiness.
Next-Gen Series 3 SoCs 💡
Built on 22nm technology, delivering up to 100x more compute power.
Enhanced security and AI/ML-ready, enabling real-time edge intelligence across smart meters, wearables, and industrial sensors.
Investment Outlook:
Bullish Case: We are bullish on SLAB above $121.00–$122.00.
Upside Target: $200.00–$210.00, driven by design momentum, IoT innovation leadership, and expanding addressable market.
🧠 SLAB is not just riding the IoT wave—it’s helping build the surfboard.
#SiliconLabs #SLAB #IoT #Semiconductors #SmartDevices #AIatTheEdge #Bluetooth #Zigbee #Thread #WirelessTech #IndustrialAutomation #Bullish #ConnectedFuture
Bullish Thesis: Why AMD Stock Could Soar by Year-End 2025If you haven`t bought AMD before the previous rally:
What to consider now:
1. AI Tailwinds Are Accelerating
AMD is finally gaining serious traction in the AI GPU race. Its MI300X accelerator chips are being adopted by big names like Microsoft, Meta, and Oracle for data center AI workloads. While NVIDIA is still dominant, AMD is expected to grab 10–20% of the AI GPU market share by 2025, according to industry estimates. That’s a multibillion-dollar opportunity.
The MI300X already passed $1B in revenue within its first quarters.
AI server TAM (total addressable market) is expected to grow to $400B by 2027 — AMD is positioning itself aggressively to carve out its slice.
2. Valuation Looks Reasonable vs Peers
AMD trades at a forward P/E around 40, significantly below Nvidia (which trades over 60x) despite similar growth projections for the next 2 years.
Revenue expected to grow over 15–20% YoY in 2025.
Gross margins expanding as high-performance chips dominate the mix.
3. Diversified Growth: Beyond AI
Gaming segment (PlayStation 5 and Xbox Series X chips) remains strong.
Embedded segment from Xilinx acquisition continues to generate solid cash flow.
Client CPU business is rebounding as the PC market stabilizes.
4. Strong Management and Execution
CEO Lisa Su is widely respected for turning AMD around and guiding the company through major innovations and acquisitions (Xilinx, Pensando). Execution has remained consistent, especially in delivering cutting-edge performance-per-watt chips.
Disclosure: I am part of Trade Nation's Influencer program and receive a monthly fee for using their TradingView charts in my analysis.

SOXL 1D — With a base like this, the ride’s worth itOn the daily chart of SOXL, since early March, a textbook inverse head and shoulders pattern has formed and is now in its activation phase. The left shoulder sits at $16.67, the head at $7.21, and the right shoulder at $15.11. The symmetry is classic, with volume stabilization and a narrowing range — all the elements are in place.
The key moment was the breakout through the descending daily trendline around $19.00. Price didn’t just pierce the level — it held above it, signaling a phase shift. There was an attempt to break through the 0.5 Fibonacci level at $19.60, which led to a pullback — not on heavy selling, but on decreasing volume. This wasn’t a rejection, it was a pause.
This pullback serves as a retest of the breakout zone and the 20-day moving average. The overall structure remains bullish: price stays above all key EMAs and MAs, RSI climbs past 60, and the candlestick structure is stable. Volume rises during up moves and fades during pullbacks — classic signs of reaccumulation.
The measured target from the pattern is $32.00, calculated from the head-to-neckline height projected from the breakout point. As long as price holds above $18.40, the setup remains intact. A break above $19.60 with confirmation would open the door to acceleration.
This isn’t a momentum play — it’s a setup months in the making. The structure is there, the confirmation is there, and most importantly — the price behavior makes sense. With a base like this, the ride ahead looks worth taking.

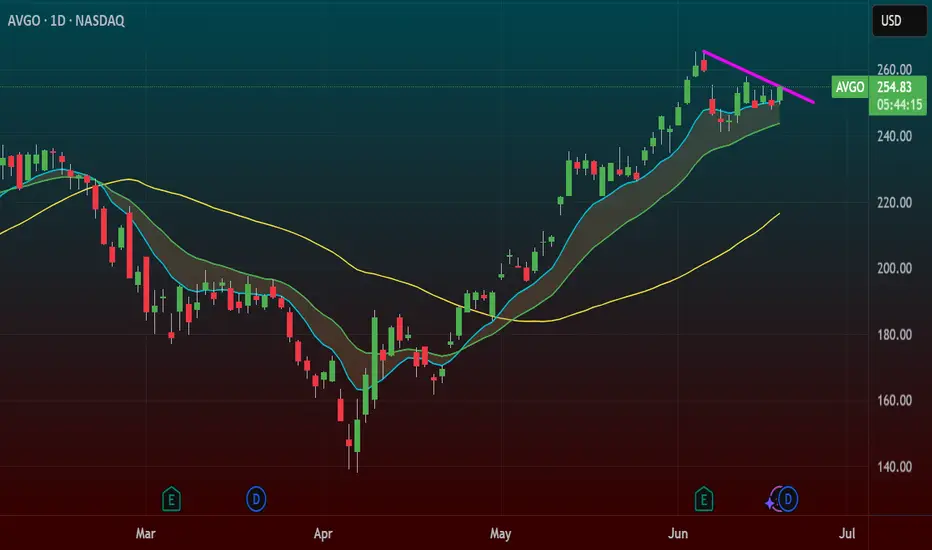
AVGO – All-Time High Breakout with Flag Pattern TriggerBroadcom ( NASDAQ:AVGO ) is breaking out of an 11-day consolidation flag, pushing through the trendline and into all-time highs — a textbook momentum setup.
🔹 Flag Pattern Breakout
After a strong run, NASDAQ:AVGO spent 11 days chopping in a tight flag just under highs.
Today, we’re seeing a clean trendline break, signaling the start of a potential fresh leg higher.
ATH breakout + flag pattern = momentum trader’s dream.
🔹 My Trade Plan:
1️⃣ Entry: Long on the flag breakout and trendline break.
2️⃣ Risk Level: Stop is down at $247, just under the consolidation base.
3️⃣ Target: Riding the trend — trailing stop strategy once price confirms above highs.
Why I Like This Setup:
Strong consolidation near highs = no weakness.
Breakout is happening with clean structure and clear volume pickup.
NASDAQ:AVGO is a leader name — when it goes, it goes.
Micron Technology - Starting the next +80% move!Micron Technology - NASDAQ:MU - perfectly respects structure:
(click chart above to see the in depth analysis👆🏻)
Starting back in mid 2024, Micron Technology created the expected long term top formation. We witnessed a correction of about -60%, which ultimately resulted in a retest of a confluence of support. So far, Micron Technology rallied about +60%, with another +80% to follow soon.
Levels to watch: $150, $180
Keep your long term vision!
Philip (BasicTrading)

Micron Technology (MU) – Powering the AI Memory SupercycleCompany Overview:
Micron NASDAQ:MU is a crucial player in the AI infrastructure stack, providing advanced DRAM, NAND, and NOR flash memory solutions that fuel everything from data centers to mobile edge devices.
Key Catalysts:
AI-Driven Memory Demand ⚙️
High-Bandwidth Memory (HBM) adopted in AI accelerators from Nvidia, AMD, Broadcom, and Marvell.
Positions Micron at the core of the AI supply chain, reducing exposure to chip cycle volatility.
Data Center Surge 📈
Data center DRAM revenue tripled YoY in Q2 2025, driven by hyperscaler AI infrastructure upgrades.
Strengthens revenue diversification and margin profile.
Technology Leadership 🔬
Launch of 1-gamma DRAM node and LPDDR5X samples enhances mobile, cloud, and auto capabilities.
Keeps Micron on the cutting edge of memory innovation.
Investment Outlook:
Bullish Case: We remain bullish on MU above $95.00–$97.00.
Upside Target: $155.00–$160.00, supported by AI compute growth, hyperscale momentum, and next-gen product launches.
💡 Micron is not just riding the AI wave—it’s building its memory core.
#Micron #MU #Semiconductors #AI #HBM #DataCenter #DRAM #NAND #Nvidia #AMD #Hyperscalers #TechLeadership

Why QuickLogic? Unpacking its Semiconductor Surge.QuickLogic Corporation, a vital developer of embedded FPGA (eFPGA) technology, currently navigates a rapidly evolving semiconductor landscape marked by intense technological innovation and shifting geopolitical priorities. Its recent inclusion in the Intel Foundry Chiplet Alliance signals a pivotal moment, affirming QuickLogic's expanding influence in both defense and high-volume commercial markets. This strategic collaboration, combined with QuickLogic’s advanced technological offerings, positions the company for significant growth as global requirements for secure and adaptable silicon intensify.
Critical geopolitical imperatives and a profound shift in semiconductor technology fundamentally drive the company's ascent. Nations are increasingly prioritizing robust, secure, and domestically sourced semiconductor supply chains, particularly for sensitive aerospace, defense, and government applications. Intel Foundry's efforts, including the Chiplet Alliance, directly support these strategic demands by cultivating a secure, standards-based ecosystem within the U.S. QuickLogic’s alignment with this initiative enhances its status as a trusted domestic supplier, expanding its reach within markets that value security and reliability above all else.
Technologically, the industry's embrace of chiplet-based architectures plays directly into QuickLogic’s strengths. As traditional monolithic scaling faces mounting challenges, the modular chiplet approach gains traction, allowing for the integration of separately manufactured functional blocks. QuickLogic's eFPGA technology provides configurable logic, perfectly suited for seamless integration within these multi-chip packages. Its proprietary Australis™ IP Generator rapidly develops eFPGA Hard IP for advanced nodes like Intel’s 18A, optimizing power, performance, and area. Beyond defense, QuickLogic's eFPGA integrates into platforms like Faraday Technology's FlashKit™-22RRAM SoC, offering unparalleled flexibility for IoT and edge AI applications by enabling post-silicon hardware customization and extending product lifecycles.
Membership in the Intel Foundry Chiplet Alliance offers QuickLogic tangible advantages, including early access to Intel Foundry's advanced processes and packaging, reduced prototyping costs through multi-project-wafer shuttles, and participation in defining interoperable standards via the UCIe standard. This strategic positioning solidifies QuickLogic’s competitive edge in the advanced semiconductor manufacturing landscape. Its consistent innovation and robust strategic alliances underscore the company’s strong future trajectory in a world hungry for adaptable and secure silicon solutions.

AMD - Inverted Head & Shoulders (Bullish Reversal)Let´s see if we can break the neckline (White trendline) and stay above with a close and possibly a retest on the neckline to confirm this pattern. If so, Im looking for the previous top on daily which is the all time high (So far).
This is not a financial advise. Always do your own research and decision before investing.

Credo Technology Group (CRDO) – Powering the AI Data Center BoomCompany Snapshot:
Credo Technology NASDAQ:CRDO is a rising star in AI infrastructure, delivering high-speed, low-power connectivity solutions that are mission-critical to modern data centers.
Key Catalysts:
AI Infrastructure Tailwinds 🧠🏢
Direct exposure to Active Electrical Cables (AEC) and PCIe retimers
Positioned for rapid demand acceleration from AI, cloud, and hyperscale data centers
AEC chip market expected to grow 15x from $68M (2023) to $1B+ by 2028
Sticky Software + Hardware Model 🧩
PILOT software platform offers real-time diagnostics and performance tuning
Enables a recurring revenue model and strengthens customer retention
Scalable, Energy-Efficient Portfolio ⚡🌐
High-bandwidth, low-power design aligns with sustainability goals of large data centers
Integrated solutions are already seeing early adoption momentum
Investment Outlook:
✅ Bullish Above: $51.00–$52.00
🚀 Upside Target: $90.00–$92.00
📈 Growth Drivers: AI infrastructure demand, software expansion, chip market scale
💡 Credo isn’t just riding the AI wave—it’s building the rails for it. #CRDO #AIInfrastructure #Semiconductors

Broadcom Inc. (AVGO): Software-Driven Growth Meets AI Hardware ECompany Overview:
Broadcom NASDAQ:AVGO is undergoing a strategic transformation—shifting from a hardware-centric model to a hybrid software and subscription platform. The VMware acquisition is proving pivotal, reshaping AVGO’s margin profile and deepening its enterprise moat.
🔑 Growth Catalysts:
💻 VMware Integration = High-Margin Recurring Revenue
70%+ of top 10,000 VMware customers already moved to subscription model
Transition boosts revenue visibility, margin expansion, and valuation multiples
Strong cross-sell opportunities within Broadcom’s enterprise base
⚙️ Custom AI Chips – A Key NVIDIA Hedge
Broadcom’s custom AI accelerators offer an alternative amid export curbs
Strong demand from hyperscalers and cloud players (Amazon, Google, Meta)
Positioned as a strategic silicon supplier in the AI infrastructure stack
📶 Diversification = Resilience
Deep reach across networking, broadband, storage, and wireless
Reduced cyclicality vs. pure-play semiconductor firms
Balanced between enterprise software and hardware demand
🛡️ Geopolitical Edge
Broadcom’s chip solutions provide alternatives in regions impacted by U.S.-China tech tensions
VMware’s software suite ensures relevance in multi-cloud and hybrid IT environments
📊 Financial Highlights:
Consistent double-digit free cash flow growth
EBITDA margin expansion via software scale and cost synergy post-VMware
Shareholder-friendly with strong buybacks and dividend growth
📈 Investment Outlook:
✅ Bullish Above: $165.00–$170.00
🚀 Upside Target: $270.00–$280.00
🎯 Thesis: With AI tailwinds, VMware synergies, and rising recurring revenues, Broadcom is evolving into a software+silicon powerhouse—positioned for outsized returns and resilience in volatile markets.
#Broadcom #AVGO #VMware #AIchips #Semiconductors #EnterpriseSoftware #RecurringRevenue

Breaking: $TSM Surge 3% As Chipmaker's Results Top EstimatesThe price of Taiwan Semiconductor Manufacturing Company Limited (NYSE: NYSE:TSM ) saw an uptick of 3%, after the world's largest contract chip manufacturer reported first-quarter results that topped analysts' estimates and stuck with its 2025 revenue outlook despite the growing trade war.
TSMC, which supplies tech heavyweights Apple (AAPL) and Nvidia (NVDA), registered earnings per share (EPS) of 13.94 New Taiwan dollars ($0.43) on revenue that rose 42% year-over-year to NT$839.25 billion ($25.85 billion). Analysts polled by Visible Alpha expected NT$13.61 and NT$835.92 billion, respectively.
The company projected second-quarter revenue of $28.4 billion to $29.2 billion. Analysts were looking for about $27.1 billion.
Shares of TSMC, which entered Thursday having lost nearly a quarter of their value in 2025, were up about 3.5% up in premarket session following the results.
CEO C.C. Wei said on the earnings call that the company understands:
"there are uncertainties and risk from the potential impact of tariff policies," according to a transcript provided by AlphaSense. "However, we have not seen any change in our customers' behavior so far. Therefore, we continue to expect our full-year 2025 revenue to increase by close to mid-20s percent in U.S. dollar terms."
Technical Outlook
As of the time of writing, NYSE:TSM is up 2.76% in Thursday's premarket session, with the last close RSI at 39.91, NYSE:TSM might be on the cusp of a breakout amidst the earnings beat. A break above the $180 resistant might clear the path to $200 zone albeit the stock market is still plaque with Trumps Tariff woes. Similarly, failure to break above that pivot could resort to a correction to the recent support point.

Chips Down: What Shadows Loom Over Nvidia's Path?While Nvidia remains a dominant force in the AI revolution, its stellar trajectory faces mounting geopolitical and supply chain pressures. Recent US export restrictions targeting its advanced H20 AI chip sales to China have resulted in a significant $5.5 billion charge and curtailed access to a crucial market. This action, stemming from national security concerns within the escalating US-China tech rivalry, highlights the direct financial and strategic risks confronting the semiconductor giant.
In response to this volatile environment, Nvidia is initiating a strategic diversification of its manufacturing footprint. The company is spearheading a massive investment initiative, potentially reaching $500 billion, to build AI infrastructure and chip production capabilities within the United States. This involves critical collaborations with partners like TSMC in Arizona, Foxconn in Texas, and other key players, aiming to enhance supply chain resilience and navigate the complexities of trade tensions and potential tariffs.
Despite these proactive steps, Nvidia's core operations remain heavily dependent on Taiwan Semiconductor Manufacturing Co. (TSMC) for producing its most advanced chips, primarily in Taiwan. This concentration exposes Nvidia to significant risk, particularly given the island's geopolitical sensitivity. A potential conflict disrupting TSMC's Taiwanese fabs could trigger a catastrophic global semiconductor shortage, halting Nvidia's production and causing severe economic repercussions worldwide, estimated in the trillions of dollars. Successfully navigating these intertwined market, supply chain, and geopolitical risks is the critical challenge defining Nvidia's path forward.

Can Efficiency Topple AI's Titans?Google has strategically entered the next phase of the AI hardware competition with Ironwood, its seventh-generation Tensor Processing Unit (TPU). Moving beyond general-purpose AI acceleration, Google specifically engineered Ironwood for inference – the critical task of running trained AI models at scale. This deliberate focus signals a Major bet on the "age of inference," where the cost and efficiency of deploying AI, rather than just training it, become dominant factors for enterprise adoption and profitability, positioning Google directly against incumbents NVIDIA and Intel.
Ironwood delivers substantial advancements in both raw computing power and, critically, energy efficiency. Its most potent competitive feature may be its enhanced performance-per-watt, boasting impressive teraflops and significantly increased memory bandwidth compared to its predecessor. Google claims nearly double the efficiency of its previous generation, addressing the crucial operational challenges of power consumption and cost in large-scale AI deployments. This efficiency drive, coupled with Google's decade-long vertical integration in designing its TPUs, creates a tightly optimized hardware-software stack potentially offering significant advantages in total cost of ownership.
By concentrating on inference efficiency and leveraging its integrated ecosystem, encompassing networking, storage, and software like the Pathways runtime, Google aims to carve out a significant share of the AI accelerator market. Ironwood is presented not merely as a chip, but as the engine for Google's advanced models like Gemini and the foundation for a future of complex, multi-agent AI systems. This comprehensive strategy directly challenges the established dominance of NVIDIA and the growing AI aspirations of Intel, suggesting the battle for AI infrastructure leadership is intensifying around the economics of deployment.
