it looks like semiconductors are busti imagine this down move in semiconductors is going to push mich lower, and soxs is a long at these levels into the upper 70s. the signal moving average is green on this inverse.
Semiconductors

AMD going after 2020 H&S that was ignored due to tech bubbleAMD formed a H&S topping pattern & has since broke below 100 psychological level & the neckline. It wants to retest 75, the neckline of a 2020 H&S that was bypassed because of the tech bubble. If the 75 neckline does not hold, the measured move may see a low of 49 or even a little lower.( due to the bigger H&S from ATH)
However, it will be good to start averaging down in the 64 to 49 zone because of the many Fib levels in
this area which may offer support.
Shortterm bearish but longterm bullish. Semi-conductor & memory chips will benefit from the gaming, Metaverse, AI, Automation & EV boom.
Not trading advice

Intel up 4%, files to IPO its Mobileye self driving car divisionApparently, Intel has an ace up its sleeve. It owns a self driving car division called Mobileye and seeks to file for IPO. Mobileye valuation could range between 30-50 billion, while current market cap on Intel is around 100billion.

SOXL / SMH - CREATING A BULLISH REVERSALBACKGROUND:
SOXL (3x ETF) created a great reversal pattern back in JUNE - JULY 2022. It's tempting to ignore it because it ultimately failed on 8/26/22. Nonetheless, it was a great technical entry point when the price broke above $17.
CURRENT PRICE ACTION:
The reason I'm pointing out what happened in JUNE - JULY is because SOXL ETF is forming another BULLISH reversal (early stage) having just passed above last Friday's (9/30) high and entering back into the $9.50 - $10.50 range. The two previous reversals (8/26, 9/13) had failed. Yet the job of a trader is to not HOPE or PREDICT, but rather TRADE the signals and MANAGE RISK ACCORDINGLY .
GAMEPLAN:
I'm watching if the price closes above $10.35 (approx.) within the next few days. I'm anticipating some price action around this level. Any close above $10.35 can follow with some pullback. In fact this is a GREAT entry point for the bears if we were to follow trend alone. However, the reversal that happened from $9.50 and the bounce that's happening on the NASDAQ (potential double bottom) can signal a potential reversal in the market (short-term).
There are two potential bullish reversal scenarios:
1. Straight up(rare)
2. Chop sideways and build a larger reversal base (as happened in JUNE - JULY)
LOOK-OUT FOR:
What comes out of the FED emergency meeting. As mentioned in my previous post on the status of the DOW JONES - I think the analysts at the FED see the same. The FED will either blink and change its' stance or the market is taking another big leg down...
Be safe all and thank you for reading.

Qualcomm (QCOM) bearish scenario:The technical figure Descending Triangle can be found in the daily chart in the US company Qualcomm (QCOM). Qualcomm is an American multinational corporation. It creates semiconductors, software, and services related to wireless technology. It owns patents critical to the 5G, 4G, CDMA2000, TD-SCDMA and WCDMA mobile communications standards. The Descending Triangle broke through the support line on 30/09/2022. If the price holds below this level, you can have a possible bearish price movement with a forecast for the next 80 days towards 98.71 USD. Your stop-loss order, according to experts, should be placed at 152.81 USD if you decide to enter this position.
Looking at its valuation, Qualcomm is holding a Forward P/E ratio of 9.6. For comparison, its industry has an average Forward P/E of 17.45, which means Qualcomm is trading at a discount to the group.
It is also worth noting that QCOM currently has a PEG ratio of 0.61. This metric is used similarly to the famous P/E ratio, but the PEG ratio also takes into account the stock's expected earnings growth rate. QCOM's industry had an average PEG ratio of 1.81 as of yesterday's close.
Risk Disclosure: Trading Foreign Exchange (Forex) and Contracts of Difference (CFD's) carries a high level of risk. By registering and signing up, any client affirms their understanding of their own personal accountability for all transactions performed within their account and recognizes the risks associated with trading on such markets and on such sites. Furthermore, one understands that the company carries zero influence over transactions, markets, and trading signals, therefore, cannot be held liable nor guarantee any profits or losses.

Many Megatrends Depend on Semiconductors. Governments are competing with each other to ensure stable future supplies
The phrase ‘chip shortage’ has made quite an impression1.
- The US has earmarked an enormous one-time sum, $77 billion, in subsidies and tax credits to boost chip production within the US
- China is prepared to spend more than $150 billion through 2030
- South Korea is poised to offer an array of incentives over the coming five years, valued at roughly $260 billion
- The European Union (EU) is seeking to spend $40 billion
- Japan is seeking to spend $6 billion
In 2021, revenues in semiconductors were $553 billion, and are expected to grow to $1.35 trillion by 2030. Roughly three-quarters of chip-making capacity is in China, Taiwan, South Korea and Japan. The US only sits at about 13%, whereas the EU sits at roughly 9%2.
All chips are not the same
The Covid-19 Pandemic has shown different economies the importance of securing the supply of semiconductors. One thing to note is that there is a wide variety of semiconductors, and some countries are seeking to secure one type of supply over another. China’s push is aimed less at the cutting edge and more at being a higher volume player in the essential part of the market for lower priced but still important chips3. Some necessary chips that inhibit the production of automobiles, for example, could be valued at $1 dollar or less on a per-unit basis4, far from the most cutting edge in the space.
Company results are showcasing both successes and failures
Intel reported that Q2 earnings that received a bleak reception, with revenue falling 17% relative to Q1 of 2022. This was the worst sequential quarter-to-quarter revenue performance going back to the year 2000. Intel also noted a delay to its next generation server chip, Sapphire Rapids, and that its data centre chip business would grow slower than the overall data centre market for two years5. This compares to Taiwan Semiconductor Manufacturing Company (TSMC) growing revenue 37% and profit by 76% year-over-year6.
Earlier in 2022, Samsung reportedly lost its two biggest foundry customers, Qualcomm and Nvidia, to TSMC. Reports indicate that they were not satisfied with Samsung’s capability in the 4 and 5-nanometre space, which represents the current cutting-edge in semiconductor manufacturing. TSMC captures greater than 50% of foundry market share, operating at a market share level roughly three times that of Samsung. Still, Samsung did hold a recent ceremony to celebrate its first shipment of 3-nanometre chips, hitting this milestone faster than TSMC7. In contrast, it is estimated that roughly 25% of TSMC’s business is from Apple, and then Nvidia, Qualcomm and Advanced Micro Devices (AMD) are estimated to provide about another 5% each8.
Capital expenditures set companies up for future growth
TSMC is also investing at an incredible clip, aiming to spend up to $44 billion in 2022 compared to Samsung’s $12 billion, even if Samsung has announced a spending plan to total $151 billion between now and 20309. Intel has announced in its most recent, admittedly tough, quarterly results a plan to cut planned capital expenditures in 2022 by 15% to a level of $23 billion10.
Samsung is also facing competition in the dynamic random access memory (DRAM) business, as Micron and SK Hynix have introduced some of the most advanced chips for these purposes. Still, even amidst the competitive onslaught, Samsung’s DRAM market shares sit at about 40%. In the smartphone application processor market, Samsung’s market share was 6.6%, compared with Qualcomm at 37.7%, MediaTek at 26.3% and Apple at 26%11.
Time to invest?
Semiconductor companies tend to follow a particular rhythm, seeing strong demand, making investments, increasing supply, hitting levels of oversupply in certain types of chips, then waiting for the market to re-attain something closer to equilibrium. Today, we may be at the tail-end of the ‘chip shortage’ and it may not, at least in the short run, be the time to expect an immediate performance pop in the share prices of most semiconductor companies.
However, any megatrend that touches technology in any way requires semiconductors to function—in a sense if any of them grow, the demand for necessary semiconductors will also grow. Having a multi-year time horizon could be of greater interest, in our view. Since not all semiconductors are the same, it is also worth recognising that different companies may be more associated with different megatrends—for instance, certain companies are doing more in Artificial Intelligence (AI) model training space, whereas others are doing more in the industrial and automobile space. The supply/demand balance within different types of semiconductors will not necessarily be the same.
Sources
1 Source: Sohn, Jiyoung. “The U.S. Is Investing Big in Chips. So Is the Rest of the World.” Wall Street Journal. 31 July 2022.
2 Source: Sohn, 31 July 2022.
3 Source: Strumpf, Dan & Liza Lin. “China Bets Big on Basic Chips in Self-Sufficiency Push.” Wall Street Journal. 24 July 2022.
4 Source: Gallagher, Dan. “No Quick Fix for Auto Chip Shortage.” Wall Street Journal. 9 February 2021.
5 Source: Kim, Tae. “Intel Stock Will Plunge Further, Analyst Says, after ‘Worst’ Quarter He Has Ever Seen.” Barron’s. 29 July 2022.
6 Mellow, Craig. “Taiwan Semi’s Spending Spree Will Pay Off Big in the Long Term.” Barron’s. 29 July 2022.
7 Source: Jung-a, Song & Christian Davies. “Samsung seeks to reassure markets over semiconductor competitiveness.” Financial Times. 30 July 2022.
8 Source: Craig, 29 July 2022.
9 Source: Jung-a, 30 July 2022.
10 Source: Gallagher, Dan. “Intel Shows Limits of Chips Act.” Wall Street Journal. 29 July 2022.
11 Source: Jung-a, 30 July 2022.
This material is prepared by WisdomTree and its affiliates and is not intended to be relied upon as a forecast, research or investment advice, and is not a recommendation, offer or solicitation to buy or sell any securities or to adopt any investment strategy. The opinions expressed are as of the date of production and may change as subsequent conditions vary. The information and opinions contained in this material are derived from proprietary and non-proprietary sources. As such, no warranty of accuracy or reliability is given and no responsibility arising in any other way for errors and omissions (including responsibility to any person by reason of negligence) is accepted by WisdomTree, nor any affiliate, nor any of their officers, employees or agents. Reliance upon information in this material is at the sole discretion of the reader. Past performance is not a reliable indicator of future performance.

large cap semiconductors carrying market lower or highernasdaq us large cap semiconductors are carrying big tech right now. if they drag the market lower im bearish on the broader market. if we bounce in this group especially NVDA and AMD i think were headed for a test of the weekly lower high around 5500 translating to a $15 SOXL. if we bearflag, and head lower id imagine were in for much more of a drop. the pivot is dashed and upper/lower horizontals are solid lines. the extended line rising is the recent low linked to the all time low. if we break below this range its bearish for SOXL and the market in general.

SOXL reversal from bottom LONGAMEX:SOXL
On a 30-minute chart SOXL, a triple leveraged bull ETF for semiconductors is now in an early uptrend.
The semiconductor sector may be challenged but stable economics from its industrial customer bases may be
steadily rising.
The chart shows recent horizontal resistances from pivot points and an overlaid volume profile.
For the long trade, I will set a stop loss for a 3% risk while setting targets of $15.85 , below the Fib 0.5
$ 16.8 below the top of the high volume area of the profile and final take profit at $21.3 just below
the double top of August 5th and 12th. With tiered take profits, this looks to be about 30% upside
overall with a very safe ratio of risk especially if the stop loss is raised above the entry on the first leg
of the uptrend.

AMD strong sellAMD has fallen out of the bullish trend channel and it couldn't show strength afterwards. Maybe the fall will stop at $73.
Entry price: 81
Target price 1: 73 +10.9%
Target price 2: -
Stop-loss: 87.5 -7.4%
Period length: 18-20 days

$nvda Capitulation? Last line of support! NVIDIA$NVDA is on its last leg of support, if it loses this area we are looking at $115 as the next support level
HOWEVER, I'm spotting signals of capitulation as I highlighted in yellow - steep decline with elevated volume.
In the past NVIDIA usually bounces after this type of price action and we have now touched the bottom of this descending supportive channel that its respected since last summer.
Fear is looming. Are you buying this blood?

Nvidia draws attention back to Pelosi's stock picks Stock investments by US House Speaker Nancy Pelosi and her husband, venture capitalist Paul Pelosi, are again in the spotlight after shares of Nvidia (NASDAQ: NVDA) declined again after the pair reduced their interest in the semiconductor company.
Pelosi is the first female Speaker of the US House of Representatives and second in line to the presidency (after Vice President Kamala Harris). Considering her very public position, her financial matters and by extension, her husband's, always attract attention.
In July, the couple sold 25,000 Nvidia shares in a transaction valued between $1 million and $5 million. The shares were sold at $165.05 apiece, reflecting a loss of $340,000. On Sept. 1, Nvidia fell 18.3%, and if not for the July transaction, the Pelosis would have lost $753,000, the news platform added.
While the decision may have just been due to good investor instinct, it is being marred by controversies. The filing of a bill in Congress, as well as a visit in Taiwan are making it harder to simply brush some of the controversies under the rug.
Semiconductor Boost
Paul Pelosi invested in Nvidia on June 17 with the exercise of 200 call options for shares in the company at a price of $100 per share. The transaction was also valued between $1 million and $5 million..
It came at a time when the CHIPS Act is tabled for approval in Congress. The bill, which President Biden signed into law in August, aims to strengthen domestic semiconductor manufacturing, design and research. According to TechRepublic, the law will provide $52 billion for semiconductor manufacturing incentives and research investments, as well as a 25% investment tax credit for semiconductor manufacturing, which would be a great help to companies like Nvidia.
New York Post columnist Charles Gasparino labelled the investment the "latest home run" for Pelosi, who Gasparino wrote, "has been killing it in the stock market in recent years," winning with companies that benefit from governmental legislation.
Congresswoman Pelosi supported the CHIPS Act. Following the July sale, people have started singing a different tune that the transaction may have been done to alleviate conflict of interest concerns.
Or it could be another smart investment move. Nvidia fell nearly 3% at close of trading Sept. 2. It has been on the red that week, likely due to the US government's restriction of the company's sales to China.
Another event connecting the House Speaker to the semiconductor industry is her visit to Taiwan on Aug. 2. The visit, which according to BBC was "strongly condemned" by China, involved a meeting with Mark Liu, chairman of the world's biggest chipmaker, Taiwan Semiconductor Manufacturing Co. or TSMC (TPE: 2330).
Other Investments
Aside from Nvidia, the Pelosis have other investments in public companies. Business Insider reported in July that they have shares in companies including:
AllianceBernstein (NYSE: AB),
the class A (NASDAQ: GOOGL) and C stocks (NASDAQ: GOOG) of Alphabet,
Amazon.com (NASDAQ: AMZN),
American Express (NYSE: AXP),
Apple (NASDAQ: AAPL),
Micron Technology (NASDAQ: MU),
Microsoft (NASDAQ: MSFT),
Paypal (NASDAQ: PYPL),
Salesforce.com (NYSE: CRM),
Tesla (NASDAQ: TSLA), Visa (NYSE: V),
Walt Disney (NYSE: DIS),
and Warner Bros. Discovery Series A (WNASDAQ: WBD).
Speaker Pelosi's involvement in these companies prompted a legislation that would prohibit members of the US Congress from trading stocks. After months of resistance, Pelosi dropped opposition of the proposed legislation.
Insider included the House Speaker in its list of 25 richest members of Congress, with a net worth of at least $46.1 million. Amid insinuations that this may have something to do with information she passes on to help her husband with his investment decisions, the congresswoman told reporters in July that this was never the case.

$AMD Inverse Head & Shoulder - Bring the dip ill buy the chips!Semi-conductors/chip stocks took a big dip this week after more negative earnings reported.
I am watching this inverse head & Shoulder pattern for a reversal with huge upside potential.
Declining selling volume.
Near oversold RSI
High risk (manage risk) as we are at a major support level. If we lose this level, the weight could get really heavy back into the 70's range.. are you catching my drift?

i like semiconductors correcting from oversoldsome meaningful bounce is taking place in big tech at least intraday, andsemiconductors as a lead bear are taking part. SOXL is trapped under yeasterdaysgap up, and todays gap up. ive marked outlong short pivot and drawn a bull and vear scenario. there is no bias, but i am long semiconductors when price is so low, at least intraday.

$AMD failing bull flag, 0.5 fib retracementFailing bull flag on AMD, not retesting 0.5fib level and around 50SMA. Potential to get down to $83-84. Looks weak

Follow Through on Head and Shoulders X2I was bearish on NVDA through earnings because of a couple signals I was monitoring.
1) large head and shoulders (or double top) formed on hourly.
2) Smaller head and shoulder on the 15m played through to the 162% just before earnings.
3) I charted my reasons for being short NVDA. Bitcoin dropped from 48k to 20k since Jan. Less Miners = Less Demand for Video Cards. Higher Dollar = Lower Bottomline
Let me put on my tinfoil hat for a second and tell you what I think about Bitcoin short term outlook.
My thoughts for September can be found here.
In short... I'm leaning to the downslide.
Not Financial Advice. I'm just a punny guy.


SOXS at support for LONG SWING SETUPAMEX:SOXS
Reports are the semiconductor secotr is presently challenged with rising costs
and lower production orders.
SOXS is in a flat bottom triangle with price now at its base.
The RSI Oscillator is in mid-range suggesting price has upside.
The relative volume has been increased in the past two weeks.
I see this as a swing long setup with the target 30-40& above
the current market price in the mid-Fibonacci retracement range.

NVDA: Will pull back soon, but bullish longtermNVDA provided a textbook 5-wave impulsive move off the low. The 3rd wave tagged the 1.618 extension and the 5th wave has reached the 2.0 extension. This move has been very clean. However, the fibonacci extensions have been reached and now momentum is beginning to fade (see MACD). That being said, I expect NVDA to pullback over the next 2-3 weeks. I would like to see price retrace to the .5 - .618 retracement levels, filling the gaps in an A-B-C pattern, followed by a push back above the Wave 1 high. If this happens, the price target for wave 3 will be in the 240-250 range.

short at key resistance levelsthis ramge will continue to tighten, and we will likely get a bear break. above pivot target upper horizontals below pivot aim for lower horizontals. semiconductors have been a major focal point of this bear market, and they will be a big recovery story when we exit it.

SHORT SEMICONDUCTORS ON NEWS- SOXSAMEX:SOXS
Semiconductors have been giving some cautious guidance suggesting a market downturn,
supply chain issues and the recession fears. Vehcicles are being shipped to dealers lacking
some "chips" ; in the meanwhile, the CHIP acts hopes to stabilize things.
SOXS a ETF shorting the semiconductor industry #X leverage as the inverse of SOXL
The 4H chart of SOXS shows an EMA ribbon divergence, a market low with a Double or
Triple Bottom and an Asymmetrical Inverse Head and Shoulders with a neckline trendline
Marking a breakout just above the current market price.
This appears to be a good swing long trade setup or call option entry ripe for the taking.

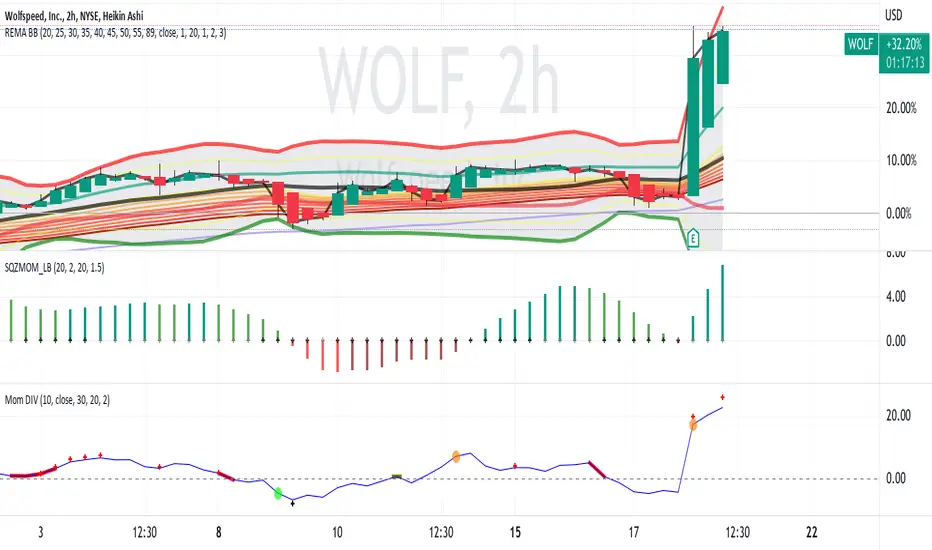
WOLF rises on earnings Is it ready to fall SEMICONDUCTOR STOCKNYSE:WOLF
The chart and indicators show the dramatic rise after earnings.
The squeeze indicator is rising while the momentum divergence is
increasing.
What do you think- will WOLF continue on the uptrend or reverse?
What Would Happen to Bitcoin if China Attacks Taiwan?Since last week the media has published videos and Chinese politicians' statements about the Chinese military drills near Taiwan. Taiwan has also conducted military exercises and preparatory work with the civilian population in the event of an attack. On August 3, the NYT, quoting Chinese state media, published an article about the following Chinese military drills scheduled on August 4 and a place of exercises. Chinese media offered five swaths of the sea surrounding Taiwan. If true, it can be a hostile act, possibly igniting conflict between China and unrecognized Taiwan. Both countries are essential for the world economy, meaning the conflict would affect markets. I hope it will not happen . However, this risk urged me to start a series of posts ' What would happen to asset_name if China attacks Taiwan? '
A brief: China is the second economy in the world by nominal GDP. Taiwan is the heart of semiconductor manufacturing for all industries across the globe.
In my opinion, Bitcoin today is a risk appetite indicator, which regularly mimics or outpaces changes in the notable stock indexes, e.g., S&P 500 and Nasdaq Composite. The risk realization would trigger risk aversion pushing the BTC price to the last local support level of $19000. The stop-loss is the previous local high of $24500. However, the level can slightly differ from the spot price. The main risk is conflict duration. The longer the conflict exists, the more sanctions I expect. I can't predict how long Taiwan can fight and what sanctions will be imposed. I doubt that sensitive restrictions would be imposed during the first days. I also doubt that the US will impose harsh sectoral sanctions if China takes over Taiwan quickly. If the conflict would last several months, I suppose bitcoin could drop significantly to $14000. The position holding period is 7 days to next Thursday. If the bad doesn't happen, it is better to close the short position. However, we do not know the date. Solely China knows the exact date if the plan exists. The risk could realize during the next 7 days or be postponed to next month or even later. If the risk realizes later, I expect the same effect on the BTC, and only target adjustments could be needed.
Additionally, the potential conflict would seriously weigh on crypto mining activity because of semiconductor manufacturing termination in Taiwan. A probable semiconductors' deficit leads to the rise of GPU's price in the midterm, elevating mining costs. Miners would have to adapt to the new reality.
I wish you peace!
Thank you for your reading, and have profitable trading! Comment your thoughts!

seeking over $200 soon for this semiconductor stocknvda has made a quick return over the past couple months, and theres no reasont that if the broader market continues bullish that nvda should not participate. if we get higher lows in daily qqq i would imagine over $200 for nvda, or around the highest horizontal is in play. if we resist from the first horizontal and set lower highs daily qqq breaking pivot to the downside nvda i would go for thoelse lower horizontals.
