4/17/22 AMATApplied Materials, Inc. ( NASDAQ:AMAT )
Sector: Producer Manufacturing (Industrial Machinery)
Market Capitalization: 100.142B
Current Price: $113.36
Breakdown price: $114.50
Sell Zone (Top/Bottom Range): $125.60-$136.95
Price Target: $97.20-$94.80 (4th)
Estimated Duration to Target: 40-44d (4th)
Contract of Interest: $AMAT 5/20/22 110p
Trade price as of publish date: $4.95/contract
Semiconductors

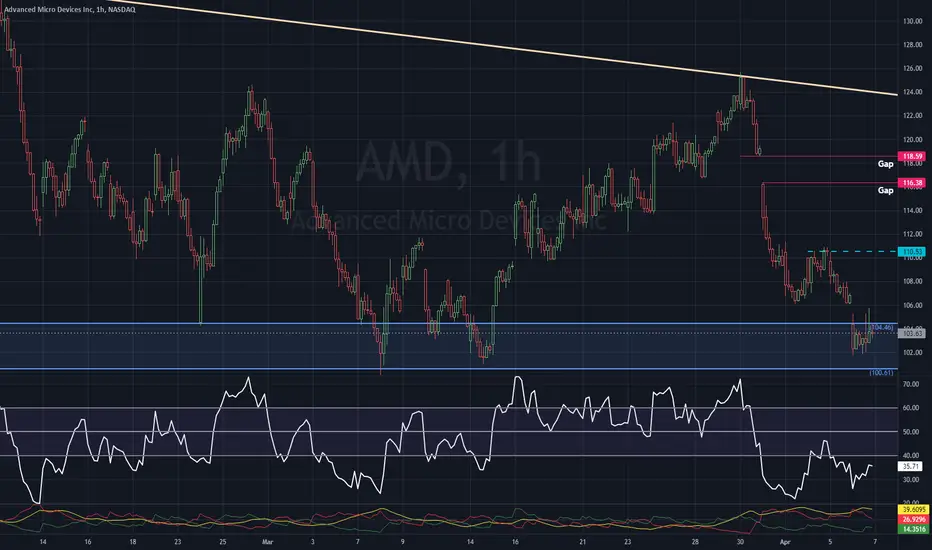
AMD idea #1AMD currently trading below multi-month support. If it can get back and hold above 100, could test the top of regression channel.

AMD Bullish Short Term - SemiconductorsIn my last posts on AMD and video we were bearish on the stock calling for a much lower downward target; however, we want to take advantage or short term changes when opportunities present themselves. Therefore, you can have both bullish and bearish sentiments and outlooks -- trade what the markets give you.
Market Reversal Mid-day; Bear Markets still present. Today is setting up for a key reversal day after that last push into the mid day. This doesn’t mean the bear market reversal is in but it is potential short term importance.
I went long AMD around 3:45 before the close. I provide some insight into that reasoning in my video below and on #FB

AMD is in a neutral to bearish positionAMD is in an area where it has the capability to experience a minor upswing; however, that is based on the overall market conditions and the beatdown #SOX Semiconductor index. Both #NVDA and #AVGO had the largest pullbacks today (of those that I watch in this sector). The Semiconductor Index is well below the 200 day and 50 day moving averages, which is never a good sign, and today we see the NASDAQ-100 gap down to its 50-day area.
Market conditions are not idea and personally I think the march lows will be tested soon -- that is not to say we won't have any upward impulse moves for day trading opportunities. Overall, my sentiment is neutral to bearish on #AMD based on the current complexion of the overall markets, the semiconductor index, and technical conditions.
$SOXL Key Levels, Analysis, & Targets $SOXL Key Levels, Analysis, & Targets
So this is a 3x semiconductor ETF by request for @xianloon
Buy targets are in green.
Sell targets are in red.
And I’d expect 30-44% for this trade. So if you average down into it just set your sell order for 30% above your average…
Structure of the Trade:
1 at 36.42
1 at 31.76
2 at 28
4 at 22
8 at 17.63
(Times your multiplier (x10, x100 etc)
I might play this one with you
——

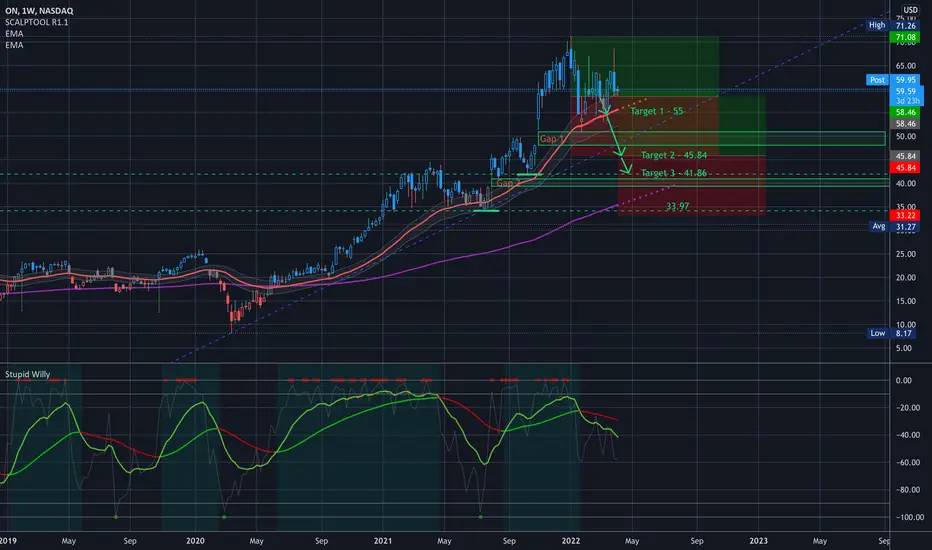
$ON Key Levels, Analysis, & Targets $ON Key Levels, Analysis, & Targets
Looking for 21-27% depending on how many targets hit…
——
If you’ve never traded my setups, try it on a small scale 1st.
Buy
1 share at 55
1 share at 45.84
2 shares at 41.86
4 shares at 33.97
(Basically just double position each level down)
Once you see it on a small scale you can scale in your multiplier (x10, x100 etc)
Looking for 21-27% depending on how it plays out.
——
$AMD Key Levels, Analysis, & Targets $AMD Key Levels, Analysis, & Targets
So for this swing I’m looking at 102.30 for entry
But I’m also thinking that target 2 could hit so as soon as target 1 fills I’m setting a buy order at target 2.
In either case I’m looking for a 30% swing.
So if target 1 fills, set your sell order 30% higher (133.38)
If it sells off and target 2 fills set your sell order for 30% above your average…
Same for target 3…
------
---
I am not your financial advisor. Watch my setups first before you jump in… My trade set ups work very well and they are for my personal reference and if you decide to trade them you do so at your own risk. I will gladly answer questions to the best of my knowledge but ultimately the risk is on you. I will update targets as needed.
GL and happy trading.
IF you need anything analyzed Technically just comment with the Ticker and I’ll do it as soon as possible…

NVDA levels 3/29Looking at chip leader tomorrow for sure. I have levels here for upside and where it needs to protect to the downside. Looks like we are headed to that $300 number.

Khans Scalping-Idea - 02/28/22 - $MUEarnings ahead and already pushing during Pre-Market. Nice open POCs above and a lot of gaps to fill. Depending on Earnings this could skyrocket. Way safer would be selling before release.

Khans Scalping-Idea - 02/28/22 - $AMDDouble Bottom still plays out. Needs to find support around 118.50/19, then we can expect a move higher.
Psychological resistance at 125 - after that 130 in play

AMD bullishSemiconductors are getting stronger affected by global crisis nowadays, one of them is AMD which has almost superb metrics as on technicals and so on fundamentals, if you don't have AMD stock then it's something to consider.

3/27/22 GFSGlobalFoundries Inc. ( NASDAQ:GFS )
Sector: Electronic Technology (Semiconductors)
Market Capitalization: $42.208B
Current Price: $78.94
Breakout Price (hold above): $77.05
Buy Zone (Top/Bottom Range): $74.35-$67.40
Price Target: $90.20-$91.60
Estimated Duration to Target: 40-43d
Contract of Interest: $GFS 5/20/22 80c
Trade price as of publish date: $7.80/contract

3/27/22 MRVLMarvell Technology, Inc. ( NASDAQ:MRVL )
Sector: Electronic Technology (Semiconductors)
Market Capitalization: $63.051B
Current Price: $74.37
Breakout Price: $75.15
Buy Zone (Top/Bottom Range): $71.80-$65.10
Price Target: $79.80-$80.80 (1st), $86.20-$88.00 (2nd)
Estimated Duration to Target: 30-32d (1st), 58-62d (2nd)
Contract of Interest: $MRVL 4/14/22 75c, $MRVL 5/20/22 80c,
Trade price as of publish date: $2.80/contract, $3.05/contract

3/27/22 NVDANVDA Corporation ( NASDAQ:NVDA )
Sector: Electronic Technology (Semiconductors)
Market Capitalization: $695.069B
Current Price: $276.92
Breakout price: $283.50
Buy Zone (Top/Bottom Range): $261.80-$240.50
Price Target: $314.80-$316.90
Estimated Duration to Target: 54-62d
Contract of Interest: $NVDA 5/20/22 300c
Trade price as of publish date: $11.65/contract

INTC- Some trends catch fire slowly
I have been bullish on this name for a while, and missed out options play twice, but I know that market gives you several opportunities if you are listening.
This weekly chart is just a start of what I expect to be MUCH bigger move in next few years.
Test of ATh might come as early as next month. then breakout, perhaps C&H (which already shows on the monthly TF)
In the midst of semiconductor chips shortage, when every other name has been devoured by institutions and retail alike, an industry leader $INTC remains undervalued and underestimated. I expect that to change soon.

ASML BARR Bump & Run Reversal1D Chart: Normal candle.
On the day we look at the course of the Bump & Run compared to the previous TA. ( )
This is because we are on the verge of claiming or being rejected as the price is now on the “Lead-In line”.
This Friday will probably play a role in that, if the bulls really claim this, the RUN can be used.
What is also interesting on the day chart? Is that when the EMA crosses 26 on the EMA 50 a Mini Golden Cross occurs which is the beginning of bullish momentum. Of course, the EMA 50 on the 200 is the intersection that is an extra confirmation on that.
4H chart: Normal candle
On the 4 hour chart we zoom in on the Broadening Descending Wedge which has more or less put us on the Lead-In line of the bigger picture. The price is still above the old neckline of the previous M pattern and I would like to see the bulls claim this zone (as indicated on the day) to be able to move further up. What worries me a bit is the gap that is a lot lower and is also beyond the Golden Pocket. Also keep an eye on that scenario because in the MACD indicator we see that a downward crossing has been made, this can be temporary but I would like to add.
I also share the 4H chart: in Heikin ashi which I often find gives a calmer picture.

ASML BARR + Broadening descending wedge1D Chart: Normal candle.
On the day we look at the course of the Bump & Run compared to the previous TA. ( )
This is because we are on the verge of claiming or being rejected as the price is now on the “Lead-In line”.
This Friday will probably play a role in that, if the bulls really claim this, the RUN can be used.
What is also interesting on the day chart? Is that when the EMA crosses 26 on the EMA 50 a Mini Golden Cross occurs which is the beginning of bullish momentum. Of course, the EMA 50 on the 200 is the intersection that is an extra confirmation on that.
4H chart: Normal candle
On the 4 hour chart we zoom in on the Broadening Descending Wedge which has more or less put us on the Lead-In line of the bigger picture. The price is still above the old neckline of the previous M pattern and I would like to see the bulls claim this zone (as indicated on the day) to be able to move further up. What worries me a bit is the gap that is a lot lower and is also beyond the Golden Pocket. Also keep an eye on that scenario because in the MACD indicator we see that a downward crossing has been made, this can be temporary but I would like to add.
I also share the 4H chart: in Heikin ashi which I often find gives a calmer picture.

Nvidia Stock NVDA Is Edging HigherNvidia stock NVDA had built a strong move on Friday to post a solid gains of 6.81% and close on the resistance area around $265.00.
The stock is showing bottoming signals after violating the downward trendline, Prices have the potential to test the 50.00% and 61.80% Fibonacci Retracement levels ($276.00 - $293.00) consecutively.
It is worth mentioning that Nvidia's investors’ day event - between March 21-24 - will be watched closely across the tech sector and will boost the price's volatility.

NVIDIA DOUBLE BOTTOM W PATTERN ADAM EVEAn update on NVIDIA
We are a month further and a lot has happened in a month.
Looking at the 4 hours:
Following the previous TA, the bulls had failed to break through. As a result, as reported, we may have started to fill the gaps that were lower, which have now been filled. It was perhaps a bit early to call but… in the end the double bottom W pattern formation is as good as a fact. In fact, I spot 2 that are almost similar (large and smaller one). The price targets of both formations are stated, both the 100% price targets by means of clap and flap… but also the 69% price targets based on the ADAM EVE Double bottom W pattern
(bottom price - neckline price = X * 0.69= Xa then.... the neckline + Xa = price target).
However, the necklines must be broken and preferably provided with a re-test.
If the bulls are rejected at the first neckline, there is still hope for the USD 224 otherwise a decline towards the earlier USD 210 support will undoubtedly be tested again.

Qualcomm | QCOM | Short to Gap FillQualcomm ( NASDAQ:QCOM ). While I believe semiconductors will be the hot tickers again in the near future, Qualcomm needs to close the gap between $138.55 and $147.88. The upcoming Federal Reserve meeting and OpEx may serve as catalysts for this move. While it could rise to test resistance in the low- to mid-$160s to trap the bulls, I expect it to show more weakness ahead. Closing the gap below will be great for the bulls (like myself) in the long-run.
If it breaks resistance, thesis is broken.

NXPI exposure to ChinaThe U.S. warning China it could face devastating sanctions if it defies the ban on doing business with Russia!
This is a move that could have huge impact on American companies.
38% of NXP Semiconductors revenue comes from China.
My price target from NXPI is $134.
Looking forward to read your opinion about this.

A little more pain ahead for SemisLooking for a fill of the gap at 232 which coincides with the 2.0 extension of this 5-wave move down. Head & Shoulders pattern with negative MACD divergence.

Where is Micron Technology going next?Ok guys I am really bad about wanting to type out a thesis on my charts. Not all the lines on my chart currently matter, they are for my reference as a lot of the chart is hidden. Overall I see a possible pullback up to the $83-$84 range, after that my overall range to the downside for the current moment is $72-$77 with a more pinpointed range of $73-$75. I will reassess the chart once I see more price action play out into the beginning of the week and most likely grab a PUTS position (want to make sure from validation). Once it hits my targets I will reassess the chart for further moves to the upside/downside.
What are your thoughts on MU/Micron Technology?
