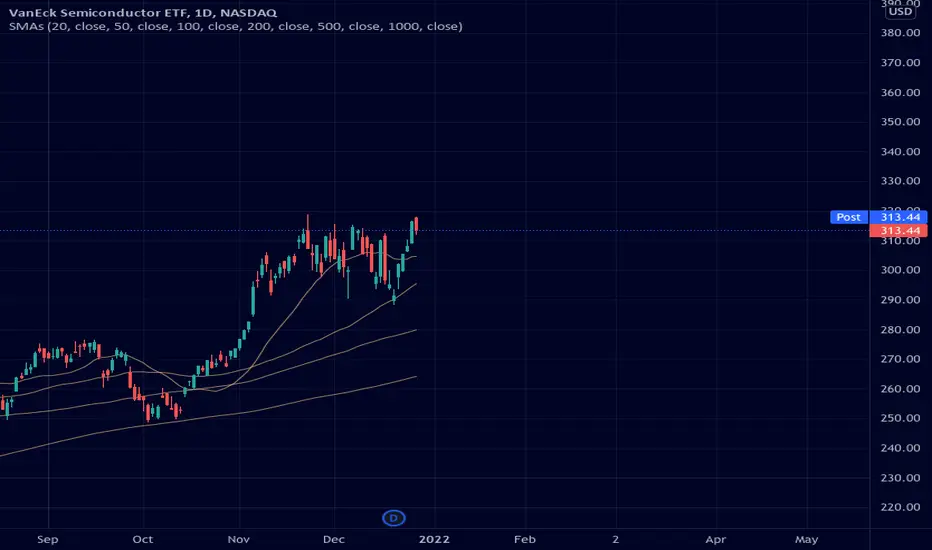
$SMH: Run 'Em AgainSemiconductors potentially looking at another leg higher likely to benefit in different types of markets. Names like ACLS, MXL, MRVL and others pushing to new highs
Semiconductors
$AMD Key Levels, Analysis & Targets$AMD Key Levels, Analysis & Targets
Let me know your thoughts…
-----
—
On the far right of the chart is my Average (Grey) Current Target (Green), and Next Level to add (Red) Percentage to target is from my average.
ONLY ADD at support levels & FIB levels… labeled (most of the time)
(Support=Green, Resistance=Red, Trendlines=Blue) Fib will be labeled if any and their colors will vary.)
I start every position with .5 - 1% of my account and build from there as needed and as possible.
I am not your financial advisor. Watch my setups first before you jump in… My trade set ups work very well and they are for my personal reference and if you decide to trade them you do so at your own risk. I will gladly answer questions to the best of my knowledge but ultimately the risk is on you. I will update targets as needed.
GL and happy trading.
IF you need anything analyzed Technically just comment with the Ticker and I’ll do it as soon as possible…

One ETF where you can short both EVs and Semis $IDRVOne ETF where you can short both EV and Semi $IDRV
- Overcrowded
- Trigger below $43 and waiting for a good set up formation

2/27/22 ONON Semiconductor Corporation ( NASDAQ:ON )
Sector: Electronic Technology (Semiconductors)
Market Capitalization: 27.464B
Current Price: $63.50
Breakout price: $65.35
Buy Zone (Top/Bottom Range): $60.30-$55.40
Price Target: $72.00-$73.40(1st)
Estimated Duration to Target: 49-54d
Contract of Interest: $ON 4/14/22 65c
Trade price as of publish date: $4.05/contract

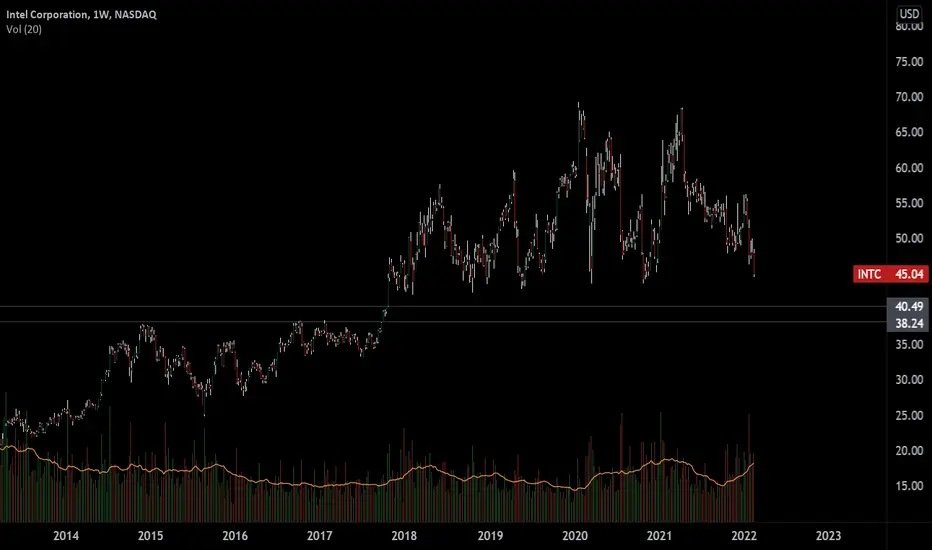
Buying at 38-40 rangeLooks like this is heading towards 38-40 range. It will be a good trading opportunity. Expecting a bounce then for a week or so.
SOXL bearish double top*disclaimer*
I haven't published anything outside of the crypto markets publicly. However, I have had my eye on SOXL, Direxion Daily Semiconductor Bull 3X Shares ETF.
I originally thought that earnings for NVIDIA were going to boost the asset and asset class, however it seemed to me the night before earnings that the earnings call was already priced in.
Looking at an 8 hour hollow candle chart here going back to fall 2021 makes the picture a bit clearer for me (when in doubt zoom out).
SOXL did a bearish double top between late November 2021 and early January 2022. And now volume is kicking up heavily on the sell side. Especially when current volume is compared to moving average for volume.
If the NVIDIA earnings call wasn't enough to lift, and rumors about auto manufacturers continue to slip in through the cracks, I see plenty of downside correction left for SOXL.
That being said, this is part technical and part "buy the rumor, sell the news" analysis and I will keep my eye on this sector which has been outperforming.

NVDA - Nvidia CorporationAdded another quarter position as we cleared and held above last week's high and as the broad market continues to follow through, bringing my average price up to $246.99.
SPY and QQQ both had another good follow-through day today off of Friday's pullback lows. Neither is in the clear, however. They're also both facing up against key moving averages; SPY approaching the 50-day line & QQQ pressed up against the 200-day line.

graphics cards still selling (NVDA)i dont anticipate the trade in semiconductors to slow down, and i think graphics cards are a safe bet to deliver value over time. nvda is expediencing somewhat of a turn around while the nasdaq lets up pressure. nvda should benefit from risk asset inflows.

ACLS - Axcelis TechnologiesWould like a pullback into the 50-day line to get long ACLS.
Just had a beat and raise report and has ran up on huge volume since. The growth estimates are very good and the company operates in what may be the best area of the market, semiconductors.

LongThe stock went down hard on the general market decline. After that, reversal formations began to form. I expect growth from the current 30%. Fundamentally, the stock is strong.
❤️ If you find this helpful and want more FREE forecasts in TradingView
. . . . . Please show your support back,
. . . . . . . . Hit the 👍 LIKE button,
. . . . . . . . . . . Drop some feedback below in the comment!
❤️ Your Support is very much 🙏 appreciated!❤️
💎 Want us to help you become a better Stock trader?
Now, It's your turn!
Be sure to leave a comment let us know how do you see this opportunity and forecast

#SMH and all semi plays#SMH is seeing increased bullish volume ( blueish nodes ) compared to bearish volume ( orange nodes ) on the volume profile sitting on a great spot ontop of a volume shelf with plenty of room to push to the top side if we can keep this trend so far don't dive into plays in current market ease into them to manage your risk as best as possible

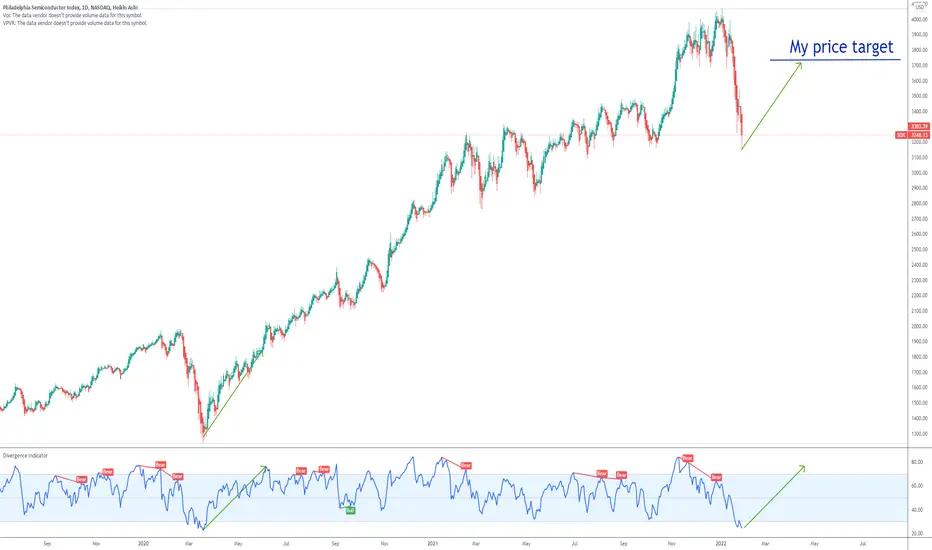
SOX PHLX Semiconductor Shortage won`t be solved anytime soon !!Secretary of Commerce Gina Raimondo:
“The semiconductor situation is going to take a long time to fix”
“This is one I feel confident saying it's not going to be fixed in a month or two, or six, or 12 months.”
For now PHLX Semiconductor (^SOX) is oversold and we can see in the chart what was the price movement after the last oversold area.
I expect to be the same now, since the semiconductor shortage won`t be solved anytime soon.
My price target is 3730.
Looking forward to read your opinion about it.
STM - is it about to start a new EW pattern and breakout?EURONEXT:STM
Might be a potential swing here. Currently trading at 4x its ATR and 4x its relative volume in the past 30min. Chart looks promising for bulls IMO. Support is the 200 MA on the daily so stop loss is TIGHT right now but the upside would be 52 if $46 is broken and held. I would look to NVDA and AMD though to see how the market is going to react to the semiconductor industry for context. Also a possible corrective wave C just ended and we are about to begin a new EW pattern.

Aosl Watching for shortwatching how long this is going to continue higher. looking for another short entry

$AMD downside prevails as long as $147.14 is resistanceOur view is negative until $147.14 pivot breaks to the upside.
The RSI is below it's neutral area of 50. The MACD is below its signal line and negative. Furthermore, price is below the 20, 50 and 100 day moving averages.

$AMD Pivot of $134.30Since our target prices were hit to the downside, we adjusted our pivot and support/resistance levels.
Our view is negative until the $134.30 pivot is broken

Semiconductors at long-term supportWhen looking at a weekly chart, it is easier to see if an asset is in a bullish or bearish trend.
Taking a look a the SOXX, we see we are at a potential place for a bounce.
I chose the 52 exponential-moving average because there are 52 weeks in a year, and it has worked very well in the past.
A close on a weekly basis below this level is the signal to get out. If we can hold though, it would be a strong bull case for a bottom.

Is Broadcom Seriously Oversold?Broadcom steadily advanced since the beginning of the fourth quarter, and now it’s had a dramatic pullback as sellers shred the Nasdaq.
The first pattern on today’s chart is the level around $544. It was a low on November 26 and again on December 2. Traders may look for it to provide support again.
Next, AVGO is oversold by at least two measures. Stochastics dipped even lower than their bleakest readings of 2020. Our Distance from MA script also shows price under the 50-day simple moving average (SMA) by 9 percent. It's the furthest since April 2020.
Speaking of SMAs, the chip maker is back below its 100-day SMA. The last time it touched that level marked the beginning of a sharp rally.
TradeStation is a pioneer in the trading industry, providing access to stocks, options, futures and cryptocurrencies. See our Overview for more.
Important Information
TradingView is not affiliated with TradeStation Securities Inc. or its affiliates. TradeStation Securities, Inc., TradeStation Crypto, Inc., and TradeStation Technologies, Inc. are each wholly owned subsidiaries of TradeStation Group, Inc., all operating, and providing products and services, under the TradeStation brand and trademark. When applying for, or purchasing, accounts, subscriptions, products and services, it is important that you know which company you will be dealing with. Please click here for further important information explaining what this means.
This content is for informational and educational purposes only. This is not a recommendation regarding any investment or investment strategy. Any opinions expressed herein are those of the author and do not represent the views or opinions of TradeStation or any of its affiliates.
Investing involves risks. Past performance, whether actual or indicated by historical tests of strategies, is no guarantee of future performance or success. There is a possibility that you may sustain a loss equal to or greater than your entire investment regardless of which asset class you trade (equities, options, futures, or digital assets); therefore, you should not invest or risk money that you cannot afford to lose. Before trading any asset class, first read the relevant risk disclosure statements on the Important Documents page, found here: www.tradestation.com .

$TSM | WEEKLY WATCHLIST 1/18$TSM 1D
Above $145, we can see continuation to $149-150 to complete wave 3.

All the relevant levels on TSMTSM is the most significant and more relevant chip manufacturer in the world. Probably you have one of these chips in the computer you are using right now or maybe in your car. With all that said, let's take a look at the most important levels on the current chart.
* Yesterday (13/01/2021), TSM made a new all-time high (ATH) after 307 days of corrections inside a flag pattern and a decline of 24.33%
* Flag patterns are continuation structures; this means that after the breakouts, we tend to observe new impulsive movements in the same direction as the previous one.
What we will do now is explain possible bullish and bearish resolutions based on the levels we have:
BULLISH SCENARIO: The price has 3 levels we can use to consider closing positions: First fibo extension, cloned channel, second fibo extension (useful for swing and position traders). Assuming the price replicates the previous impulse that started in April 2020 and finished in February 2021, we should expect a movement of 330 days towards 204 (where the 2nd fibo extension and the cloned channel converge). Remember that when you are looking for big and extended movements you need to be open to corrections during your trade or investment (for example, on key levels)
BEARISH SCENARIO: The price is not able to surpass the resistance zone created by the previous ATH, and from here we observe a bearish movement towards the next target we have, "The ascending trendline) at around 119
Thanks for reading! feel free to add your ideas on the comments ;) Have a great weekend.

$NVDA | UPDATE$NVDA 1D
Aligned with $AMD and $AAPL charts. Want one last leg lower to complete the corrective cycle.

$AMD | UPDATE$AMD 1D
Same view as Apple, looking for a potential reversal and 5 waves down to complete the corrective cycle in the low $120s.

Is Qualcomm a durable tech stock?Hi everyone,
Today we will talk about NASDAQ:QCOM , a semicunductor manufacturing company.
As we saw almost all tech stocks selling off from late November through to 2022, NASDAQ:QCOM managed to stay up there quite nicely.
The question to ask now: Is it lagging?
Will [ symbol="NASDAQ:QCOM"]NASDAQ:QCOM follow broad tech market and proceed to a major correction?
Or will it continue grinding higher?
Inasmuch as semdiconductor industry is carrying world's supply chain on its shoulders, I still think we could see a correction in the stock.
We've got a looming danger of Fed's interest rate hike somewhere in March-June this year.
I cannot believe any risk asset such as tech stock would stand still when it happens.
Putting macro stuff aside for a moment, we can see a similar pattern in the past of the stock price, where ATHs were reached, touching a rising trend resistence, which led to a rapid 26% correction and 260 days consolidation in the lower range.
I strongly believe that the conditions are ripe for the same scenario to repeat.
I will buy the stock after new consolidation pattern is established, preferrably near 150 level.
Please let me know if you found my macro rant useful and if you would like to see similar content in the future.
Trade wisely and good luck!
-----------------------------------------------------------------------------------------------------------------
Disclaimer!!!
This is not financial advise
