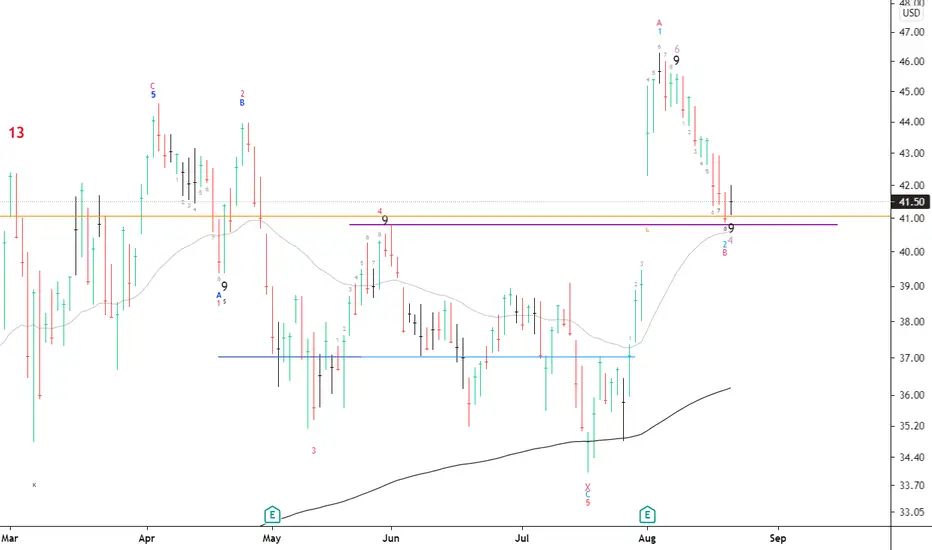
$ON very tradable 9pretty chart, bullish trade for next week. Semis will likely follow $NVDA if it breaks ATH
Semiconductors

MU looks good for a long positionSmall correction after earnings report
Now sitting on the strong level, looks ready to go higher
Good fundamentals
strong industry
Can go to the next resistance at 95

NVDA In Danger??Today I contemplated closing 75% of my long in NVDA as it is well in profit and I have much leeway right now to walk away and let a small amount ride. The reason for this is because NVDA has broken both a key upward sloping trendline as well as the .786 Fibonacci level on the daily and 4 hour time frames.
This does not have to be the end of the road for NVDA but it is not a bullish sign either to say the least.
It does appear, however, that Nvidia could be in for some short to midterm consolidation before regaining the needed momentum to break back above all time highs.
A few things that are good from a bulllish perspective is that a week ago we broke out of downward sloping resistance and managed to break and close fully above the .786 Fibonacci level not to mention we set higher highs in the process of doing that.
For this reason I am remaining in my long.. but there is a further issue. The issue is that we are in the process of putting in a macro lower high and this could be very bearish for the asset if it does not find bids this week and at the very least break back above $203. If not, a retest of the $198 price level could be very likely.
This entire range from $198 all the way down to $194 could be a great re-entry area for a long as there is much bullish confluence in this region which should provide for ample support.
It is this reason that I am remaining in my long. I will not be looking to add to my position should the price come down to the aforementioned price levels.. I will, however, remain patient by waiting and seeing if any bids come in at the green zone I have showing on the chart. If this green zone does not hold, I will be 75% out of the trade should we break and close a daily candle below the 0.5 fib level at $194.
Tomorrow's open and close on the daily chart could be telling. Keep in mind though, that the week has just started and NVDA has plenty of time to make up for the major, yet small ground it has given up to start the trading week.

AMD - Daily - Is Fibonacci really accountable???AMD chart, price advance beginning day to the sectional high, Fibonacci retracement calculation. Is this accountable?

On Semi - Blowoff Top - House of CardsOverhyped Ponzi Pogs. Same as the rest. Cash exit while you can. #chipwars

NVDA [Update]So far on NVDA we are still up nicely on our original idea and as we predicted NVDA is now putting all of our fib levels to the litmus test as it finds itself right in the middle zone of the entire fib retracement.
I expected the .383 to be properly tested before liftoff and so far it is holding up.
If it can continue to hold, NVDA will find itself breaking out once more as a bullish falling wedge is now being painted on the 4 hour timeframe.
One could debate if this is valid or not due to the breakdown out of its lower trendline, and that is fine. Because what we are most interested in is the upper trendline of the falling wedge as it appears to be serving as resistance on the price.
This is not something to ignore as supply lines like this can often be a warning of an impending bearish downtrend if price continues to fail when touching it.
So for this reason I am moving my stop losses up to around $189.79. The reason for this is because of not only the bearish trendline over our head, but because a breaking to the downside of the .382 fib level with a confirming candle on the 4 hour could mean a retest of much deeper levels at or around the bottom of the falling wedge or our .236 fibonacci level. So closing my position in profit and buying right back in at a discount is what I will be looking for in the near future.
In the meantime, however, I am still in my long but I am monitoring closely. NVDA will need to get moving and break the red trendline but ultimately put in a higher high in price by breaking the .618 fibonacci level over our head but that discussion will be kept reserve for a future post or update.

Is it too late too buy AMD?AMD has been rallying and with the chip shortage and increase market share by the company revenue continues to increase and debt levels for the company is dropping. $120-125 price range is foreseeable.

$AMD my team is up 35.8%*This is not financial advice, so trade at your own risks*
*My team digs deep and finds stocks that are expected to perform well based off multiple confluences*
*Experienced traders understand the uphill battle in timing the market, so instead my team focuses mainly on risk management*
Recap: Steadily increasing semiconductor demand due to current shortage will leave $AMD with fat profits during the next few market quarters.
My team entered $AMD on 6/10/21 at $81.10 per share.
Today we're exiting $AMD at $110.15 per share. My team is up a staggering 35.8% on this trade.
Congrats to those who took this trade with us.
ORIGINAL ENTRY: $81.10
CLOSING TRADE AT: $110.15
If you want to see more, please like and follow us @SimplyShowMeTheMoney

$QCOM in Ascending Triangle $165 PT The global chip shortage is still nowhere near over, making semiconductor companies very attractive here. QCOM is my top pick of the sector as they dont only benefit from the chip shortage they also benefit greatly from the roll out of 5G. The roll out of 5G will be sped up by US investment via the infrastructure bill which allocates $65b to broadband infrastructure. QCOM’s Snapdragon 5G chip is the most cost efficient chip on the market, which should continue to be in high demand as chinese firm Huawei is still banned in the US and UK which creates market share for QCOM given Huawei used to be one of the largest 5G chip manufactures before they were banned in multiple countries. QCOM has been trading in a clear ascending triangle pattern which historically implying further upside (72.7% of the time), QCOM should be able to breakout of this pattern and move higher. Trading at 20x (FWD) PE and a 2% dividend QCOM is trading at a very fair value, with great growth prospects making it a very strong BUY for me.

$SNE looks ready to play*This is not financial advice, so trade at your own risks*
*My team digs deep and finds stocks that are expected to perform well based off multiple confluences*
*Experienced traders understand the uphill battle in timing the market, so instead my team focuses mainly on risk management*
Recap: My team entered into $SNE at 92.33 after its correction from $118 down to $90.
$SNE currently sits at just $99.59 per share.
Current price action suggests that $SNE is gearing up for its next move up.
If you want to see more, please like and follow us @SimplyShowMeTheMoney

$MU June Update *This is not financial advice, so trade at your own risks*
*My team digs deep and finds stocks that are expected to perform well based off multiple confluences*
*Experienced traders understand the uphill battle in timing the market, so instead my team focuses mainly on risk management*
Recap: My team has been analyzing $MU for the past few months. After consolidating in the $74-84 range for the past few weeks we finally believe that $MU is ready to take its leap to go past $100. Investors should expect $MU to uptrend similarly along with other semiconductor companies in the near-future due to tech rebounding.
$MU is releasing their May quarter results on 6/30/21. My team remains just as confident as before in $MU and expect stock price action to benefit from this report.
My team entered $MU on 6/14/21 at $79.36 and still plan to take profit at $104.
Entry: $79.36
Take profit: $104
Stop loss: $75
If you want to see more, please like and follow us @SimplyShowMeTheMoney

$TSM Taiwan Semiconductor Manufacturing Company +200dmaTSM is looking quite positive on the charts. After correcting from $142 all the way down to $108, the stock managed to print a double bottom at 108 and hold higher. The stock is now also starting to make higher highs and higher lows on the daily which is bullish. Most recently we bounced just above the 200dma and the 50dma is starting to turn higher, still trading above its 200 day moving average. I kind of like the look of this setup..

Intel Corp.I love this companies financials. I understand what's going on in the semiconductor world. However, I'm thinking about consumer durables like laptops, computer gaming, memory and storage data. I'm not big on speculation but I know we are so dependent upon technology and alot of their products attack a wide range of technological factors.
Price is currently at a strong support in my opinion. On the 1 hour time frame, there seems to be to some strong consolidation in this same support area. This could indicate that Intel is currently in its accumulation phase. I've looked at some insider trading as well and noticed that within the last two months, there were purchase on two occasions around this area and a third person sold at $57... I want to see price breakout at some point to the upside as the previous high was broken and the previous support hasn't been reached yet considering a strong consolidation at its current support. Let's see what happens! I'm locked in til 2023.
Not advice
What do you think?

Vitrox, going south?Hi, this is my first idea publish. Would like to see feedbacks and comment on my idea. I see a trend reversal here. The price is currently trading under the bull support band. The band looks curve to toe downside, i see the price leaning towards the downside. Looking for it to hit the support at RM1.335.

TSM breakout + measured move The chart shows a descending triangle, with a breakout.
The breakout yesterday and today, have been on strong intraday volume.
A measured move can be made by adding the height from the double bottom (purple circles), to the area of the breakout. Using the green arrows to represent the potential move, which takes us to $152 approximately. Which is coincident with the extended move of the fibonacci retracement lines at 61.8%.
$135 and $142 are potential resistance zones, where we could see some profit taking.

MOTHERSON SUMILevels -
Buy - CMP
T1 - 250
SL1 - 230
T2 - 280
SL2 - 220
The stock has turned around from its interim support after dipping to the level of 232. It is expected to witness the levels of 240 and then 280 in short and long term respectively. The target levels and their corresponding SL's are listed above. The primary reason for this anticipated up move is the shortage of semiconductors in global markets required for manufacturing cars, laptops, etc. Motherson Sumi is one of the manufacturers with global clients. Demand for its manufactured products is expected to increase, resulting in to increase in the order book, thereby increased profits.
NOTE: These findings and levels are purely based upon the knowledge and understanding of the post publisher. The idea here is to predict the future price movements hence, please do not consider this as stock advice or recommendation.

Tight Squeezes Across the Chip SpaceSeveral chip stocks are squeezing into tight ranges with breakout potential.
Notice how Broadcom briefly knifed under its 50-day simple moving average (SMA) on July 2. (It followed an antitrust complaint.) The bears quickly surrendered, and a week later AVGO had its highest close since mid-April. So you have a false breakdown and a strong bounce outside of the range. That could draw some buyers from the sidelines.
That could be even more true now because the price channel has been abnormally tight, with Bollinger Band Width recently hitting the lowest level in 5+ years.
AVGO isn’t the only chip stock in that’s been treading water as business remains strong. Taiwan Semiconductor’s band width recently hit the tightest reading in a year. TSM also just bounced at its 50-day SMA, a line that was resistance in April but is now support:
Both companies have also been straddling their 100-day SMAs. TradeStation data uncovered that Lam Research , NXP Semiconductors and Teradyne also touched that line on Friday. ( Qualcomm and Microchip Technology were at their 200-day SMAs.)
It’s an interesting time for the industry because catalysts like 5G upgrades and chip shortages remain in effect. Sentiment recently shifted away from cyclical stocks like industrials toward growth stocks like software. But interest rates leaped on Friday as cyclical stocks rebounded. More cyclical strength could draw money back toward chips (which often follow industrials ). If that happens, these names resting along their 100- and 200-day SMAs could begin sustained moves.
TradeStation is a pioneer in the trading industry, providing access to stocks, options, futures and cryptocurrencies. See our Overview for more.

Micron Technology: The Spirit of 76?This week was cut short by Independence Day. That makes it a good time to view Micron Technology, which seems to have the spirit of 76.
The memory-chip maker had a false breakdown below that level on January 27. It quickly rebounded and returned to test $76 three times since mid-May. Interestingly, the current bounce is happening near the rising 200-day simple moving average (SMA) .
Meanwhile, resistance is bearing down from an intermediate-term downtrend. Notice the declining 50-day SMA (in red). Traders may want to watch for a potential breakout as these two moving averages converge from above and below.
Next, MU’s stochastics are oversold on both the daily and weekly charts. This, combined with apparent support at $76, may suggest downside is limited.
There could also be strong fundamentals with the global chip shortage continuing and more demand on the horizon as the 5G buildout continues.
TradeStation is a pioneer in the trading industry, providing access to stocks, options, futures and cryptocurrencies. See our Overview for more.

Time to Finally Sell NVDA?After a beautiful runup past all time highs weeks ago, NVDA has found itself in a similar position as the Nasdaq by hitting and getting rejected at the first fibonacci extension level.
I closed my long in this last week as I saw this level approaching and now it appears that a legit pullback may be coming into reality.
So I am bearish.. or am I?
Truth be told Nvidia is one of my favorite stocks, so I am aggressively watching for lower levels of re-entry and have been anticipating doing so for weeks now even as it ran up in price. I intend to load up and so I will be watching this closely over the coming days and weeks.
The best case scenario short term for Nvidia is that bulls can bullishly engulf and break above the key fib level and hold it as support on the weekly.
Until then, shorts or put options seem the most attractive bet in the immediate short term.

IBM More Downside?This is a short-term possibly bearish post within a longer term bullish play. Last week IBM closed out with a big 4.5% drop in one day after news of the CEO resigning. But was this the cause or was something larger perhaps in the chart in play here?
Well when we zoom out on the monthly chart, we see back in April this year IBM broke aggressively bullish out of the downward sloping green trendline and went straight to the 0.5 fib level around $153. What was missing on this move however, was a confirming retest of the green trendline. It appears the bulls were front runners of the price, and now the retest of the green broken trendline is still well in play. There is lots of bullish confluence where the price currently sits, however. So it will be interesting to see how IBM's price will behave both this week as well as the remainder of this new month. Right now is a decent area to nibble on a long but be on the lookout for a retest of the green trendline and keep stop losses tight as this has been a roller coaster of an asset.


$AMD my team continues to win*This is not financial advice, so trade at your own risks*
*My team digs deep and finds stocks that are expected to perform well based off multiple confluences*
*Experienced traders understand the uphill battle in timing the market, so instead my team focuses mainly on risk management*
Recap: Steadily increasing semiconductor demand due to current shortage will leave $AMD with fat profits during the next few market quarters. After correcting from its all time high of $99.23 $AMD now sits at $93.93 per share.
My team entered into $AMD on 6/10/21 at $81.10 per share. We averaged up on our positions at $81.64 on 6/21/21.
We trimmed our positions before close to secure profits at $93.93 per share due to our first take profit being hit.
Congrats to those who took this trade with us.
ORIGINAL ENTRY: $81.10
AVERAGED UP AT: $81.64
TRIMMED AT: $93.93
2ND TAKE PROFIT: $111.00
STOP LOSS: $76.00
If you want to see more, please like and follow us @SimplyShowMeTheMoney
