Semiconductor leader here strong during market turmoil $AMATSo, this chart looks fantastic for continued moves up. We can play with relatively tight stops and see what happens. I'm looking for another breakout of this range and see if there is some follow through.
If $SPY decides to tumble it may hurt this trade, but as it stands it looks fantastic and hasn't had much of a rejection during recent minor selloffs.
Semiconductors

$ACLS - Wave 5 underway...heading north of 50?Lots of interesting things happening here...
1) Ichimoku cloud on every time frame, from 30 min to weekly, showing green.
2) EW count shows what looks to be the start of a Wave 5. If we come down a bit and bounce from 37-38, that will be confirmation of W2 of W5. $38 is also the 21 EMA support.
3) The equal legs target of both W1 and W3 land at the 50% and 61.8% inverse retracement of W4. This shows price confluence around $50
4) The pitchfork median should act as a magnet and once we cross the $41.20 high, we should continue to the top 0.5 and 1 band
5) The Fib time extension shows a 1:1 extension in mid June right around where the W3 and W1 equal leg targets finish (the two grey rectangles)
6) Hidden bullish divergence....price is making higher lows as RSI makes lower lows
7) MACD on daily timeframe has just flipped green with bulls in control.
8) Earning coming up on May 5, so we could see an early run up to earnings, especially since the FIb time 1.618 level is around there too.

NXPI - trade idea if NXPI can hold the trend the line on the 1 HR I believe it will continue to push higher however it does have some bearish indicators such as decreasing momentum and a bearish cross on MACD. if it fails to hold the trend line I believe it can drop to the nearest resistance. the 4 hr looking somewhat bearish but the 1 day looks bullish overall.
*NXPI Is being added to SP500...can cause short term pop.
In summation, bullish very long term, possibly bullish short term only if we hold the trend line. If not, bearish short term, going to wait the first hour or so to see which direction we take.
as always do your own analysis before placing any trade
this is for education purpose only and is not investment advice.

3x inverse funds as a contrarian indicator3x inverse ETFs let you use leverage to bet against stocks. This chart shows the 14-day Money Flow Indicator (MFI 14) on a 3x inverse semiconductor fund (SOXS). SOXS is an inverse leveraged bet on the SOXX semiconductor ETF, which is also shown on the chart.
Interestingly, the flow of money into and out of SOXS has often been a contrarian indicator of where SOXX is headed. SOXS gets big inflows just as SOXX hits bottom. It gets big outflows just as SOXX hits top. If you do the opposite of whatever SOXS traders are doing, you can do pretty well.
SOXS made a peak on Friday that may imply that SOXX has bottomed and will begin to move up. Short SOXS or long SOXX would be the play here.

consolidation phase over for AMD, go longIt has reached the bottom of the parallel channel and is bouncing back up to retest resistance.
It has consolidated for a good amount of time and has formed a bullish pennant and looks ripe for a pop.
Buy AMD with both hands, this thing is going to $100.

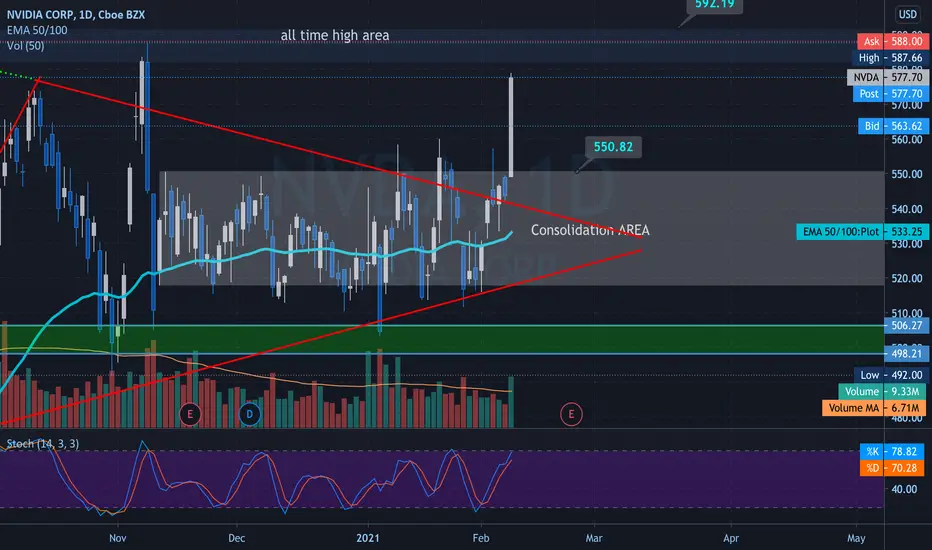
Can Nvidia Climb a Wall of Worry?Nvidia has gone nowhere since the summer, but now the chart may be lining up for another push to the upside.
The first pattern is the series of higher lows beginning in early January, plus a new all-time high in February.
Next, the most recent low of around $528 is almost exactly the middle of its four-month range. After consolidation on either side of that line, has it now become support? Interestingly, NVDA had a large, high-volume drop on Thursday to that price area – but there was little follow-through to the downside.
Third, as prices inch back from Thursday's selloff, they’re trying to bounce at both the 50-day and 100-day simple moving averages (SMAs).
Finally, stochastics have dipped toward oversold territory.
The fundamental story is mixed. On one hand, results and guidance crushed estimates last quarter. On the other hand, investors are worried as NVDA’s pending acquisition of Arm hits a series of regulatory hurdles.
Given the strong earnings and broad outperformance in the chip space, will prices now climb the proverbial "wall of worry?"
TradeStation is a pioneer in the trading industry, providing access to stocks, options, futures and cryptocurrencies. See our Overview for more.

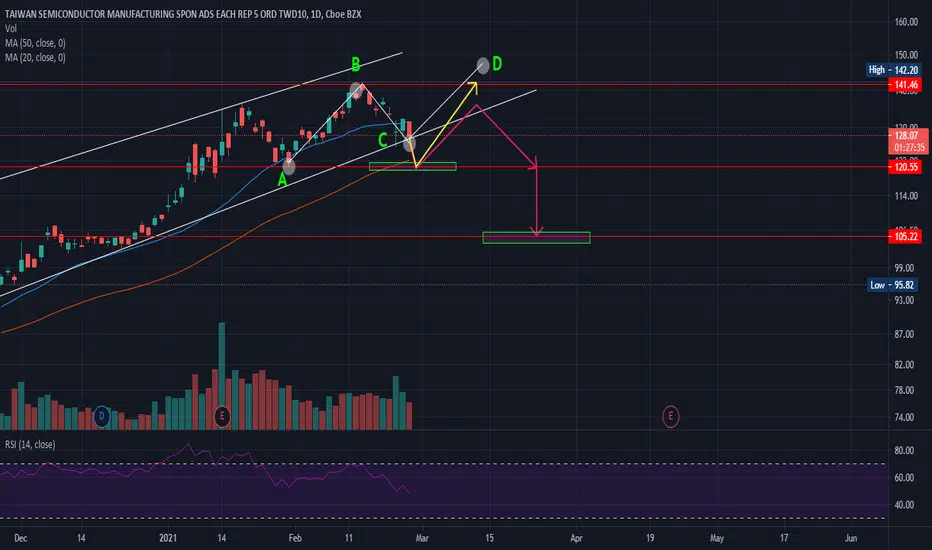
TSM possible scenarios...patience will be crucial with TSM...
1.) Scenario that we can looking for setup is "ABCD" pattern where right now we are in (C) point and that is good setup for buy ... but ...
2.) But as we can see with pink color, if price come down on point (A) we will looking, will the price do a "head and shoulder" and than that will be good setup at price by approx. $105.22
3.) And with yellow color we can see If the price come at point (A) and just bounce back in "ascending triangle" and make ATH we will looking for resistance brake and setups for buy.
Thank you for reading, and this is not purchase recommendation... Push like button or comment if you like this analysis or if you have some your view. :)
NYSE:TSM
MCHP on the move!Who is gonna win this battle: cup and handle or rising wedge ?
MCHP made a nice “buy the dip” on Tuesday creating a “cup and handle” pattern that combined with the ABCD pattern gives a forecast for a possible target price at point (D).
If that happens, MCHP will break the resistance line and go into a new trend which it will then surely test again.
Of course you should also keep in mind the rising wedge and be careful. But on my opinion bears are not strong enough to push the price down at the moment, but in any case it remains to be seen how this battle will unfold and be ready for buying setups.
Thank you for reading this, and if you have some comments there are more than welcome, also feel free to press like button if you think this is a interesting and good analysis :)
NASDAQ:MCHP

AMD = bullishIf we have microchip shortage on our mind, then this dip will be good if we look for buy set up in the target area with momentum that will be good.
On monthly chart AMD gives us Rising wedge so we need to be careful in that aspect, but overall AMD is new growth company with interesting growth forecast.
Thank you for reading, any comment are welcome. :)
NASDAQ:AMD

BUY NVDA 2.19.2021Any dip buy around these levels makes sense. Hold NVDA long term. Earnings on 2/24/2021 could be affected by semiconductor shortage.

BUY TSM 2.19.2021Long term holding for TSM makes sense. Any small dip buy makes sense to hold long term.

MU Micron Finally set up for new All-Time Highs and Mark-upMU has reclaimed the high trend lines in the overall uptrend and price target projections are projected in price and period of time expected highs can be reached

The indexes were stuck at the resistance. IS THE FALL COMING? 👇The main US indices - SPX ( S&P500), IXIC (NASDAQ Composite ), SOX (semiconductor index) and DJI (Dow Jones Industrial Index) have reached or almost reached the resistances of their old channels. A downward reversal of one index will pull everyone along. The "close all positions" button is ready.
SPCFD:SPX // NASDAQ:IXIC // NASDAQ:SOX // DJCFD:DJI

Big Gains On Intel 2021? Hard To Say!With the chatter over US supporting semi-conductor manufacturers, looks like Intel could be ready for another massive generational leap.

Semiconductors ~ ascending triangle Technical Analysis
We have formed an ascending triangle (purple lines). If we make a measured move from the breakout, it takes us up to $275 target approximately.
21ema has been working very well as a trend following system.
OBV has been supportive of the trend.
Fundamental Analysis / News
1. Ongoing reports talking about demand for semiconductors outpacing supply, particularly from the auto makers.
2. A Reuters report that indicates CEOs of leading U.S. companies are urging the Biden administration to provide incentives to build more factories in the U.S. in order to win back market share and help mitigate risks to national security.

MRVL ER run up MRVL Technology is a semi conductor company that has been lagging behind this week with other semis like NVDA having nice rallies. Great company with continued growth in the 5g and cloud computing segment. Looking at this for a potential swing with ER approaching early March. In a nice uptrend since the pandemic hit and currently in a 2-3 week downtrend channel to complete a nice bull flag. Watching for a breakout of the downtrend with a significant increase in volume for a confirmed reversal. Looking for a break and hold above 51.60 for an overall move up to retest ATH at 55.80. Over that I'm looking at a push to my wave 5 target at 62.
Ways to Play this
1. Buy Shares and hold long term - low risk low reward
2. Load on the dip before the rip (load zone: 48-51), scale in with option contracts w/ couple month out expiration
3. Wait for the breakout (confirmed reversal) of 51.60 to load up couple month out contracts
Options to consider
55C 3/19 1.84 (low risk: medium reward)
50C 2/19 1.66 (medium risk: high reward)
51C 2/19 1.15 (medium risk: high reward)
55C 2/19 .23 (Lotto)

Buy setupContinuation Trade
Reward/Risk: 2/1
Entry: 141.43 or at a lower price
Stop: 127.00
Target: 170.00

$THBR Wedge Filling Nicely. Look To Retest $12.75 area.$THBR Wedge Filling Nicely. Look To Retest $12.75 area. Any Positive Catalyst's Could Help Break Through To Our Next Leg.

Cirrus Logic Pulls Back to Key LevelsCirrus Logic began 2021 with a breakout to new highs. Now it’s pulled back to some potentially interesting levels.
First, Thursday’s close around $86 is near the old peak in January 2020. Will old resistance become new support?
Second, CRUS has returned to its 50-day simple moving average for the first time since it started running in late September.
Third, stochastics are deeply oversold.
CRUS relies heavily on Apple iPhones as an end market. It initially tried to rally on January 28 after AAPL’s blowout results, and was swamped by bearish short-term momentum. Strong quarterly results two sessions later were also ignored.
The iPhone cycle and semiconductors in general have been very strong. CRUS may need some time to stabilize, but trend followers will be watching to see if it holds this zone and the 50-day SMA.
TradeStation is a pioneer in the trading industry, providing access to stocks, options, futures and cryptocurrencies. See our Overview for more.


Bullish On Semi's? Go Long $SIMO.I'm bullish on semi-conductor stocks. Especially small & mid-cap names. Check out Silicon Motion Technology. I like the set up here.
P/E = 17.73
EPS Growth = 483%
Nice entry point IMO.
New to charting. Let me know what you think?
Thanks.

