Intel: Bullish Gartley with Bullish Divergence Targeting $64.19Leading to the most recent earnings report, Intel had reached a 61.8% retrace from High to Low and was showing signs of reversing, so I decided to take profit on Intel. Now, upon spotting a potential trend continuation Bullish Gartley I now think it's possible for INTC to recover from here and perhaps go all the way for the 0.886 at $64.90, so I will be buying back in at these lower prices.
For context on the previous bullish setup, check the chart below:
Semiconductors

AVGO Chipmaker in an ascending channel SHORTOn a 30-minute chart, like several other computer chip manufactures has approached or
reached a near-term top. Overall Broadcom has gained 19% YTD. Earnings are in about two
weeks. I see this as a short trade to follow AVGO from the top of the channel down to about
1225 in time to catch earnings at the bottom of the channel to end the swing trade and instead
go long from there. I intend to close the trade two days before earnings and flip sides
hunting the beat on the earnings.

Besi Ride High on AI Chip Demand Surge: Quarter Targets ExceededBesi ( EURONEXT:BESI ), the Dutch chipmaking parts supplier, has recently surpassed fourth-quarter targets, buoyed by soaring demand for its cutting-edge hybrid bonding technology and AI-enabled computing applications. This surge in demand underscores a broader trend of chipmakers ramping up capacity to meet the insatiable appetite for AI-driven solutions across various industries.
The fourth-quarter performance unveiled by Besi ( EURONEXT:BESI ) has been nothing short of stellar. The company reported a remarkable 30% rise in quarterly orders, amounting to a staggering 166 million euros ($180 million). This surge in orders is primarily attributed to the burgeoning demand for hybrid bonding, a pivotal technology in chip packaging essential for AI applications. Notably, hybrid bonding orders nearly doubled during this period, with a significant portion earmarked for Besi's most advanced systems.
Besi's ( EURONEXT:BESI ) impressive clientele, which includes industry heavyweights like TSMC, Intel, and Samsung, underscores the company's pivotal role in the semiconductor ecosystem. These key players have been increasingly adopting Besi's ( EURONEXT:BESI ) advanced chipmaking tools, further solidifying its position as a frontrunner in the sector.
The positive momentum extended beyond Besi ( EURONEXT:BESI ), with sector giants like Nvidia also posting upbeat results and forecasts. This collective optimism has propelled shares of associated companies, including Tokyo Electron, Aixtron, Infineon, ASML, and ASM International, reflecting the broader bullish sentiment surrounding semiconductor manufacturing.
Looking ahead, Besi ( EURONEXT:BESI ) remains bullish on its prospects, foreseeing further growth in the hybrid bonding market and other advanced packaging technologies. To capitalize on this momentum, the Amsterdam-based company is expanding its footprint beyond China, with strategic investments in Malaysia, Singapore, and Vietnam. This strategic diversification not only mitigates risks associated with geopolitical uncertainties but also aligns with the evolving landscape of semiconductor manufacturing.
Despite the stellar performance, Besi ( EURONEXT:BESI ) remains cautiously optimistic about the near-term outlook. CEO Richard Blickman acknowledged the uncertain trajectory of the recovery in 2024, citing restrained demand for mainstream applications and weakness in automotive end-user markets. However, industry analysts anticipate a rebound in the market between 2024 and 2026, driven by recovery in mainstream assembly and Chinese markets, alongside the burgeoning demand for AI logic, memory applications, and advanced packaging.
In conclusion, Besi's ( EURONEXT:BESI ) exceptional performance in the fourth quarter underscores its resilience and innovation in the dynamic semiconductor industry. With its pioneering technologies and strategic expansion initiatives, Besi ( EURONEXT:BESI ) is poised to capitalize on the burgeoning demand for AI-driven solutions, positioning itself as a key player in shaping the future of chip manufacturing. As the industry braces for a period of recovery and expansion, Besi ( EURONEXT:BESI ) stands at the forefront, driving innovation and powering the next generation of transformative technologies.

NVDA to AMD Ratio Comparative ValueHere on a daily chart I have the ratio of shares of NVDA to AMD and so the market caps
proportions. From September 2022 and for a year NVDA rose more than AMD and so the ratio
rose. From September 2023 to January 2024, NVDA fell as compared with AMD perhaps because
AMD's rate of rise on a percentage basis exceeded that of NVDA. Since the first of the year,
the ratio is rising meaning NVDA is gaining share price faster than AMD. If a trader could switch
between these, the ratio represents a way to determine which to sell and which to buy at any
given time. Right now, NVDA is the buy until the ratio curve reverses.

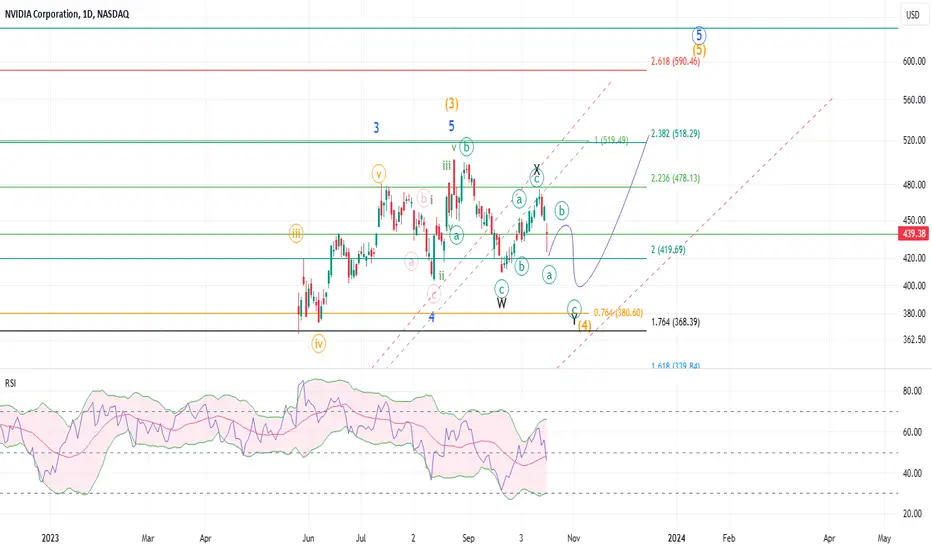
NVDA: the sky didn't fallIf you have taken advantage of the 20% drawdown in Aug-Sep, then a 16% rally this month, then congrats to you. Right now, the final leg of correction is in progress before the next bull run starts. Today we might have seen the sharp a wave of Y. Things might slide a bit more, but a bounce should be incoming. After the bounce we should see the final leg down, when everyone and their mothers will scream head and shoulders. But, most likely that will not play out the way bears want. Sure, there a lot of room to fall, but NVDA is in a very strong position despite the political drama. If things go down, my bet would be that one of the fib support areas will hold and price will make another ATH by Q1 next year. As for my trading plan, I will sit this one out and wait for a bullish confirmation to enter, rather than shorting this right now.
SOXL / SOXS , this ratio analysis shows when to trade eachSOXL is the triple leveraged semi-conductor ETF while SOXS is its inverse. While SOXL
is primarily up trending in its intermediate and full-time history, it does from time to time
have a correction mainly when the technology sector gets challenged. I have found that
plotting the ratio of the share values is a very accurate way of pinpointing those corrections
and temporarily buy some SOXS to offset the downward price action and nullifying any
loss. This is more or less insurance in case the overall position must be closed for one reason
or another or transient hedging. As can be seen, these corrections last 1-5 days . This strategy
is effective risk management as during the correction the SOXS gains some of what SOXL
loses especially if the share dollars are equally balanced. Ever better is the same thing on
a 2-3 hour time frame albeit it with more hedging trades.
I have found that this strategy works on a variety of inverse ETF pairs. Most of them however do
not have one side going up more or less continuously and instead oscillate rather than simple
and shallow corrections like this pair. Please give a like if you this this could be helpful to your
trading.

AMD Beautiful Consolidation into PennantAMD is consolidating really nicely after making new highs in late January. Surfing the 20 EMA on the daily chart as well. This will be a top focus for me heading into next week.

How to BRR 101Refer to my prev AMD post back in Jan for credibility - I predicted run to 158-165 when it was in the 130s (result: ran to 180s).
Now we have a buy the dip opportunity after earnings sell off. There is still too much demand for this to tank yet, it wants one more high (at least).
Path to targets is the solid black line. Bullish channel its respecting is the dashed blue channel, every time it dips outside of that it gets bought up fast:
- Initial target = 187.50 by 2/9/2024
- After that hits it will pullback to around 176
- If 176 can hold as support it will make one final run to 192-199 by early March 2024
Trailing Stop loss is 2 consecutive closes below the dotted red line.
Entered Feb 16 175 calls for 3.50 on 1/31/2024 (underlying 167.67)

Nvidia - How Long Will It LastHello Traders, welcome to today's analysis of Nvidia.
--------
Explanation of my video analysis:
All the way back in February of 2014 we saw a breakout of a long term symmetrical triangle on Nvidia. This breakout was followed by an insane +9.500% rally towards the upside. Right now Nvidia is trading in a solid ascending channel and is approaching the upper resistance trendline. I do expect a (short term) pullback from there to retest the support mentioned in the analysis.
--------
I will only take a trade if all the rules of my strategy are satisfied.
Let me know in the comment section below if you have any questions.
Keep your long term vision.

AMD chart update, EXTENDED LINES EDITIONChart update, charts linked.
If you're buying long after 171, I warned you.
Orange is Support and future rejection trend.
If we close the week over 137.09
bullish.
39 gonna hit you like a truck if you're not out before the drop (Feb/March maybe, time frame is hard to predict, but I assume the drop ends sometime around May or June.)

AMD EXTENED LINE'S EXTENDED LINE EDITION (CONTINUE OR FALL)If you've been following me with AMD, we're pretty much out at this point, as we've been targeting the trade since 93, and there isn't much point to miss a few extra percentage points on the topside at the risk of losing all or much of the profits.
HOWEVER, there are still trades to the topside, as far as trades heading to the bottom side.
Marked in thick green and thick red are the TWO STRONGEST support and rejection trends I could find. Do more exist? Maybe, but you'll need a better analyst that me to find those.
Light red are steep support trends that have been building on top of each other (stacking)
Think of this like a skyscraper being built.
All indicators point that we are nearing a top. However, this means nothing as short term indicators can theoretically keep pumping the price over the long term targets, which would see numbers at 200+
Notice the time frame of the chart, 2h, meaning it won't last for more than a couple weeks and you'll likely have a whole new set of trends.
A move like this into earnings is going to be the big question.
179
189
are two really strong rejection lines. May not be exact, but close. You really need to analyze in real time at this point because move will happen faster and faster.
I would say, should the price not hold 171.00, I would wait to see what happens in the short term, and try and buy the dip if it occurs pre earnings, with a potential trade before, on or right after earnings. I would then be waiting on topside for a short entry rather than pushing my luck as a bull.
If you follow me with trades, you'll know that we essentially speak in probability. Meaning, at or above 189, I'm more likely to screw up than make a good trade, and if I screw up, there is a lot of downside showing, which will do absolutely nothing to cover the mistake (loss). Having said that, if you're a short term trader and familiar with short term trading, yes there are absolutely still chances to trade above this level should it occur.
We would also say, there is a better than average chance that should I wait for some of these topside targets to hit and enter short, I have a better than average chance to both profit, and make more overall money, than trying to time out more really short term trades.
It's all about profitability, risk, percentages, and patience. Waiting for the RIGHT trade IS 1000% better than jumping into a trade you missed because you have FOMO.
There will almost always be another buy, there will almost always be another stock moving up the percentage you missed. Idk, what it would be called in formal terms, but I call it the sniper strategy.
Good luck!!
I've attached all previous AMD charts to this chart.

SOXL Wedge Tightening Looking for a BreakoutTaking a stab at SOXL for a reversal here. Tightening down in a wedge for the last week. After semis had been making new highs. Relatively oversold RSI on the 65min and MACD about to flip bullish on the same timeframe. Active trade. In @ $31.99, target $36

QCOM: Bearish Hammer at Resistance on the Weekly TimeframeThere is a Bearish Hammer at weekly Resistance on QCOM with the RSI pushing back down from its second test of the overbought level. This seems like Bearish RSI BAMM that could lead to QCOM coming back into the support range around $120. As a result I'v decided to open Bear Call Spread spreads on QCOM to offset my Bullish AMD Call Spread.

Cup with Handle on IBM Attempting to Break $140 Resistance LevelWe have a nice looking Cup with Handle on IBM and it's currently Challenging the $140 Psychological Resistance Level, if it can get above that i think we will see IBM's stock price push towards the $175-$180 measured move. On a side not i also believe the Dow will be the strongest performing Maor US Index and reach all time highs before any other index and that IBM will be one of the more major stock leading the way along with Microsoft and Intel.

AMD - All Time HighHello Traders, welcome to today's analysis of AMD.
--------
Explanation of my video analysis:
In 2016 AMD broke out of a long term triangle reversal pattern. This breakout was then followed by a pump of +5.000%. After the 2022 pullback of 70%, perfectly retesting previous structure, we are not certainly back to a bullish market on AMD. If we see a retracement back to the structure mentioned in the analysis, I am certainly looking for more long setups on AMD.
--------
I will only take a trade if all the rules of my strategy are satisfied.
Let me know in the comment section below if you have any questions.
Keep your long term vision.

Wolfspeed Forge Strategic Alliance to Power the FutureInfineon Technologies AG (OTC: OTC:IFNNY ) and Wolfspeed, Inc. (NYSE: NYSE:WOLF ) have extended and expanded their long-standing silicon carbide (SiC) wafer supply agreement, first established in February 2018. This strategic collaboration aims to meet the soaring demand for SiC semiconductor products, particularly in sectors such as automotive, solar, electric vehicles (EVs), and energy storage systems.
A Pioneering Partnership:
The extended partnership solidifies Infineon's commitment to a multi-source strategy, ensuring a reliable supply of both 150mm and 200mm SiC wafers. This approach supports the growing adoption of SiC-based power solutions, renowned for enabling smaller, lighter, and more cost-effective designs with superior energy efficiency.
Jochen Hanebeck, CEO of Infineon Technologies, highlighted the significance of the two-decade-long collaboration with Wolfspeed ( NYSE:WOLF ) in advancing SiC technology across automotive, industrial, and energy markets. The partnership stands as a pivotal element in promoting decarbonization through energy-efficient technology.
Wolfspeed's Role as a Catalyst:
Gregg Lowe, President and CEO of Wolfspeed, emphasized the company's role as a catalyst in the industry's transition to SiC. Wolfspeed, recognized as the world leader in silicon carbide production, plays a crucial part in supplying high-quality materials to key customers like Infineon. With an eye on the future, the company aims to scale its capacity footprint to meet the burgeoning demand for SiC devices and supporting materials.
The SiC Revolution:
The adoption of SiC-based power solutions is witnessing rapid growth across diverse markets. These solutions empower smaller, lighter, and more cost-effective designs, unlocking new possibilities for clean energy applications. Industry estimates predict substantial growth in demand for SiC devices and supporting materials through 2030, representing a staggering $20 billion annual opportunity.
Infineon's Supply Chain Resilience:
As the demand for SiC devices continues to surge, Infineon's CEO, Jochen Hanebeck, affirms the importance of following a multi-source strategy to secure access to a high-quality, global, and long-term supply base of SiC wafers. The extended partnership with Wolfspeed is a testament to Infineon's commitment to supply chain stability and resilience in the face of growing demand.
Looking Ahead:
The strategic alliance between Infineon and Wolfspeed is poised to address the increasing demand for SiC devices, playing a pivotal role in applications ranging from electric vehicles to renewable energy solutions. The collaboration sets the stage for a silicon carbide odyssey, where advancements in technology will drive the transition towards cleaner, more efficient energy solutions.
Conclusion:
As the semiconductor landscape undergoes a transformative shift towards SiC technology, the extended partnership between Infineon and Wolfspeed ( NYSE:WOLF ) emerges as a beacon of innovation and collaboration. Together, these industry leaders are not only meeting the current demand but also shaping the future of energy-efficient technology, marking a significant milestone in the journey towards a sustainable and decarbonized world.

NVDA: Bearish ABCD above the Trading Range Targeting $272.42NVDA has risen above the trading range but has started to print weaker Bearish candlestick patterns on the Daily as it approached the PCZ of a potential Bearish ABCD pattern. At this point in time it seems like NVDA will fall short of $600 then come back down to its last official support level which was at $272.42, if 272.42 doesn't hold then it could go into the one hundreds or even below $100 to around $80 but $272.42 is the main target.

Nvidia - Higher, Higher And HigherHello Traders, welcome to today's analysis of Nvidia.
--------
Explanation of my video analysis:
All the way back in 2014 Nvidia broke out of the long term symmetrical triangle formation and entered a crazy bullrun. With the current channel formation on Nvidia, there is a high chance this stock will push higher even more to retest the upper resistance mentioned in my analysis.
From there I do expect a correction which could be similar to the one of 2022.
--------
I will only take a trade if all the rules of my strategy are satisfied.
Let me know in the comment section below if you have any questions.
Keep your long term vision.

NVDA at the CES Ahead of Earnings Next MonthNASDAQ:NVDA moved up on the excitement around AI at the Consumer Electronics Show. We can see that Professional Traders were anticipating a breakout.
The stock should be able to begin some pre-earnings runs soon, as long as revenues and earnings continue to improve.
Volume Oscillators and Money Flow Indicators have been improving as Derivative Developers continued to increase inventory.

SPELS Semiconductor about to "Spell-Out" MagicSPELS Semiconductor is one of the first stock in India venturing into the Semi-Conductor space and with the recent push for Make-in-India scheme and the Growing demand of Semi-Conductor worldwide + the Anti-China policy (China+1) adopted by many countries, India has become a Favourite Hotspot for Semi-conductor manufacturing
Let's look at the Technicals of SPELS:
Getting ready to Blast. 3 Amazing Bullish Structures
1. Monthly - Large C&H - BO above 105 WCB for target of 200++ (2x opportunity)
2. Weekly - Inv H&S - BO already done target 99
3. Daily - Flag Pole BO - Happening - buy above 80 WCB for Target of 102
Each lower timeframe BO will take to the next Higher Timeframe BO zone. Multibagger pick. already 40% up from our Recommended Levels
Disclaimer:
3+ Years Teaching Experience in Stock Market - Technical Analysis, Advanced Patterns, Emotional Management, News based Trading...
We are NOT SEBI Registered
Our focus is NOT providing Buy/Sell Recommendations/calls
Primary Objective is to provide detailed analysis of how to review a chart, explain multi--timeframe views purely for Educational Purposes.
We strongly suggest our followers to "Learn to Ride the Tide irrespective of its Side"
*** Important *** Consult your Financial Advisors before taking any positions
If you like our detailed analysis, please do rate us with your Likes, Boost and share your comments
-Team Stocks-n-Trends

AMD - Approaching All Time HighsHello Traders, welcome to today's analysis of AMD.
--------
Explanation of my video analysis:
After the massive breakout in 2016 we saw a rally of more than 4.500% on AMD. This rally was perfectly followed by a correction of 70% in 2022. As mentioned in my analysis, I am now waiting for a retracement back to the previous structure and if we have enough bullish confirmation, I will then look for potential trading opportunities.
--------
I will only take a trade if all the rules of my strategy are satisfied.
Let me know in the comment section below if you have any questions.
Keep your long term vision.

#NVDA ready for another push higher? Techs look sexyNvda.. couple of reasons why this is a big level and high probability to be long
(1) Divergence on RSI
(2) Test volume VPOC shelf and held
(3) Demark 9 exhaustion signal on daily
(4) Gliding off the 50dma
(5) Held 50% fib from most recent swing low and high
(6) Back above the Main Pivot
Putting this all together suggests there is a high probability setup here with a stop below the recent lows at 450. Initial targets 480, 500, then if we break out the channel , much higher..

ARM: Good Share, Bad DerivativeOverview
Arm Holdings PLC ( NASDAQ:ARM ) recently had its IPO back in September 2023. Since then it has bounced around between $46-$78 and I think it's gearing for a rally. Unfortunately there is not much room for a confident technical analysis because of ARM's minimal chart history but I believe this company is definitely worth adding to the Watchlist.
ARM supplies semiconductor technology and has made it a company mission to lower carbon emissions. From my understanding they are attempting to lower their technology's carbon footprint by maximizing the processing power of their chips per every one watt of energy. Imagine this as the equivalent of increasing a vehicle's total miles per gallon (MPG).
I have come under the impression that their technology is delivered to a plethora of companies including NVIDIA and Google who, in turn, use it to develop A.I. projects. It is this aspect that makes me speculatively bullish on the company's outlook.
Speculative Projections
According to their official website ARM technology can be found in nearly every modern device and is used by "70% of the world's population."
ARM's market cap currently rests around $69 billion USD which places it around 1B shares. Since its technology is fueling what is essentially an artificial intelligence bubble within the stock market, it is my personal opinion that a $500B market cap is reasonable if not conservative. This would place ARM's share price around $500 which is a 631% upside from the current share price of $68.34.
If you read my other idea on NVIDIA, I've mentioned that outsourcing may become an issue for NASDAQ:NVDA and so I believe that ARM may be able to fill that vacuum should a semiconductor crisis ever occur. A catalyst like this would definitely have the potential for propelling the stock to new highs.
Risk Management
If picking a good company out of a lineup wasn't enough, now the potential gains to losses needs to be considered. For every dollar risked, I believe at least three dollars should be the reward. With ARM I believe those types of gains are possible however this is the one of those exceptions where I would consider holding shares instead of trading derivatives.
I picked through several option contracts, specifically Calls, and noticed that Open Interest was severely lacking on most contracts except for a few expiring within 90 days. Typically 90 days would suffice however with the lack of trading patterns -- and a sense of direction -- I believe this makes derivative trading too risky for ARM. To top matters off, the contracts with high open interest (>1000) would potentially only deliver 1:1 at best case scenario.
All that said, the lack of direction and amount of share value that would have to be gained within a short period of time leads me to believe that investing in ARM Calls would be reckless. The Calls worth owning and that have an expiration greater than 6 months out have a near non-existent Open Interest. While that could always change if ARM starts getting some attention from the market, this may lead to illiquidity and an inability to unload the contract.
Fundamental Analysis
Current ratio (current assets / current liabilities) = 4.33
* Any ratios under 1.00 are considered a financial risk.
Retained earnings = $2.440B which was a slight decrease from $2.457B in March 2023.
* Allows the company to invest in itself (repurchase shares, expand, etc)
Net income 6 Months Ended September 30 = ($5M) loss
* The majority of the loss appears to have come from escalated operating expenses
within the second quarter. This is a drastic 101.5% decrease from September 30,
2022 which had a net income of $339M.
I'm experiencing some difficulty interpreting the Q2 Earnings Call. I am a self-taught analyst and learn on-the-go so I will need to process this information more before coming to a confident conclusion on the fundamental analysis. However, it does seem that operating expenses increased significantly (approximately by 171.8%) in the second quarter alone.
I will make sure to provide any updates to my findings as a comment on this idea.
