Sensex long setupSensex long setup
Entry - 80651
Stop loss - 80528.00
Target - 81093
Risk Reward - 1:3.6
Sensex

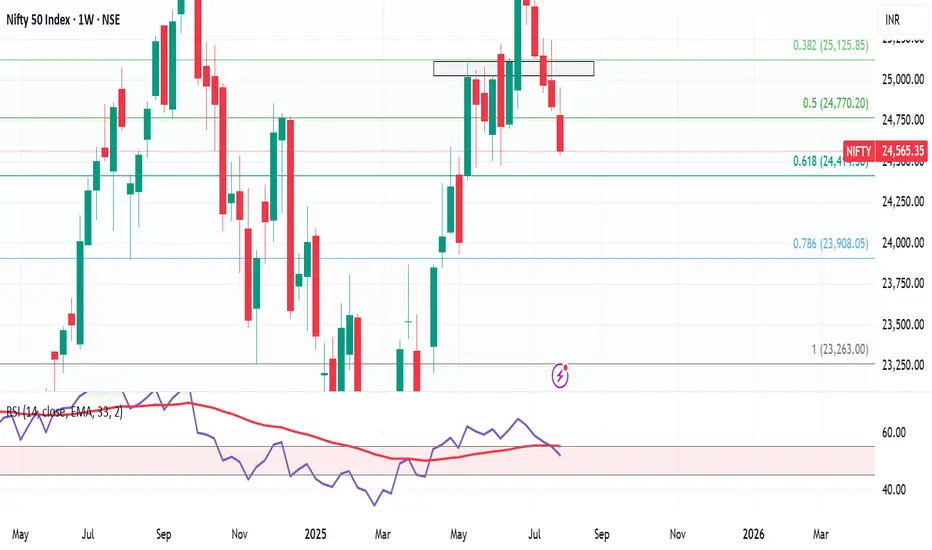
Weekly Market Wrap – Nifty Slides, Global Sentiment WeakensNifty ended the week on a bearish note, closing at 24,565, down 270 points or nearly 1.1% from last week's close. It touched a high of 24,956 and a low of 24,535, perfectly respecting the range I shared last week: 25,300–24,400.
As I highlighted earlier, the inverted hammer formation gave the bears an upper hand—and the index corrected 1.74% from the recent highs. My view continues to favor caution, with the expected trading range for the upcoming week at 25,000–24,100.
Key Levels to Watch:
Support Zone: 24,400 (key bounce area), followed by 24,100 / 23,900 in case of further breakdown.
Resistance Zone: Upside capped near 25,000.
If the market holds 24,400 around 6th–7th August, expect a short-term bounce. However, if this level is breached, expect dips to 24,100 or 23,900, which could offer short-covering opportunities.
Global Cues:
The S&P 500 also had a rough week, closing at 6,238, down 2.5% week-on-week. This decline sparked a wave of selling across global markets. The 6,200 level is crucial—if it holds, we might see a rebound globally, including in Indian equities. Below that, 6,100 remains the breakout retest zone, which I believe should provide some cushion.
💡 Strategy Going Forward:
Focus on stocks showing relative strength in this falling market—they’ll likely lead the rally once sentiment turns.
Avoid chasing rallies, and watch for signs of bottoming out near key support zones.
Keep an eye on global indices like the S&P 500 and Dow Jones, as their stability will dictate near-term direction for Indian markets.
Stay sharp, stay prepared. Let the bears have their moment, but be ready to pounce when the tide turns.
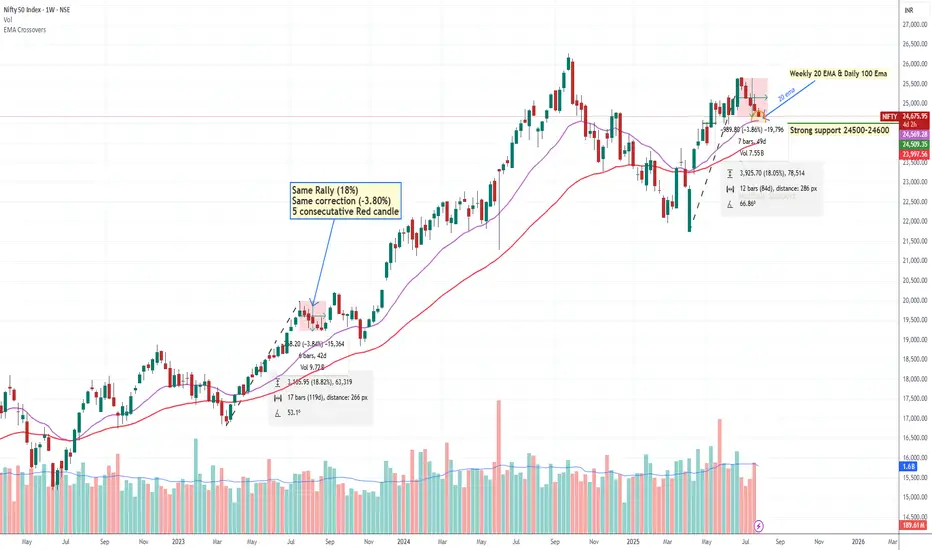
Nifty May Bouncing in Next Week We Are Expecting A bounce back from 24500-24600 level Why? let's Try to understand
(1) Nifty daily Chart 100 EMA
(2) Weekly Chart 200 EMA
(3) there is Multiple support testing around 24500 showing intuitional pending Order.
(4) Nifty bottom out with up move around 18 % & now We are seeing 5 Consecutive Falling
Weekly Candle same pattern happened in July 2023 when nifty Rallied around 18 % and there
was also correction around -3.80%.
(5) A 5-candle rule may apply (Means high possibility of bounce back or pullback if we got 5 consecutive candles either upside or downside)
This is pure technical analysis just based on market behaviour, pattern or historical data. not included any fundamental factor.
Trap Set at the Top? Sensex Sell-Side Objective = 81,886Sensex is currently trading at 82,220 and showing early signs of a potential sell-side move based on Smart Money dynamics. After grabbing buy-side liquidity above recent highs, we’ve now entered a distribution phase.
Price has shown rejection from a premium zone, and a market structure shift is forming on lower timeframes — all pointing toward a probable move to the sell-side liquidity pool near 81,886.
This zone aligns with Smart Money's objective to tap resting liquidity below recent swing lows before any major reversal. Caution is advised for longs. Wait for confirmation if you're planning to ride the short move with the institutions. 🎯💼

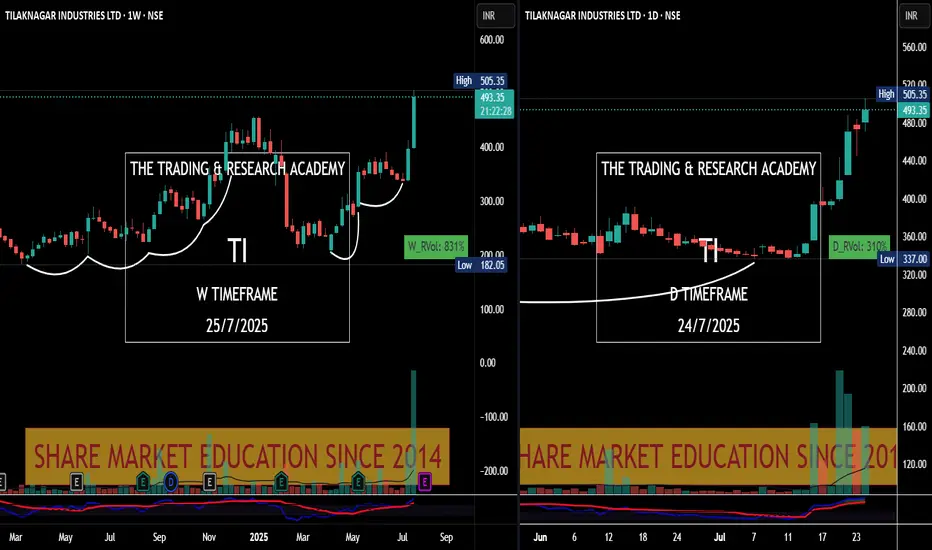
Chart Speaks- Tilak Nagar Ind
#Price leads the #News! Tilak Nagar Ind #tilaknagar see the chart v/s News.
News came yesterday, have a look at chart. Someone was accumulating it since long.
Chart Speaks
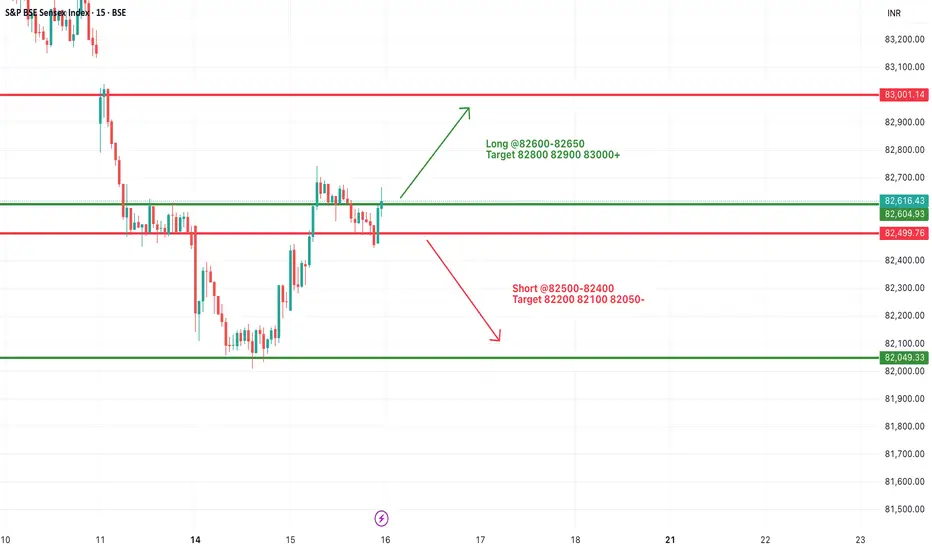
#SENSEX Intraday Support and Resistance Levels - 16/07/2025Sensex is expected to open flat near the crucial 82600–82650 resistance zone, which has acted as a turning point multiple times recently. A sustained move above this range may trigger bullish momentum toward 82800, 82900, and even 83000+. This move would indicate a positive continuation after the recovery seen from recent lows.
However, if the index faces rejection around 82600–82650, it may once again slip below 82500, opening the door for short-side opportunities with targets at 82200, 82100, and 82050. This region has seen a lot of price action over the last few sessions, so volatility may be higher.
#SENSEX Intraday Support and Resistance Levels - 15/07/2025Sensex is likely to kick off the session with a gap-up opening around the 82500 level, reflecting early bullish momentum. If this initial strength holds and the index begins to build above the 82600–82650 zone, it could signal the start of a recovery leg toward higher resistance levels at 82800, 82900, and potentially 83000+. Sustained action above 82650 may encourage momentum traders to chase strength during the day.
However, the 82500–82650 range will act as a battleground. Failure to defend this zone could invite selling pressure. A breakdown below 82500 may expose the index to intraday weakness, opening downside targets at 82200, 82100, and even 82050. In this case, expect volatility to increase near support levels.
Traders should approach with a flexible strategy—watching for breakout confirmation above 82650 or signs of reversal pressure below 82500. Today’s early range could set the tone for the entire session.

#SENSEX Intraday Support and Resistance Levels - 14/07/2025Sensex is likely to open slightly gap-down, reflecting weakness carried over from the previous session. The index is currently trading near the 82450 zone. A breakdown below the 82400 level may trigger further downside movement, with potential support targets at 82200, 82100, and 82000. This zone should be monitored closely for continuation or reversal.
On the upside, any strong recovery above the 82600–82650 level could push the index higher, with resistance targets at 82800, 82900, and 83000+. Sustaining above this range may indicate buying interest returning in the market.
If Sensex spikes toward the 82950–83000 zone and faces resistance, a reversal from there could create shorting opportunities with targets at 82800, 82700, and 82600. However, a clear breakout above 83000 would negate this short setup and shift the bias to bullish.
The index is currently in a consolidation zone, and price action around 82600–82400 will be critical to determine the day’s direction.

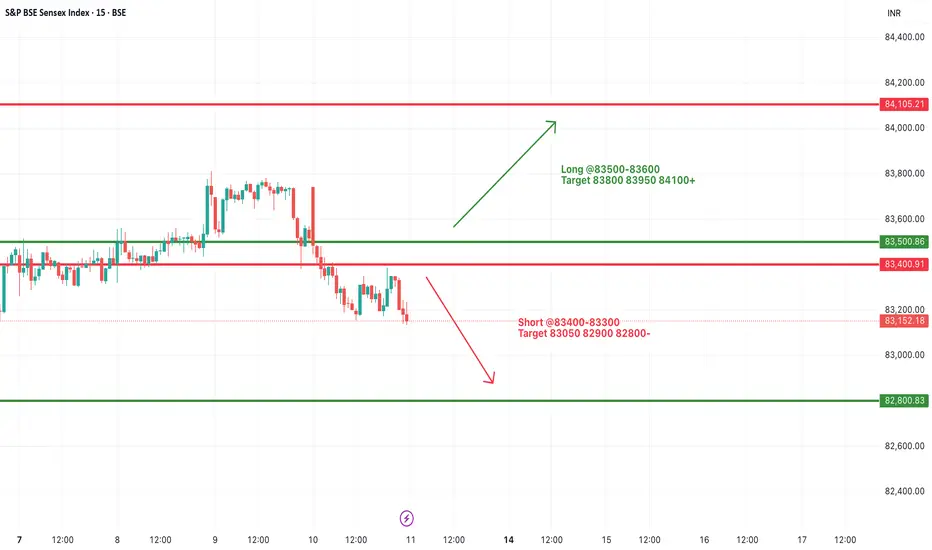
#SENSEX Intraday Support and Resistance Levels - 11/07/2025Sensex is expected to open flat after a consolidation phase and weak closing in the previous session. The index is currently hovering near the support zone of 83400–83300. If Sensex breaks and sustains below this level, further downside may unfold toward 83050, 82900, and 82800. This level should be watched closely as a decisive break may trigger increased selling pressure.
On the upside, a recovery and breakout above 83500–83600 could indicate a potential reversal. Sustaining above this zone can lead the index to rally toward 83800, 83950, and possibly 84100+. However, the price action near this resistance band will be crucial for any confirmation of bullish strength.
Overall, the sentiment remains weak with a bearish bias unless a strong breakout happens on the upside. Traders should remain cautious and focus on these breakout levels for intraday opportunities with proper risk management.
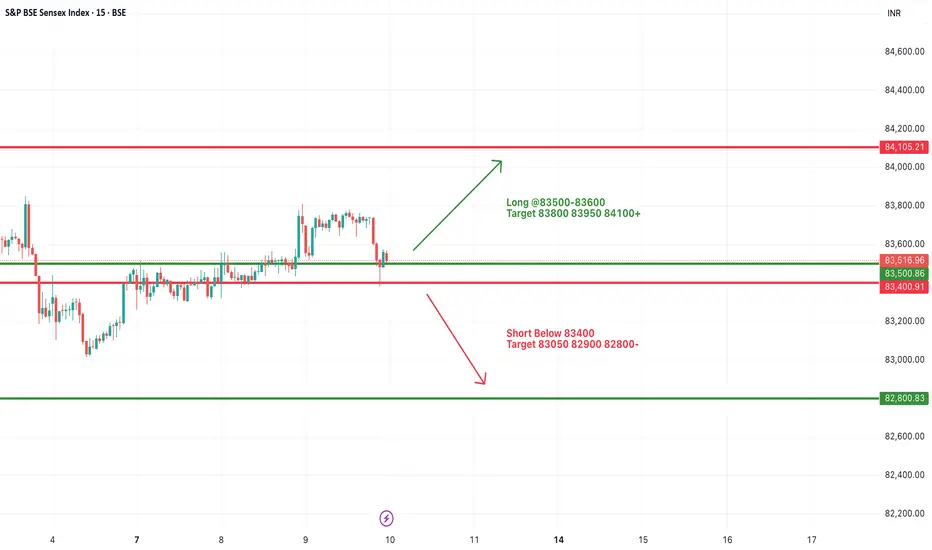
#SENSEX Intraday Support and Resistance Levels - 10/07/2025Sensex is expected to open flat today, continuing the consolidation observed in the past few sessions. The price action remains range-bound with key support near 83400 and resistance around 83600 levels.
Currently, Sensex is hovering near its critical range with buyers and sellers struggling for control. A breakout above the 83500–83600 zone may trigger fresh bullish momentum with targets at 83800, 83950, and 84100+. Sustained movement above 84100 could signal a stronger trend reversal.
On the downside, a breakdown below the 83400 level could lead to weakness, with immediate targets at 83050, 82900, and 82800-.
#SENSEX Intraday Support and Resistance Levels - 09/07/2025Sensex is expected to open slightly gap up near the 83500–83600 range, showing positive momentum as it breaks out from its recent consolidation zone. A sustained move above this level could trigger further upside, with immediate targets seen at 83800, 83950, and 84100+ levels. This zone will act as a crucial resistance-turned-support for the session.
However, if the index fails to hold above 83500 and slips below 83400, it may enter a corrective phase. A breakdown below 83400 could lead to a downward move toward 83050, 82900, and possibly 82800-. Overall, trend remains positive above 83600, and traders should watch for confirmation in the opening session.

#SENSEX Intraday Support and Resistance Levels - 08/07/2025Sensex is expected to open flat today around the 83400 zone, showing no major gap or volatility at the open. The index continues to move in a tight consolidation range between 83300 and 83500. A decisive move outside this zone is likely to give direction to the market.
If the index sustains above 83500, it could lead to a bullish breakout, pushing prices towards 83700, 83800, and eventually 83950+. This breakout may indicate fresh buying interest after a prolonged sideways phase.
However, if Sensex breaches the 83300 level on the downside, it could trigger selling pressure with targets at 83050, 82900, and 82800-. Traders are advised to wait for a clear breakout or breakdown before entering any trades, as the current zone lacks momentum.

SBIN Weekly Levels and reportLook at the Weekly Chart:
This will show you how SBIN’s price has moved each week.
Identify Support and Resistance:
Support is where the price usually doesn’t fall below (like a floor).
Resistance is where the price often doesn’t go higher than (like a ceiling).
Example: If SBIN’s price bounced off ₹590 a few times, that’s support. If the price keeps struggling around ₹640-650, that’s resistance.
Check for Fibonacci Levels (Optional):
You can use a tool that shows you Fibonacci retracement levels. It helps find where prices might bounce or reverse.
Key levels to watch for are 38.2%, 50%, and 61.8% retracements from a big move (up or down).
Draw Trendlines:
If SBIN has been moving up, draw a line connecting the lows to see where it might find support in the future.
If it’s in a downtrend, connect the highs to see where resistance might be.
Check the Moving Averages:
The 50-week and 200-week moving averages can show if the stock is generally moving up or down.
If SBIN is above the 50-week average, it might be in a bullish (up) trend.
If it’s below the 200-week average, it might be in a bearish (down) trend.
Look for Round Numbers:
Prices like ₹600, ₹650, ₹700 are often seen as psychological levels. Traders often watch these prices because they’re easy to remember.
Example:
If SBIN recently bounced off ₹590 or ₹600 multiple times, that’s support.
If it keeps facing resistance around ₹640 or ₹650, those are resistance levels.
Final Thoughts:
If SBIN’s price breaks above resistance (say ₹650), it might go higher.
If it falls below support (say ₹590), it might drop further.

Nifty Weekly Outlook 26.05.2025Expecting bullish action on Nifty. Don't like the current weekly formation. If we moved down today would have been an ideal scenario but lets see.

Nifty Might Range-Bound until it doesn't break 24950 levelToday 21/05/2025 around 11 O clock Nifty Tested 24950 the push was not above average volume driven that's why market was going to pullback although something absence of sellers comparatively had seen on 13 may u can see on chart but still it required to break 24950 level with good volume for being upward journey, until we expect market may range between 24500-25000.
strong Resistance- 24950-25000
Strong Support -24500
Infosys Vs Nifty IT The markings on the chart are based on the Elliott Wave theory.
The IT index has lagged in strength over the last 1+ year and now seem to enter the next wave C down. While the index made a new high, the internal moves are corrective and divergent on the RSI which makes it a better wave (B) candidate.
The next few weeks should be a sharp fall in the IT stocks as wave (c) tend to be quick and less time taking.

Sensex New LowAs per my anlaysis Sensex now low somewhere 71,000 ,its take maybe time but as per my view coming soon on day time frem ,its going to touch new low for this year 2025 , then after going upside .

levels to watch There are no exceptions and HCL is also part of the game. As corrections were expected, and the stock has the potential to create substantial wealth in the long run if approached with proper timing. Rather than focusing on short-term speculation, investors should shift their focus towards wealth creation by strategically building a well-rounded portfolio.
The levels mentioned here represent optimal entry points for gradually accumulating HCL shares, with the expectation that the markets will rally past previous highs in the coming months.
This approach hinges on the belief that, with patience and a long-term outlook, investors can benefit from the stock's potential upside as market conditions improve and HCL's performance strengthens.

levels to watch out I’ve been bearish on the market since last year, constantly warning about an impending correction. While it seems we've moved past the initial anxiety phase, retail investors are still in denial. Many are clinging to losing positions, hoping for a rally to help them average out their losses. A small 100-200 point uptick might bring temporary relief, but the real panic session is yet to come.
When that moment arrives, it’s likely to trigger a bloodbath, with the market potentially correcting deeper than anticipated, possibly even dipping below the 19,000 mark. That level, in my view, would represent an ideal opportunity for long-term accumulation. Once that floor is reached and the market stabilizes, it could set the stage for a new bull run that breaks through previous highs.

ANANT RAJ CAN HIT 1000 MARK!Hey, back with an another weekend picks, i have pick Anant Raj this stock showing bullish momentum and it can gives you around 30 to 40% in couple of month add in your watchlist.

Orient Hotel 20% Upside Potentialhey guys back with an another stock with this weekend for trading, this Orient Hotel recently breaking a consolidation phase we can see a 15 to 20% gain in a couple of week.

Will Shaily Go Up?hi sharing another stock with you, SHAILY recently break a consolidation zone also retesting the zone and it looks for another 15 to 20% upside.

Sensex Expiry Analysis – 7th January 2025
Sensex Expiry Analysis – 7th January 2025
Market Sentiment:
Overall Bias: Slightly bearish with range-bound possibilities unless a breakout/breakdown occurs.
Key Levels:
Resistance Levels: 78,000 (Immediate), 78,400 (Major).
Support Levels: 77,400 (Immediate), 77,200 (Critical).
Rationale for the Trade Setups:
Intraday Sell Setup:
A breakdown below 77,400 will trigger selling pressure, with targets at 77,200 and 77,000 due to high put writing and liquidity below.
Confidence Level: High, supported by FII/DII bearish positions and price action.
Intraday Buy Setup:
A breakout above 78,000 may trigger a gamma squeeze, with rapid movement toward 78,400 and 78,500 due to unwinding of call positions.
Confidence Level: Moderate, requires confirmation with volume.
Key Observations:
Option Chain Analysis:
Strong call writing at 78,000, making it a crucial resistance.
Heavy put writing at 77,400, indicating immediate support.
Implied Volatility (IV):
Slight increase (+2%), indicating expectations of higher volatility.
Gamma Squeeze Potential:
Above 78,000: Possible sharp upside move to 78,500.
Below 77,200: Potential downside acceleration to 77,000.
Execution Plan:
Buy Above 78,000: Wait for a 15-minute candle close above 78,000 with volume confirmation.
Sell Below 77,400: Enter on a clear breakdown below 77,400 with strong momentum.
Additional Notes:
Maintain tight stop-losses due to expiry-day volatility.
FIIs are net bearish in index futures; this reinforces the downside bias.
Range-bound expiry is possible if the index remains between 77,400-78,000.
Disclaimer:
The information provided is for educational and informational purposes only and should not be construed as financial or trading advice.Please consult with a certified financial advisor and use your discretion before making any trading decisions.
