Australian dollar rose 0.8% but there is a "Wall" of naked callsAustralian dollar is up 0.8% in 24h — and almost eyeing the 0.66–0.665 zone .
That’s exactly where we’ve been seeing a systematic build-up of naked calls on the futures.
More “bricks” added to the wall yesterday.
Early, looking at the CME data , there’s been a meaningful inflow in deep-out-of-the-money call options at the 0.665 strike . And this has been happening for several days for now
We can’t say it’s one single player — CME reports don’t show that.
But the pattern is too consistent to ignore.
🧠 Why it matters:
As I’ve said before — these long call stacks can easily turn into zero-cost put spreads by selling futures at those levels.
🎯 Bottom line:
Seems the market isn’t betting on a rally in long term.
It’s preparing to defend the range .
Strategy: open shorts at "build-up" resistance zone
Sentimentalanalysis

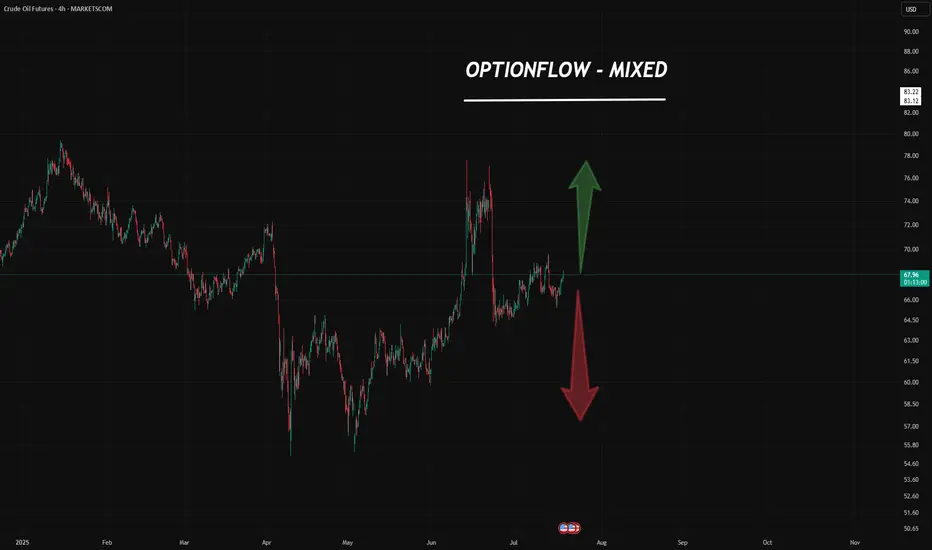
Crude Oil: Bulls vs. Bears — A Market at the Edge
Here’s what we’re seeing from the latest CME block trade data & CME report:
🐻 Confirmed & Detailed Bearish Sentiment
Big players are actively hedging and betting on a drop.
Block trades are targeting key downside levels:
$62.50 , $55.00 , and even as low as $45.00 .
This isn’t noise — it’s institutional conviction.
🐂 Strong Bullish Resistance
At the same time, there’s heavy buying in:
Long futures
Bullish call spreads (1,000+ contracts)
This tells us: there are serious buyers stepping in, targeting $67.50–$72.50 .
They don’t believe in the bear case — and they’re backing it with real money.
🧭 Market at a Bifurcation Point
The presence of massive, conflicting block trades is a clear sign:
The market is preparing for a big move — up or down.
“Smart money” isn’t betting on sideways action.
They’re positioning for breakout volatility .
📊 Final Forecast
Oil is under strong bearish pressure.
That makes a downward scenario more likely in the medium term .
BUT — there’s strong support from big buyers stepping in around $64–$65 .
So the most probable path?
A high-volatility phase , with attempts to test both:
Upper targets (bullish side)
Lower support zones (bearish side)
🔑 Key Battle Zone: $62 – $68
This range will be critical in the days ahead.
Break it — and we’ll know which side is in control.
Still looking to sell on rallies — nothing’s changedStill looking to sell on rallies — nothing’s changed. The level on the chart? That’s where buyers jumped in before. Makes sense to target it again.
So… why do we say there are "suffering buyers" at this level?
Let’s rewind a bit (see Chart #2) and imagine price at the point marked on the chart.
At that moment, price had clearly returned to a visible local level — 0.8123 — a zone that naturally attracted traders to jump in on the fly , or triggered limit orders .
But here’s what happened next:
Selling pressure overpowered buying interest — and price moved swiftly lower .
That’s when those buyers got caught.
That’s when the pain started.
🔍 What Makes This Level Special?
Broker data from open sources confirms that open positions are still sitting at this level — meaning a lot of traders are underwater, hoping for a recovery that may never come.
It’s not just technical structure.
It’s crowded sentiment , failed expectations , and trapped capital — all wrapped into one.
🧠 This is what we call a "suffering trader" zone — and it often becomes a magnet for future selling .
📌 Follow along for more breakdowns on flow, positioning, and market sentiment .
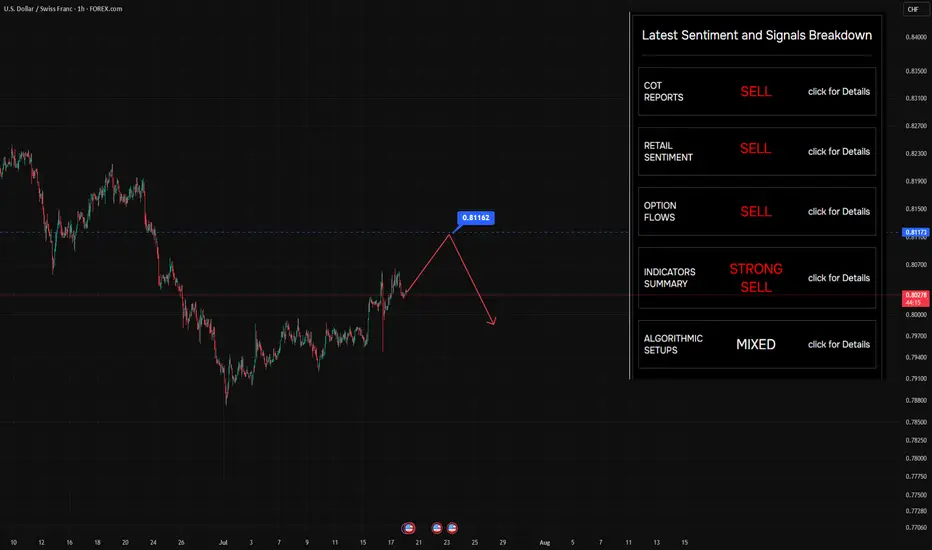
USD/CHF Weakness Alert: Retail Bulls vs. Smart Money FlowHere’s the latest aggregated data on the pair:
📊 4 out of 5 indicators suggest potential for further downside.
Sentiment - Bearish!
A quick note on sentiment in the table:
✅ It’s structured hierarchically — from the broadest view (COT reports) to specific entry points (algorithmic setups).
So, Retail traders are massively long USD/CHF — over 80% still buying , expecting strength.
But here’s the problem: the options flow tells a different story .
Looking at recent data from CME , we’re seeing fresh calls buying and growing open interest at key strikes upper current Swiss futures price — a sign that option traders are preparing for strong CHF
💡 Use this data in your trading OR quick check for market conditions at glance!
🎯 No Valuable Data, No Edge!

Gold new ATH soon?🟡 GOLD LONG SETUP: Buying the Fear at Key Support 📈
ICMARKETS:XAUUSD
"Be fearful when others are greedy, and greedy when others are fearful" - Warren Buffett
The oscillator we developed is showing some compelling signals on gold right now, and the market sentiment couldn't be more perfect for a contrarian play. 💎
Technical Analysis:
Our custom oscillator is painting a clear picture at the bottom - we're seeing those beautiful green zones emerging after extended red periods
Price action has found solid support around the 3,300 level, creating a strong foundation for the next leg up
The fear in the market is palpable, which historically has been an excellent buying opportunity for precious metals
Volume profile suggests accumulation is happening at these levels
Why This Setup Works: 🎯
The beauty of this oscillator lies in its ability to identify when institutional money starts flowing back into gold during periods of maximum pessimism. When retail traders are panicking and selling, smart money is quietly accumulating.
Key levels to watch:
• Support: 3,300 (current zone)
• First target: 3,350
• Extended target: 3,400+
Risk Management: ⚠️
• Stop loss below 3,275
• Position sizing: Never risk more than 2% of account
• Trail stops as momentum builds
The oscillator's fear signals have been remarkably accurate in identifying these reversal points. When fear reaches extremes, that's typically when the best opportunities present themselves.
This is not financial advice - always do your own research and manage risk appropriately.
What are your thoughts on this setup? Are you seeing similar signals on your charts? 🤔
#Gold #XAUUSD #TechnicalAnalysis #BuyTheFear #Oscillator

Quietly Building: A Major Options Position in August AUDEye-catching activity in August AUD options with a strike at 0.67 .
The break-even point for this portfolio sits slightly higher, at 0.674 — and judging by open interest, this is the largest position in play.
Quick reminder:
A break-even level like this could act as a synthetic put building zone by adding short futures to their positions. That means profit from downside moves — with limited risk .
But here’s the catch:
This setup alone doesn’t scream “buy” or suggest strong bullish conviction toward 0.674.
However, it’s definitely worth watching — especially if price starts moving in that direction.
Also keep an eye on option unwinds or roll-overs — they often tell us more about how big players see the future path of the asset.
📈 Bottom line:
Not a clear signal yet — but definitely a pattern forming. Stay tuned.
Follow for more edge-driven breakdowns!

CAD Option Flow Positive Sentiment. It's worth taking a closer Based on the analysis of yesterday's trading on CME, we have captured an excellent portfolio in the lens.
The trader methodically formed this position in a 5-minute period of time, which is a good sign.
Сonfirmation - the market is already moving in his direction
But, reasonable entry level - above 0.7339.
Don't rush it. The risk/profit ratio is still at acceptable levels, but it's worth waiting for the resistance to be overcome.

How to Use the Sentiment Cycle Indicator to Detect Trend ShiftsHow to Use the Sentiment Cycle Indicator to Detect Trend Shifts in BTC
Chart: BTC/USDT (1D)
Tool Used: Sentiment Cycle Indicator
Type: Educational – How to interpret sentiment shifts and time corrections.
⸻
🟢 What the Indicator Does:
The Sentiment Cycle Indicator is designed to help identify emotional cycles in price movements by mapping bullish (green) and bearish (red) sentiment zones directly on the chart background.
It highlights sentiment clusters using a combination of volume behavior, price structure, and trend alignment , helping traders anticipate trend continuation or possible exhaustion.
⸻
✅ Recent Performance:
📈 In the most recent BTC rally (from ~60,000 to 110,000+ USDT),
• The indicator captured the uptrend early, turning the background consistently green starting mid-October 2024.
• Multiple Buy signals (green arrows) confirmed trend conviction.
• Even during minor pullbacks, green sentiment persisted — signaling strength.
📉 Now, the green sentiment zone has faded, and red zones are reappearing, indicating a potential sentiment shift:
• This transition may be an early warning of correction or distribution phase.
• Several Sell signals (red arrows) have recently fired as well, validating the shift.
⸻
🔍 Current Interpretation:
• Bullish sentiment has weakened — background color has turned neutral-to-red.
• Sentiment exhaustion is likely, and this could mark the start of a distribution or corrective phase.
• The absence of new buy signals despite recent price highs further supports this view.
📌 What to watch next:
• If red zones deepen and persist → correction is likely.
• If green zones reappear quickly with renewed Buy signals → resumption of uptrend is possible.
⸻
📚 How-To Use the Indicator:
1. Watch the background color:
• Green → Accumulation or markup.
• Red → Distribution or markdown.
2. Buy/Sell Markers:
• Use arrows as confirmation — not standalone signals.
• Best results when aligned with sentiment zone and price structure.
3. Volatility Filter:
• Sideways zones (mixed bands) indicate indecision — avoid overtrading here.
⸻
🧠 Final Thoughts:
The Sentiment Cycle Indicator isn’t just about price – it’s about the emotion behind price. As BTC shows signs of sentiment fading, this could be a pivotal time to re-evaluate bullish bias and prepare for a cooling phase or even deeper correction.
Let the market’s mood guide your strategy.

Free signal todayHello friends
Given the good growth, now the price is correcting and we can buy within the support ranges with capital and risk management and move with it to the specified targets.
*Trade safely with us*

BTC clear path to 120kSell in may and go away? My contrarian view is to long BTC through summer and go away in september. Maybe sentiment conditions would change. Lets see.
Fibo at 126k
BTC has been following this path since 2021.

EURGBP - LONG | BUYCALL | Sentiments -Strong Bullish Divergence based on strong sentiments at bullish side and strong bullish divergence, the pair seems to be bullish shortly. Market once breaks the last LH we can enter into the market with defined TPs and SL.
HAPPAY TRADIND GUYZ !

AUDCAD - SNIPER PRECEISE SHOT SELLING ENTRY - FIB GOLDEN LEVELHI Guyz, Based on sentiments of traders across the globe , 93 % of the traders are currently looking at selling the AUDCAD. I anticipate this would retrace to the 0.382 Level of FIB and take this opportunity to short sell.
Formation of Shooting Star candle stick pattern further confirms the possibility that HH is formed and now it will take corrective move.
STOP LOSS and TP1, TP2 and TP3 are defined with R:R of 1:1, 1:2 and 1:3 respectively.
Happy Trading and Thanks Me later !
Regards,
ProTradeProfessor!

"Nifty 50 Chart Turns Cautious: Downside Risk Builds"1. **Rising Wedge Breakdown:**
* The index had been trading in a **rising wedge** pattern (purple converging lines).
* A **bearish breakdown** has occurred, suggesting potential for further downside.
* The price broke below the lower trendline with strong red candles and rising volume, validating the bearish move.
2. **Bear Flag Breakdown:**
* A smaller **bear flag** or **descending channel** pattern within the wedge broke down as well, reinforcing bearish sentiment.
3. **Support Zone Tested:**
* Price is currently hovering around a critical **horizontal support zone** between **24,081 – 24,240**, marked with black lines.
* The index is sitting just above this zone, and a clean break below could accelerate selling.
4. **Long-Term Uptrend Line:**
* A longer-term ascending trendline lies just below the current price (\~24,050 area).
* This could act as **last-resort dynamic support** before a larger correction.
---
* **Immediate Resistance**:
* 24,240 – Minor horizontal resistance
* 24,400 – Former support now turned resistance
* **Immediate Support**:
* 24,081 – Horizontal support
* 23,900–24,000 zone – Next key demand area
* 23,700 – Long-term trendline & psychological support
---
**Volume Analysis:**
* Recent volume spike on red candles indicates **stronger participation from sellers**.
* Bearish momentum is likely to continue unless volume dries up and bullish candles appear at support.

7 April Nifty50 important level trading zone #Nifty50
99% working trading plan
👆Gap up open 22920 above & 10m hold after positive trade target 23020, 23130
👆Gap up open 22920 below 10 m not break upside after nigetive trade target 22860, 22823, 22709
👆Gap down open 22862 above 15m hold after positive trade target 22918, 23018
👆Gap down open 22862 below 10 m not break upside after nigetive trade target 22818, 22709
⚡big gapdown open 22709 above hold 1st positive trade view
⚡big Gapup opening 23020 below nigetive trade view
Tep . Market new base hi carefully
📌For education purpose I'm not responsible your trade More education following me

Platinum Portfolios: A Bullish Signal for Future Gains!Yesterday, as markets slept, a shadow flickered across Platinum’s charts. Portfolios materialized like cryptic clues—hours before prices erupted in a 3% vertical rally. But here’s the twist: the official CME report won’t land until tomorrow. By the time most traders react, the first wave will already be history.
The Setup: Why This Move Matters
1️⃣ "The Insiders Always Whisper First"
Last times, a similar pattern in Platinum’s options market foreshadowed a 150$ surge. History doesn’t repeat, but it rhymes.
These portfolios? They’re not random. They’re telegraphs from players who trade with one eye on the horizon.
The Bottom Line
This isn’t just about Platinum. It’s about trade pattern recognition. The market rewards those who connect dots before they’re obvious.
So, ask yourself:
Are you watching the right data?
Will you be ready when the next domino falls?
Stay sharp. Stay curious. And never underestimate the whispers. 🧠💥
Bullish winds are blowing. Will you sail with them? 🌪️🚀
Do your own research or follow along with us! Two minds are preferable to one!

Snow White's very low ratings - Bullish Disney stock ?The SnowWhite IMDB rating can't get any worse - could the same be said of Disney stock?
Price is the ultimate proof but buying the shares of a well established company when sentiment is at a low point can be a fruitful endevour.
The poor box office showing + very weak ratings for Snow White - maybe a contrarian buy signal ?
A) The stock is attempting a long term double bottom via is 2020 + 2023 lows
B) A breakout over the downtrend line (orange) could confirm a bullish trend change
Bottom of the ratings ➡️ Bottom in the stock? NYSE:DIS

Silver Insights: Aggressive Strategies and Bullish SentimentHello, friends! I’m excited to share some observations on Silver.
Yesterday, I came across a couple of intriguing portfolios focused on this metal.
The first one is an aggressive call spread at $40-$40.25, while the second portfolio is a "butterfly" spread, positioned slightly lower.
Both portfolios are designed to capitalize on price movement, but the first one could yield a threefold profit with just a little push in its direction. The second one, however, will require some time and ideally needs to reach around $38 by the end of April.
From a technical standpoint, the chart shows a "spring compression", which often leads to the emergence of such portfolios. While I don’t place too much weight on predictive elements, the sentiment remains bullish.
Stay tuned, plan your trades and let’s see how this unfolds!
Always do your own research but do no hesistate visit us to leverage the comprehensive analysis from our team to enhance your trading advantage! 💪💼

$SPY: Three timeframe analysis, One Chart Pattern, Sentiment📢!Hey there!
#Tariffs negative news drives bearish sentiment. Is it just mass media noise? And Mr. Market will continue up?
WHY?
Let's have a look at the charts:
1. 📈We are in a bullish trend on a weekly and monthly basis, meaning long-term and mid-term, yet in a bearish on a daily one, a ka short-term
2. 🤓The bullish Flag pattern has formed. Yeah, I know; how do you qualify it? For this theoretical exercise only visually, but for anything more serious, Bukowski starts, or you may want to run your own tests.
3. 🍒And the cherry on top: Bearish sentiment is significantly higher than the historical average, standing at 42.9% (2/5/2025) compared to 31.0%. On my side, it means that we might be in for a heavy short squeeze for a couple of days.👋Just observations, not advice
For now, enjoy Super Bowl Sunday! 🏈
S ource of the screenshot: AAII Investor Sentiment Survey, www.aaii.com

Business sentiment turning up which is usually bullish Since the 70's, a significant improvement in the US business sentiment, as measured by the US NFIB Business Optimism Index, usually translated in a higher S&P500 in the following months and year. The only exception being 2021 when the pandemic put a halt to the rise in the stock market (but did recovered quickly).
I used a cross of the 12-month rate of change above 6%.
The most recent datas is showing the best improvement in business sentiment since the early 80's.
This bodes well for a continuation of the bull market in the coming months.

Once in 3 year signal gives you the big pictureI've analyzed the putcall ratio in this video to show how valuable the sentiment is in determining the direction of the market.

4 Big Banks and their relation to KBEWeekly time frame....White line front runs a
change in direction...be it temporary or permanent
to long to explain...but white peak before blue peak
and things head down...if blue continues with white
or stays flat...there is little change to direction
or price just chops sideways a bit.
use other indicators to confirm...but white line can
bounce off or hug envelope channel and explain price
--------
The 4 headless horsemen of banking are next to each other...
Does something seem quite interesting among them since each is way different in area of investment...political control...money-metals exposure....MBS and the like...
So why are three pretty close to copies if you glance for more than a second or two, yet the fourth is somewhat similar but trending differently...
Just an interesting thought experiment

From Sideways to Soaring: Gold's Path to $2700Gold has finally broken out of that sideways range, and what’s even more important, it did so in the direction we were expecting. It took a bit longer than we initially thought, but hey, the market doesn’t care about our timelines—it moves for its own reasons and motives.
Right now, Gold is heading towards the $2700 mark, where we’ve got the first block of buy and sell orders lined up.
Honestly, there’s nothing surprising about that, especially since round numbers tend to attract a lot of orders in commodity trading.
The sentiment from the options market isn’t throwing any clear opposing signals, so the base scenario is still pointing upwards. That’s the scoop for now!

Yen Futures Set to Soar: Are You In?Hey traders! 🌟
Have you been watching the yen futures on CME? There’s some serious action brewing, and it looks like we could see those quotes climbing to 0.73 and beyond in the next 60 days!
With new options portfolios aimed at boosting these futures, now's the time to get in on the action.
What Does This Mean for You?
If you're in the trading game, you know that such movements can create fresh opportunities.
Options strategies could be your secret weapon, so don’t miss out!
Why Should You Pay Attention?
Consider using options not only to hedge your risks buy set goals for future movements too/
Share your thoughts in the comments, and let’s discuss how we can capitalize on this situation! 💸📊
