Record levels of complacency means market topping outIn this post, I have shown the put-call ratio which is a reliable measure of sentiment in the market. When everyone is optimistic, that's typically when the market tops out.
Sentiment Studies

Gold swing trading ideas, with a new look at futures sentimentWe take a multi timeframe approach for today's gold analysis video. Taking into account COT data from the weekly chart, support levels on the daily and four-hour charts, we outline our rationale as to why gold could hit new lows after an expected bounce.
MS.

GME new bullish momentum LONGGME on a weekly chart has clear the chop zone on that indicator and is now above the POC
line of the long -term volume profile indicating that bullish momentum is greater than bearish
momentum. I will take a long trade here targeting the pivot highs of 2022 for three quarters
of the trade and the base of the high pivots of 2021 for the reminder. 21.7 below the POC
line will be the initial stop loss to be moved to break even upon a price rise of 10% from the
entry and then changed to a trailing loss of 10% upon another 10% price rise. I believe that
GME is heavily shorted; Accordingly, a short squeeze could add to the push higher.

Bitcoin - THIS INDICATOR calls the TOP📉Hi Traders, Investors and Speculators of Charts📈
It's always good to refer back to the MACRO trend when watching BTC. From a macro perspective; we're definitely overdue for that proper bull-cycle correction - also important to keep in mind the halving coming up in April.
We can confirm this bias by taking a look at a very specific indicator called the Balance of Power. Historically, on a macro timeframe, this indicator has been great at calling local tops and bottoms.
If you found this content helpful, please remember to hit like and subscribe and never miss a moment in the markets.
_______________________
📢Follow us here on TradingView for daily updates📢
👍Hit like & Follow 👍
CryptoCheck
BINANCE:BTCUSDT

XAUUSD Weekly OverviewRegarding our observations, currently there are more buyers in the market
These are best levels regarding Support and resistance, Channels, Weekly pivots, Buyers and Sellers focus and order_block.
Both Long-term and Short-term Trends are bearish! There is not almost any reason that could change the short-term trend in near future.
We expect a bearish gold for this week!
1901 is the best place to strat putting sell orders in case breaking the bearish trend line.
We take the market under observation to find long opportunities. We do not suggesst any setup now!

EURGBP proper setups! According our observations, there are just a little more sellers in the market. Remeber we could just gauge traders which are not big players in the forex market.
Most main important levels are 0.8690,0.8595 and 0.8520. We use the rest of them just for riskfree and saving profits.
We'll long around 0.8595 and also we aim to short the pair around 0.8690. the 0.8520 level is another good option to long in next weeks.
4h OB
Ichimoku horizontal levels
Buyers and Sellers levels

USD/JPY: The case for a bearish reversal buildsUSD/JPY has delivered a decent trend for bulls so far this year, having risen 14% since the January low. Yet we have been fully aware that net-short exposure to yen futures has approached a historical extreme as USD/JPT prices rose towards 145.
Incidentally, 145 was the upper range of the liquidity gap we mentioned in a previous article which has now been filled, and USD/JPY has printed a bearish engulfing week at the 145 handle.
With risks of yen intervention very real and traders positioned so strongly to the short side of yen futures, we suspect USD/JPY is at or very near an important inflection point. What could make the difference between a natural pullback against the YTD trend or a sharp reversal could be incoming economic data from the US and Japan. A softer-than-expected CPI report for the US could likely help push USD/JPY lower, but the real bearish catalyst could be if the BOJ finally get serious about abandoning their YCC (yield curve control).
Over the near-term, a move to the 140 and 138 handles seem achievable over the coming weeks as part of a much-deserved retracement against a one-sided trend so far this year.

DXY in a range as GBPUSD completing a bullish flag.FX:GBPUSD moving up in a channel, hoping to break 1.24514 and form a flag I will be buying above 1.24514 targeting 1.2550

Bitcoin - Balance of Power between Buyers and SellersHi Traders, Investors and Speculators 📈📉
Ev here. Been trading crypto since 2017 and later got into stocks. I have 3 board exams on financial markets and studied economics from a top tier university for a year. Daytime job - Math Teacher. 👩🏫
The cryptocurrency markets and Bitcoin are trading predominantly bearish as the DXY increases in strength. In today's analysis, we take a look at the technical indicator Balance of Power. This indicator is useful to determine what setup has the best probability of succeeding. Together with the Pivot Points, we can identify the next immediate support zone / whale accumulation zone from a macro perspective, which is the monthly timeframe. From a candlestick analysis, we did recently see a green month last month, so it wouldn't be too hard to conclude that the current monthly candle might close bearish, considering the overwhelming selling power.
💭 ...Countertrading
Although countertrading is a popular strategy, it isn't a low-risk one. Infact, it is extremely high risk. Here's why : When you have multiple indicators (RSI, Volume, Fibonacci, Candlesticks etc.) pointing towards bearish price action, this is the MOST PROBABLE way the price will go. Technical Indicators and chart analysis have a 55% - 60% Success rate (Wall-Street figures). This means that there will be times (40%) when the indicators point bearish but the price suddenly goes bullish. However, if you follow the indicators, you can be sure that you will have more wins than losses , probability wise. Now you could try to guess it out by countertrading, but what are the probabilities for your guesses to be right? ...💭
Looking for a Short Setup? Here's a setup for SHIBUSDT that could award +40% :📈
_______________________
📢Follow us here on TradingView for daily updates and trade ideas on crypto , stocks and commodities 💎Hit like & Follow 👍
We thank you for your support !
CryptoCheck

US Market Update: HeatmapHeatmap for the NASDAQ
The Nasdaq Heatmap shows a mixed bag after the first half of the trading day today.
Major stock market indexes traded mixed in the first half of Monday's session
A Fed governor told traders and investors on Sunday to curb their enthusiasm after last week's spectacular price moves, fueled by a rotation out of 2022 winners, into all sorts of heavily shorted laggards.
Volume fell sharply on the Nasdaq and the NYSE compared to Friday morning levels.
Crypto sentiment took another dive over the weekend after bankrupt exchange FTX was hacked, draining what was called hundreds of millions of dollars from exchange wallets. Bitcoin posted its worst losses in five months last week and tested Wednesday's low overnight.
Fed Governor Warns Investors
Fed governor Christopher Waller warned on Sunday the central bank has "a ways to go" before rate hikes end. He scolded stock market investors, telling them last week's weaker-than-expected CPI report was just one data point.
Waller agreed the Fed may slow the pace of rate hikes to 50 basis points at the December meeting but insists it would not constitute a change in fiscal policy. He also warned that Fed interest rates will keep rising and stay high until inflation drops to near the Fed's 2% target.
Finally, he notes that CPI reports in coming months will need to show inflation "is on the downslope."

BTC BearishAll Moving Averages showing negative probability.
untill all averaes come and aling then we could expect a good reversal..till that shorts only open.
with strict stoploss.

US Market Update Heatmap NASDAQ for last week
The heatmap for the Nasdaq for the last 5 trading days looks great. Many names could improve by more than 10% with only very few exceptions, TSLA being a big outlier last week.
Overall a very promising week which could actually indicate that we are getting very close to the bottom of the current bear market.
General Market Update
The US stock market ended a powerful week in an optimistic mood, rallying into the close as the strong dollar fell. Investors look to be rotating into a more aggressive stance.
The Nasdaq, which has been suffering severe losses in 2022 so far, performed best. It rose 1.9% for the day and ended with a weekly gain of over a giant 8%. Crucially, it is now back above the 50-day moving average. It remains down more than 28% for the year.
The S&P 500 managed to squeeze out a gain of 0.9% Friday, raising the weekly total to nearly 6%. The 200-day moving average now looks in reach after it climbed away from its 50-day line.
Blue chip stocks lagged the other major indexes following recent outperformance. Nevertheless, the Dow Jones Industrial Average still closed up 0.1% for the day and more than 4% for the week. Nike (NKE) and Walt Disney (DIS) were among the top performers.
Volume was down on both the Nasdaq and the NYSE, no surprise given Thursday's massive volume. Breadth was solid in both exchanges, with advancers outnumbering decliners about 2-1.
With many near-term hurdles cleared, the stock market looks to be in a good position to make the turn. However, swing-traders still have to expect increased volatility.
Weakening Dollar
The strong dollar has been a big headwind for the stock market, but signs of peak inflation have seen the currency fall in recent days.
Friday's weakness in the U.S. Dollar index extended a move that began Thursday following lower-than-expected U.S. consumer inflation data.
Many companies have seen their bottom lines hit due to expensive foreign exchange rates. If the dollar continues to weaken, it will conversely boost earnings for firms with foreign operations, bolstering their stock price.

JS-TechTrading: US Market UpdateUS Market Update
The U.S. midterm elections won't have an official conclusion for quite some time. Meanwhile, investors are facing questions about what Thursday's latest inflation report means for the path of interest rates.
The general reaction toward corporate third-quarter earnings has been poor. This puts the durability of the latest rally attempt during the current bear market in question.
The stock market dislikes uncertainty which become obvious during yesterdays’ session. Small caps to megacap techs faced severe losses. Key indexes finished virtually at session lows. The current uptrend remains under intense selling pressure. Always think risk first!
The Nasdaq dropped 2.5% and wiped away three days' worth of gains. Another drop like the one on Wednesday could lead to a test of the Oct. 13 near-term low of 10,088.
Small caps did worse as the Russell 2000 sank 2.7%. The large-cap S&P 500 sank 2.1%.
On Thursday, all eyes on Wall Street will focus on the October consumer prices report.
The Day's Biggest Decliners
The oil and gas sector really got socked as crude oil futures fell even harder than the stock market benchmarks. West Texas intermediate near-term futures slid 3.7% to $85.61 a barrel. Natural gas fell 2.9%. Lower energy prices will indeed help soften the blow that raging inflation is having on the economy. But this has consequences for stock market investors as well.
Lowlight: Chart Industries (GTLS) fell 20% (oil and gas machinery and equipment industry group).

$QQQ - uh oh, Price fell out of triangle. Avoid price battle.If you watch price on QQQ or SPY, you will see a strong price battle going on between buyers and sellers. Daily timeframe, the question of course is whether PPI tomorrow causes another gap down or a reversal back up towards upper resistance line.
RSI and stochastic do not provide a reliable directional signal right now; all the more reason for caution in your trades.

EURUSD: Buyers Are Drowning 🏊Buyers are taking a real beating, they keep buying but the dollar keeps pumping.
At some point the market will need to give them a sign of relief.
Since we have swept the liquidity below this zone and tapped into a mayor order block, we may begin to see slight relief here.
BUT
Don't think that a bullish candle means a reversal! This is what they will want you to believe.
I am expecting a buy lure followed by a strong sweep before price moves in the intended direction.
Something similar to what I have illustrated.
Of course, this is a long term play and will require lots and lots of patience and trade preparation.

BTC: Surviving the Chop! / Visual MapMorning/Evening all!
BTC has entered a very choppy range, which means the price moves in a tight range bouncing between many levels chopping positions of all market participants, shorts and longs alike.
In this picture I have marked and mapped the choppy areas as well as the zones that should be considered Resistance and Support.
There are two ways to use this chart depending on what you are looking for:
A) SWING TRADING THE TREND
If you have entries in the green (support) zone and you want to catch bigger moves then hold your positions until price goes into the red (resistance zone). If this happens pay attention to momentum. If the momentum is strong you might want to keep your positions and let the price pump higher (which means you will be looking at taking profit around 25-28k area).
Ignore the chop zone completely. It's there to make you let go of your positions, lose money or both.
B) SCALPING
If you are interested in scalping every move then the orange (chop) zone is your bread and butter. You try to get entries at the lowest parts of this range and take profit at the highest parts of this range.
Taking smaller scalps for example from the mid of that range (~20.8) to the top of the range still works but your R/R is much different. Proceed with caution. Have very tight stop losses. Look for any signs that might show you that we're about to break out of the chop zone and protect yourself if you are in an opposite trade.
Last but not least:
-- All lines should be considered approximates. This means you have to check for previous candle bodies near these lines to find the exact "mini-range" that each line belongs to.
-- Blue/Red boxes (frames) are put/ask areas. They are areas where price previously found either mostly sellers or mostly buyers, therefore, the volume profile has a gap too (possible support/resistance areas)
It's highly likely that we will enter an "Inside Week" structure which means I wouldn't be surprised if these ranges play out for a couple of more weeks.
So, what's an "Inside Week" anyway? I will make another post about it and explain in detail. Stay tuned!!

pure price action.. rest all depends on sentiments.as we can witness the volatility are again high. uncertainty is again there in the market. all we have to maintain is our risk&reward ratio which is the only holy grail of the stock market. I will remain neutral. tomorrow and will see how the market will perform tommorrow.

Trader's worst enemy ☠️Hi everyone,
Wish y'all have a profitable life.
📌 Today I would like to talk about a very important factor that every trader has to consider very important in their technical analysis.
⚠️ The topic is "EMOTION" and how it can lead to possible profit and or losing money.
⚠️ And how can you avoid "FOMO TRADING" !
📍It's almost been a year that I have started trading and at the beginning I have participated in various technical classes such as ICHIMOKU, Price Action, E-Wave, etc. Furthermore, I can assume that I have made some money as well as some losses.
🧐 The question is; how to avoid serious money loss??
📍 The answer may differ from each person to the other and person by person. However, the most common answer might be: "EMOTIONS"
📌 We are human-beings and it is completely normal for each human-being to decide based on emotions and not considering facts and reasons.
🧐 What does this exactly mean?
📍 The answer is: We may dismiss or not consider some reasonable facts and decide emotionally not reasonably.
📌 As you can see my E-wave analysis may be THEORITICALLY correct but not resoanbly.
🧐 What does it mean if we have a total of 9Trillion dollar of worth in crypto-currency?
🧐 What if this new version of .com bubble explode at some points?
📍Always, consider fundamental analysis in your technical analysis and your technical analysis in your fundamental analysis
⚠️ Keep your faith for when you are in church and your belief when you are in a hospital
⚠️ Trading is a game of numbers and numbers do not understand any emotions...
⚠️ Trading is a game of indexes, algorithms, pure mathematics and supply and demand, please do not believe in chart!
🧐 I am looking forward to update my toturial and tell you guys more about sentimental analysis.
Please let me know if you have got any problem and or questions

Balance Of Power From ScratchHello, traders!
As you know it's very important to identify the balance of bulls and bears. Today, we introduce you one of the most pretty and easy-to-interpret tools - Balance Of Power Oscillator.
Balance of Power (BOP) is an oscillator that measures the strength of buying and selling pressure. Introduced by Igor Levshin in the August 2001 issue of Technical Analysis of Stocks & Commodities magazine, this indicator compares the power of buyers to push prices to higher extremes with the power of sellers to move prices to lower extremes. When the indicator is in positive territory, the bulls are in charge; and sellers dominate when the indicator is negative. A reading near the zero line indicates a balance between the two and can mean a trend reversal.
The Balance of Power indicator shows the direction and extent of price change during the trading period. Like most oscillators, the Balance of Power indicator can be used to identify trends, divergences from price, and overbought/oversold conditions. Zero-line crossovers provide buying and selling signals.
Possible Signals
Zero-Line Crossovers
The scale of this oscillator ranges from -1 to +1, with 0 as the centerline. Zero-line crossovers indicate a move into positive or negative territory, and are often used as buy or sell signals. A cross above the center line generates a buy signal, and a cross below generates a sell signal.
The data is smoothed with a moving average in order to reduce the number of whipsaws. An SMA with more periods reduces the number of false crossover signals, but also reduces the responsiveness of the indicator.
While the main signal provided by the Balance of Power indicator comes from zero-line crossovers, it can also be used to determine the trend, look for divergences in price, and identify overbought/oversold securities.
Trend identification
A rising BOP line indicates an upward trend and a falling BOP line indicates a downward trend. The zero-line crossover confirms the trend change.
Divergences with Price
When price makes new highs but BOP doesn't, that is a negative divergence; when price makes new lows but BOP doesn't, that is a positive divergence. These divergences can foreshadow a change in trend.
Conclusion
The Balance of Power (BOP) indicator uses price to measure buying and selling pressure. It determines the strength of the buyers and sellers by looking at how strongly the price has changed, rather than using volume.
As with all indicators, traders should use the Balance of Power indicator in conjunction with other indicators and analysis techniques.


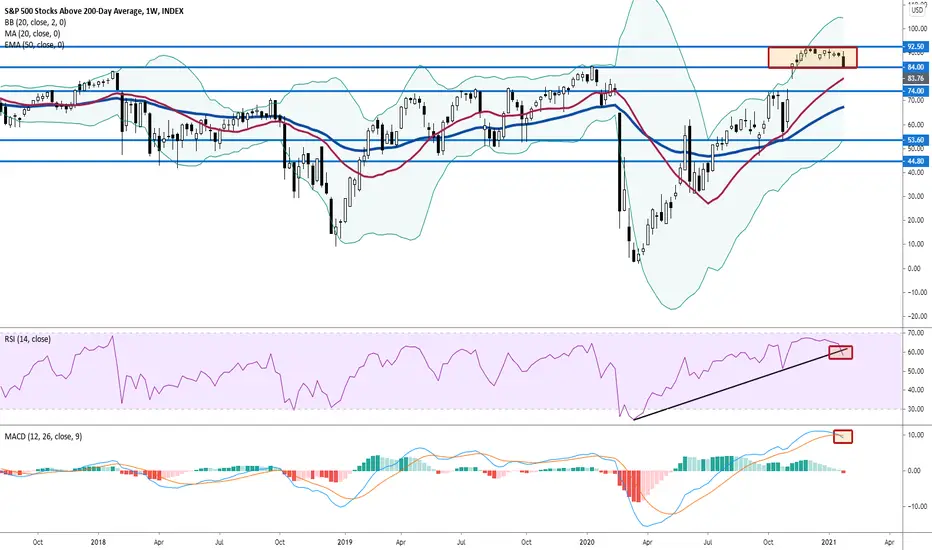
Watch 84% as SPX pulls back the most since OctoberCaution on U.S. markets as we get below 84% Some selling could step in. RSI uptrend has broken, MACD turned bearish.
BTC OVERBOUGHTBelow you can see 4 indicators pointing out that BTC is currently overbought. Take a look at my previous post to see what indicators I use and what they mean.
At this point we will have to see how the market responds to BTC being overbought. What happens often, is many traders use this as an indicator to sell.
That is why we need to keep a close eye on the Balance of Power, the second blue lines chart. If the value is in the negative more frequently, we can understand that traders are using this opportunity to sell in overbought territory, then we can expect a bear run.
However, if the Balance of Power is above 1 more frequently, the buyers are still in control and we can expect a bull run.
Keep watching the Balance of Power !
Hit like if you found this helpful.
Thanks, Ev
