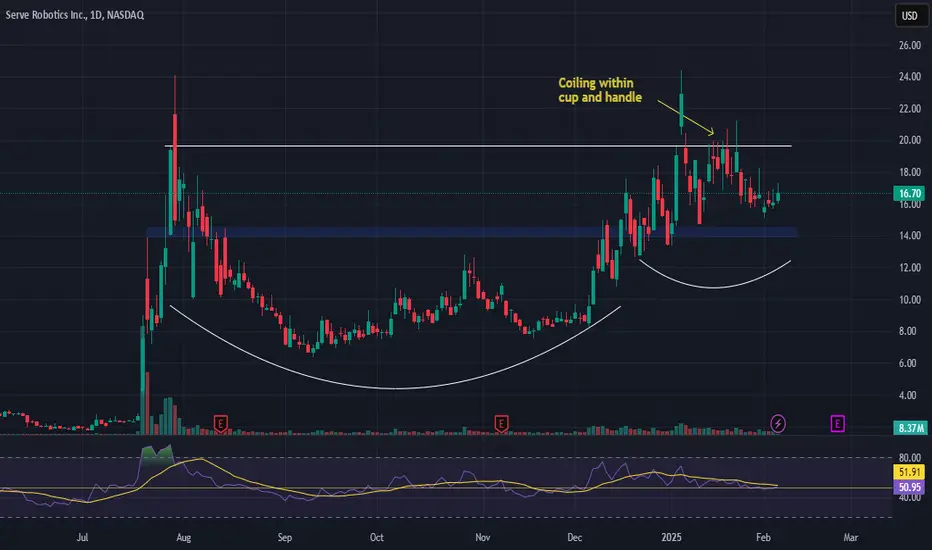
Nvidia $SERV'd this one! Massive move still on the table!NASDAQ:SERV
NASDAQ:NVDA selling out of this one crushed this name but...
- The CupnHandle is still intact IF this is indeed bottom.
- Volume Shelf and S/R Zone here
- Right at smoothing line which has historically held pretty well.
Only time will tell but if we come back up and break out of this CupnHandle at $24.32 we are going to...
🎯 $42
Not financial advice
SERV

Serve Robotics (SERV) Analysis Company Overview:
Serve Robotics NASDAQ:SERV is a pioneer in autonomous last-mile delivery, leveraging AI-driven electric robots to reduce costs and emissions. With strong partnerships and financial backing, SERV is positioned to disrupt traditional delivery models.
Key Catalysts:
$450 Billion Market Potential by 2030 🌎
Serve’s $1-per-trip model could revolutionize delivery economics.
Strategic Partnerships – Uber & 7-Eleven 📦
Uber’s $11.5M investment and integration with Uber Eats enhance scale.
7-Eleven partnership strengthens Serve’s retail delivery presence.
Strong Financial Backing – Secured Through 2026 💰
$166M raised since December 2024, ensuring funding stability.
NVIDIA and Delivery Hero investments validate AI-driven robotics.
Investment Outlook:
Bullish Case: We are bullish on SERV above $14.00-$14.50, supported by disruptive potential, strategic partnerships, and financial strength.
Upside Potential: Our price target is $31.00-$32.00, reflecting market expansion, AI adoption, and industry transformation.
📢 Serve Robotics—Redefining Last-Mile Delivery. #AI #Robotics #AutonomousDelivery #SERV
SERV.N - Possible BreakoutCup and Handle formation, with a breakout pending
Golden Crossover has already taken place, highlighted on yellow circle.
Upside of 195 with a stop loss shown.
Watch out for breakout!
DDYOR. NOT FA.

SERV - Potential Short 5th Wave SwingTrading OpportunityUsing our Elliott Wave Indicator Suite for the TradingView Platform we have identified a potential Short 5th Wave Swing Trading Opportunity for SERV on the Daily time frame . The 5th wave move in an elliottwave sequence is the highest probability move.
The wave 4 pull back has found resistance in the Green zone of our probability pullback zones, which represents an 85% probability that our automated 5th wave target zone, in blue on the chart, will be hit.
We see yellow dots formed in the oversold zone on our special False Breakout Stochastic indicator, which signals strong Bearish momentum. When, during a wave 4 pullback, the stochastic pulls back against these false break out dots and crosses in the overbought zone, there is a high probability the stocks price action will resume the overall bearish trend .
We also measure the wave 4 behaviour with our Elliottwave oscillator, which has pulled back within our pre-determined zone.
So overall we have identified, using our Elliott Wave Indicator suite for TradingView, a high probability short swing trading opportunity for SERV , Daily Time Frame , with the following entry strategy:
Short entry through $37.72
Stop Loss $40.78
Target $31.50
Giving a Risk to Reward of 1:2
Learn more about our Tradingview indicator suites by watching the video tours >>HERE<<

SERV ($SERV) Flat base + VolumeBought SERV today considering that the stock has been showing a flat base after a bullish trend and the close price during the last 12 weeks has been consistent with small fluctuations.
The stock volume during the last 4 few weeks was under the average for the last 5, 10 and 20 weeks, so this could mean that the current stock owners don't have the intention to sell it at the current price, forcing it to a price increase in the near future.

SERV - Inverted Fallen angel formation from $44.07 to $40.53SERV is showing downward momentum in daily frame, however in the weekly frame it seems forming an inverted Fallen angel formation. We think it has good downside potential.
* Trade Criteria *
Date First Found- October 30, 2017
Pattern/Why- Possible inverted Fallen Angel pattern (weekly chart)
Entry Target Criteria- Break of $44.07
Exit Target Criteria- $40.53
Stop Loss Criteria- $ 45.93
Please check back for Trade updates. (Note: Trade update is little delayed here.)
