BTC Friday set up the TGIF Today, I’ll be considering the possibility of a 70+% retrace to the upside using the TGIF (Thank God it’s Friday) setup. This usually kicks in by the London or NY-AM open if it’s going to happen.
If we don’t see more downside and traders decide to close out their short positions from the week, we could see an upside move. I’m watching for a market structure shift to the upside and confirmations like higher highs or significant moves around the London session at 3AM New York local time.
If we see displacement to the upside during the London session, that’s a strong indicator. If not, I’ll be looking for similar signs during the NY-AM session.
When this setup engages, it tends to be a high-probability trade.
What are your thoughts on this potential move?
#BTC #Bitcoin #CryptoMarket #TradingIdeas #MarketAnalysis #PriceAction #CryptoTalk #LondonSession #NYSession #TradeSmart #BTCTraders
Set-up

EUR USD BUY NOW !!!after data release now put your call orders at 1.0610 to confirmation and let it run to 1.07 tp
Enjoy the Weekend !!!

UUUU update - Terrible time for shortsUpdating my chart as it seems to be followed by a few lately and has proven accurate since breakout in Nov..
We may see a quick (C) down to the confluence of support (Trend, Fib and MA) which would constitute a spike, though it may have enough buying buoyancy to be rather shallow.
Once correction is complete, this week will show the beginning of a W5 up to the $8 master resistance. It may get rejected there and correct up to 50% of the current 5 wave structure. That correction will be the LAST buying opportunity in UUUU/EFR

[Market Breakdown 2] CHFJPYMONTHLY
Price is sitting at a Monthly high zone.
Very very strong Supply & Demand zone as you see, acting as resistance.
We did not break this level since February 2016.
Also nice -68 Fib completion which means a lot on the Monthly.
We are definitely interested in a Short set-up.

GBP/USD SHORT!After Brexit talks get ANOTHER extension the pound rallied on the open last night pushing most of its counterparts back to key levels. In doing so with cable we have created a strong intra day trend here presenting a good SELL opportunity from this area. Expected the pair to move up and down at first and be prepared to hold. We are live in the trade and wait for the downside to fill the gap. Good Luck

Long trade set up for BTCWaiting for retest off untested gained support.
Stop at 10117
take profit at 10205/10220
Trade Save!

BTGUSD Next Short Set-Up from HereBTGUSD Next Short Set-Up from Here
The wider spread compared to BCHUSD has seen
volume shrink away on this pair and swell on BCH.
But it's still a good shorting vehicle nevertheless. It halved
from 26 to 13 in a matter of days for example.
"No coin is ever too low to sell" - to update a W D Gann quote
for the 21st century.
The downtrend is still strong here and the last 3 rallies have
all failed at the upper dynamic. BTG remains vulnerable
whilst trapped below this dominant line. Once 17.5 breaks it
should fall away to the 13.2-12.1 range. And once 12 breaks
the next obvious downside target becomes 6.5-6.0
Will follow Bitcoin around as usual, just moves faster.
Not ready to short again yet but worth setting an alert for
maybe.

ETHBTC Target Achieved - Next Short Set-Up from HereETHBTC
This has been a good short through most of August, down 20%+
from the 542 break level to 426 now.
There was a second chance to short again from the lower
green arrow as it broke the continuation pattern at 46 which
has yielded close to 10% this week.
But it's making a little double bottom here and the near term
downside target has been touched precisely so it's time to
close out again if you haven't already done so.
Next short opportunity comes on a break below 4165 looking
for 3440 initially and then 2345

NEOUSD Next Short Set-Up From HereNEOUSD Update and Next Trade Points
It's been a week since the last scan across the top 20 or so coins.
A lot has happened in 7/8 days.
Remember that no coin is too low to sell and likelwise in a bull market no coin is too high to buy.
Remember also that we play a game of probability. Some play momentum and volatility and some play hunches and mistaken beliefs. Few are right. The majority are wrong - up to 95% of retail currency traders lose money. (If currency trading was easy, we'd be doing it here a lot more. It isn't. So we don't)
So we know the odds are stacked against from the outset.
With this is mind is it 'easier' to sell the dust and forget about the diamond - or are you so damn good you can find 'the one' ?
If it's the latter please share ; )
Until that day arrives we are probably better to try nailing the losers.
And there have been some good ones over the last week.
Here are some: they will follow Bitcoin as usual. They will rally more than the great death-star itself and fall more when Bitcoin fails. Some offering fantastic gearing opportunities without the need to resort to excessive margin trading.
NEOUSD
This was a sell from 20.87 and weak whilst trapped below 21 with a downside target at 13.
It fell to 13.64 before rallying.
That's a big double bottom at 13.25 in fact.
But the trend is still neagtive despite the 50% counter rally since.
To break free of the relentless bear prssure here it will need Bitcoin's help to arrive soon now.
In it's continuing absence NEO will break the the little dynamic under price now and retst the lows at 13.64-13.25.
A decent short when it breaks .
But not until. It's holding up with Bitcoin for now.
An eventual break below 13 here will be another extremely bearish signal pointing to further sustained weakness back to the spike low at 3.79. Lesser potential support centered around 6 may serve to induce a counter rally of 50% as we are seeing now.
Big moves in little numbers.

GBPUSD:Look to sell the Counter Rally in GBP before next declineGBPUSD
Sterling has spent all of August in free-fall.
After breaking below the support line at 1.3029 it's finished the week right on the next line of support at 1.2766 after a low on Friday at 1.2723 .
It should counter-rally some more from here, potentially as high as 1.2928-1.2957 at best before it comes off again back to current levels at least.
On the downside any failure on Monday to hold up from 1.2766 and from 1.2720 at the lowest will trigger further near term weakness back to 1.2596.
Worth a short if we see it happen with stops above 1.2770.
Otherwise can look to short again from 1.2928-1.2957 range, as above.
* For fastest real-time updates please see link to Global Markets at top left of main page.

EURNZD Trade setup donePatiently waited for the bull (R.Angle) ascending triangle to complete on 4h chart, with MACD convergence made the trade simple.
Strong bull candles on previous days recommend to break through and move forward,
Loaded up @ 1.7187 with RR=1:5.
Will evaluate the trade during and after.
Happy trading.

EURJPY Potential Long ideaUse the chart to find entry and look at the key levels for indication for the next move.


USOIL: WTI June 3 Trade Points For Week AheadWTI USOIL: June 3rd Trade Points for Week Ahead
Good call/bad call last week here. Was looking to close out the short as the week began at around the 66.48 line and then
reversed long from here looking for 69.48. A forlorn hope.The rally got as high as 68.63 before failing away to end the week
1 pip below the next key support at 65.55 - and busted out the long stop just under 66.47 for a few pips loss as it fell,
before a little bear closing at the end of the week to finish at 65.69.
This price action has left WTI on a knife edge, saved by the closing bell at the downside limit and in desperate need of
buyers right here to avoid a another plunge to 61.92 initially. Any fall below 65.40 can be shorted using a stop above the
66.48 line to begin with looking for 61.92 initial downside..Any subsequent fall below here will signal further weakness to
60.21 and later to 58.25 as we move through the summer months
Looking at upside potential from here, the 65.55-65.50 level is critical to the medium term trend. Bulls know full well this
is their last stand for the summer ahead. It may well try to rally away from here but am not looking to buy it again after
the pattern it's made since the last rally attempt.
But it may tempt contarians...in which case please use a stop only 10 or so pips under the lows of last week and be ready
to reverse short if broken. Am hoping for a good break lower here - but it may defy us a while longer yet if it can find some
respite right here. If so, be prepared wait a little longer still or perhaps consider setting an alert

XRPUSD Ripple: Take nearterm Profits/Next Long Set-UpSaturday Update Take Profits/Next Long Set-Up
Ripple has had a nice break since busting the neck-line and is
now testing the first line of reisistance at .6493
It really needs Bitcoin to break above 7735 for it to power
ahead from here to the next resistance line at 6921.
Can take profits here and get ready to go long again once .65
is taken back by the bulls and then join again with stops a
little below the same line once broken.
11:39gmt 06:39est Friday
Making a little reverse head and shoulders quite similar to
Bitcoin. Has 8 points upside when and if it breaks - which is a
little more than Bitcoin's likely upside potential, even if the
RHS is successful later on today on the daddy.
*For updates in real-time this weekend please check link at
top-left of main page

Ready for a LONG 1st Sign of seller's failure is during 2018-04-13 (UTC+8) 17:00 which couldn't break its own record from the previous low.
2nd Sign of seller's failure is during 2018-04-17 (UTC+8) 21:00 which price did not went down, created a FAKER!
3rd Sign of strong BUYERS showed up forming a V-Formation.
Note: Counter trend trade is carry out on this ( It is still Sellers territories )
Trade Set-Up:
Open: 1.2619
S/L: 1.2584 (35 pips)
T/P: 1.2739 (120 pips)
Aware of the price 1.27400 as the area Sellers breach!!!
Note: If price close back at 1.26190 it might end up all the above trade set-up to be forfeited and turn back to sell side. ( Faker created )

AMAZON: AMZN Big Short Set Up Amazon AMZN Short Set- Up
We've seen this pattern so many times before in Bitcoin...just
100 times faster.
It's the best practice you can get for life outside crytos, life in
the slow-lane.
It's broken the parallel and now is trying to sneak back up the
underside. This pattern usually signals that this is going to
break to the downside very soon now. When it does, follow it
short looking for 1353 minimum and quite likely 1266 or
lower. Stops above the little dynamic now holding up price
when broken.

Bitcoin: BTCUSD Breaking Higher Again - follow with stops Bitcoin Coinbase Chart Breaking Higher Again
10:42gmt/05:42est
It's popped the upper parallel and is now in process of trickling
back down the same parallel - so now we need to see a
higher low set on this decline - maybe at 10333-10300 and if
not off the lower dynamic support line...that is the signal we
need to get long again from here. So far this looks OK though
and is trying to turn back up again.
On downside, if wrong, Bitcoin has to break below 10150 on
Coinbase to trigger any further shorts with stops 100 higher if
triggered at any point from here
Latest Update 11:07gmt/06:07est
Bitcoin Coinbase Chart
This is a natural spot for dayt traders who bought the lows to
close out off the first test of the upper dynamic from the
underside at 10550...this next decline has to make a higher low now to
show that the uptrend remains in tact. So far the selling is
light and a break above the upper dynamic should attract
more buyers as day traders get long again once broken.
Follow that break higher if not long already with stops below
10500

IOTA: IOTUSD Reverse Head+Shoulders with Upside Target at 2992 IOTA IOTUSD
Yet another reverse head and shoulders pattern with
a minimum upside target at 2992 once triggered by a break
above the neck-line which is now closeby at 2.222 - with stops
a little way below the neck-line once broken to upside.

S&P 500 Index Buy Set Up off Swing LowsS&P 500 Potential Buy Set-Ups
Clear continuation pattern as it rinses out every stale bull who
jumped in at the first big impulse wave upwards and on the
wrong side of this now...should make a sweet double bottom
or close to - the first long is a speccy buy with stop either
under today'slow at 2615 or at lowest under that last low to
left of chart at 2590 - and it's another buy/add on breaking of
the upper parallel. So long as this holds at the lows today it
will rally back to the highs and beyond - a 10% rise...this would
just be the start and we can potentially get in close to the
swing low of a major and very rarely occurring dip - last one
was 2 years ago precisely.

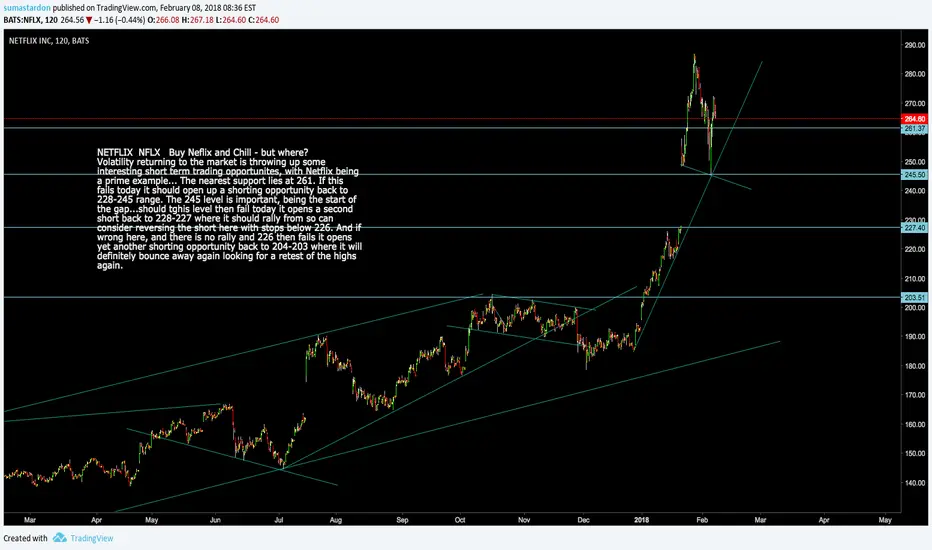
Netflix: NFLX Potential Short then long set-upNETFLIX NFLX Buy Neflix and Chill - but where?
Volatility returning to the market is throwing up some
interesting short term trading opportunites, with Netflix being
a prime example... The nearest support lies at 261. If this
fails today it should open up a shorting opportunity back to
228-245 range. The 245 level is important, being the start of
the gap...should tghis level then fail today it opens a second
short back to 228-227 where it should rally from so can
consider reversing the short here with stops below 226. And if
wrong here, and there is no rally and 226 then fails it opens
yet another shorting opportunity back to 204-203 where it will
definitely bounce away again looking for a retest of the highs
again.
Monero: XMRUSD Short Set-UpMONERO XRMUSD Short Set-Up
Tessting major reistance at 213 and becoming vulnerable to
the next decline. Once it breaks below the small dynamic
support line running under price it should fall away to 150
again and potentially lower still.

Ripple: XRP Next Short Set-UpRipple Next Short set-up
Ripple XRPUSD
Approaching a major resistance point and on verge of next
collapse. See what happens on each previous rally collapse.
Can wait for this to fall below the small dynamic support line
underpinning this rally. Once it breaks it should come back to
test the structure to its left at 0.558, a fall of 30% or so and
worth shorting when signal is given.
