Long ETC if closes above 2.24, TP: 2.72 ETC's investors await good earnings reports today, if it closes above 2.24, the next target is 2.38, and subsequently 2.72. MACD looks goods, relative strength is quite strong. Good short term moving average upward cross. Chart pattern going according to Fibonacci pattern.
Setindex

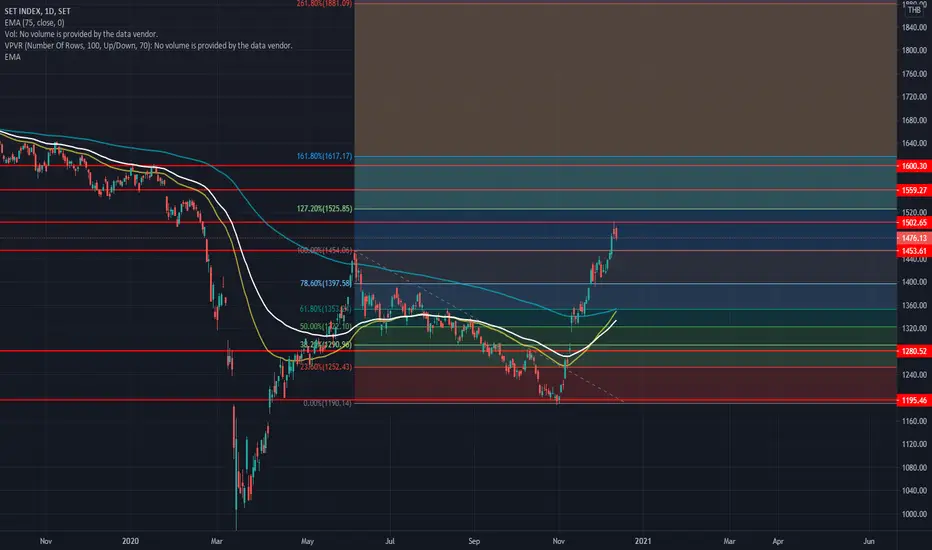
BTCUSD vs SET INDEX: For the Thais looking for Superior Returns1. Clear uptrend formed during the last decade for Bitcoin relative to the SET Index
2. Next target at the upper trend line for an increase of approximately 320%
3. Exacerbated with macroeconomic factors such as COVID-19 and irresponsible monetary policy from central banks
4. A switch from physical, unlimited supply fiat to a digital, hard form of money is inevitable.


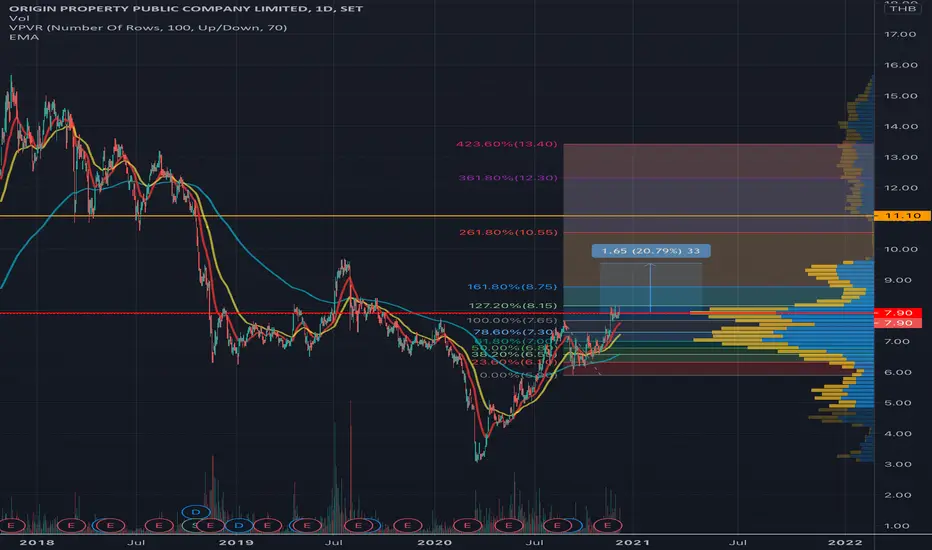
ORI waiting for breakingIf breaking 8.15 then follow buy.
Tp@ the next VPVR then @10.5-11.0
Stop 7.65!


SET:TKN - Long Opportunity - Massive Volume ConsolidatonIs this a Wykcoff - Not sure, but whatever it is, TKN has a an outstanding tradable shares of 532M Shares......My hypothesis is someone accumulating a massive position here.


MINT - Long Position - Volume Consolidation - WykcoffDelusional Wykcoss. 3,189,000,000 M Shares tradable.


S50Z2020 - Daily analysis on 9-10-2020- Daily Timeframe is downtrend
- H4 Timeframe is sideway; try to form higher high
- H1 Timeframe is sideway; try to from higher high. If price don't close below 787, trend reversal in H1
- 15 minute is sideway in uptrend. Trading channel is 800 - 809. If price isn't below 795, It's still stay in uptrend.

S50Z2020 - Daily analysis on 7-10-2020Daily Chart
- Trading channel is 787-777
- Green doji was shown on price chart means sideway on yesterday.
- There is a chance to reach 787.
- Downtrend on daily chart
H1 Chart
- Cluster of candle stick was stuck under supply zone.
- This is a zone for collecting short position.
- Downtrend on Hourly chart.
* Bias Short

S50Z2020 - Daily analysis on 2-10-2020Daily chart
- Trading channel is 777.4 - 800.0
- A candle stick similar to hammer was shown on price chart at support area yesterday mean short term rebound.
- Downtrend in daily chart
Hourly chart
- Trading channel is 774.4 -787.5
- If price across 787.5, high chance to reach 793.
* Bias Short (belong to daily chart show downtrend.
* Rebound and Short strategy today.

S50Z2020 - Daily analysis on 29-9-2020For daily chart
- Trading channel is 777.6 - 801.5
- Bullish reversal candle stick pattern (morning star) was formed on daily chart, but it must be confirmed by today.
- Now, It's downtrend.
For 60 min chart
- Close price is 796.0
- High chance to reach 800 then throwback
- If price throwback isn't less than 788, that's mean price reversal on 60 min chart.
Strategy : Wait and see
