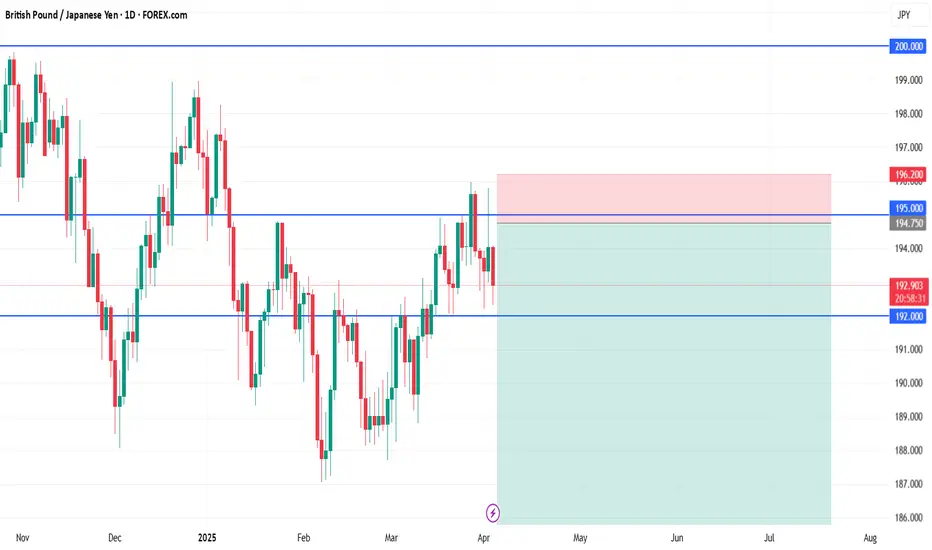
GBP/JPY short🧩 GBP/JPY Swing Short Setup
📍 Entry:
Sell Limit: 194.75
🛡️ Stop Loss (Above Resistance Wick):
SL: 196.20
→ Covers minor breakout/fakeout above 195 zone while protecting against invalidation
🎯 Take Profits:
TP1: 190.00
(Structure floor + first major reaction zone)
TP2: 185.00
(Clean horizontal support and demand zone)
TP3 (Swing Target): 180.00
(Large macro target — monthly structure retest)
🧠 Rationale Recap:
Price is consolidating just under multi-year resistance (195–200)
Fundamentals align: GBP weakening, JPY strengthening in risk-off environment
Strong R:R, clean rejection zone, and macro pressure potential
Setup
$SHOP head and shoulders formation 1M?Hmmm, there was a similar looking setup on NASDAQ:NFLX within the last week of a similar slope up with a head and shoulders like this and it tanked. This will be on watch months to come. Could go long for a month to two and then get ready to short.
WSL

BTC — Bulls in Full Control | Next Stop $87K+?Bitcoin just smashed through the resistance around $84,300, and the bullish momentum is 🔥
Now we’re heading straight into the next key zone at $87,000–$88,765, which lines up perfectly with previous supply.
If bulls keep this pace — a clean push toward 87K looks very real in the coming sessions.
Entry: $84,500 – $85,500
TP: $86,800 – $87,000
SL: $83,500
More thoughts in my profile @93balaclava
Personally I trade on a platform that offers low fees and strong execution. DM me if you're interested.

NeiroETH — Strong Rebound Zone Hit. Big Move Loading?We just tapped into a major demand zone at 0.01532–0.01607, and the reaction was immediate — strong bounce straight off the level.
From here, I’m looking for at least a recovery into the mid-range of the descending channel, with potential for much more.
Main target — a breakout above the local ATH at 0.01993.
More thoughts in my profile @93balaclava
Personally I trade on a platform that offers low fees and strong execution. DM me if you're curious.

ENS — Eyeing the BreakoutSpotting early momentum on ENS — we've entered around 14.383, with a backup limit order waiting on x2 margin at 13.891 for a potential dip grab.
This setup shows solid structure and looks ready to test higher if we hold above key support. The chart’s shaping up for a possible leg up, and I’m eyeing targets at:
14.536 → 14.680 → 14.876 → 15.126 → 15.591
Stop is tight at 13.516 to protect capital. Let’s see how it plays out — looks like we might catch some real movement here.
More thoughts in my profile @93balaclava
Personally I trade on a platform that offers low fees and strong execution. DM me if you're curious.

ROSE — Quiet Strength Before the BloomClean entry on ROSE at 0.02436, with another limit order ready on margin at 0.02367. The price action has been subtle, but the setup hints at accumulation. If bulls hold the range — upside could come quick.
Watching for a grind-up toward:
0.02462 → 0.02498 → 0.02559 → 0.02621 → 0.02682
Stop set at 0.02306 — controlled risk, promising potential. This one’s for patient hands — could pay off well.
More thoughts in my profile @93balaclava
Personally I trade on a platform that offers low fees and strong execution. DM me if you're curious.

Gold Rebounds Off Key Support — Next Leg to $4,200 = 124,000 PIP
View our previous 120,000 PIPs (target hit) Gold trades at the bottom of this page.
Following our previously fulfilled short trade from the top of the ascending channel (TP2 hit at $2,960), gold has now landed precisely at confluence support — aligning with the psychological $3,000 level, ascending channel support, the quarterly dynamic support, and the prior swing high zone. We are now flipping bias long, with a macro continuation in mind, while still respecting the shorter-term range structure.
Structure & Setup:
Another clean reaction from the ascending channel’s lower boundary reaffirms the structure’s technical validity. Price has now tapped the $3,000 round number support, intersecting with the channel base and our prior short target zone — offering strong risk-defined long opportunities.
Macro Context Holds:
Our long-term thesis targeting $4,270 remains intact, backed by structural breakout on the quarterly chart and fundamental gold demand. This move is potentially the start of the next impulsive leg in a broader macro expansion, though we expect the asset to oscillate within the channel boundaries until at least July.
Entry Logic:
This long setup is based on:
– Channel base bounce
– $3,000 psychological round number
- $2,960 quarterly dynamic support
– Reversal at former Take Profit 2 (TP2) short target
– Tight invalidation just below $2,960
– Favourable 1:11+ R:R targeting macro highs
Invalidation:
A clean break and close below $2,960 would invalidate the long thesis and suggest breakdown risk. Until then, structure holds.
Pip Potential:
From $2,960 to $4,200 = 124,000 pips upside potential — aligning with macro projections and Fib extensions from previous cycles (-1.414 & -1.618 zones).
Outlook:
While $4,200 remains our long-term target, we anticipate ranging between $2,960–$3,200 for the next several months. This accumulation phase may precede a breakout leg that targets historical Fibonacci confluence zones.
Summary:
Short trade complete — bias flipped long. We’ve now transitioned from a completed 1:4 R:R short into a 1:11+ macro long off textbook technical levels. Price action is behaving cleanly within the multi-month channel, and this latest support reaction adds further credibility to the bullish continuation thesis.
Let price consolidate — buy positions accordingly. The macro expansion to $4,200 is likely underway.
Previous Short:
75,000 PIP idea (Target hit):
45,000 PIP idea (Target hit):

AUDJPY to find buyers at previous resistance?AUDJPY - 24h expiry
There is no indication that the rally is coming to an end.
Further upside is expected.
Risk/Reward would be poor to call a buy from current levels.
A move through 91.00 will confirm the bullish momentum.
The measured move target is 92.00.
We look to Buy at 89.50 (stop at 88.50)
Our profit targets will be 91.50 and 92.00
Resistance: 91.00 / 91.50 / 92.00
Support: 90.00 / 89.50 / 89.00
Risk Disclaimer
The trade ideas beyond this page are for informational purposes only and do not constitute investment advice or a solicitation to trade. This information is provided by Signal Centre, a third-party unaffiliated with OANDA, and is intended for general circulation only. OANDA does not guarantee the accuracy of this information and assumes no responsibilities for the information provided by the third party. The information does not take into account the specific investment objectives, financial situation, or particular needs of any particular person. You should take into account your specific investment objectives, financial situation, and particular needs before making a commitment to trade, including seeking advice from an independent financial adviser regarding the suitability of the investment, under a separate engagement, as you deem fit.
You accept that you assume all risks in independently viewing the contents and selecting a chosen strategy.
Where the research is distributed in Singapore to a person who is not an Accredited Investor, Expert Investor or an Institutional Investor, Oanda Asia Pacific Pte Ltd (“OAP“) accepts legal responsibility for the contents of the report to such persons only to the extent required by law. Singapore customers should contact OAP at 6579 8289 for matters arising from, or in connection with, the information/research distributed.

WLD — Heavy Discount. Long-Term Opportunity on the TableWLD has pulled back over 80% from its previous high — a massive correction that now opens the door for long-term accumulation. The current range looks like a gift for patient players. Don’t sleep on setups like this — they don’t come often.
Follow for more high-conviction plays like this one.
Entry: 0,7-0,71
TP: 1,37-3,35

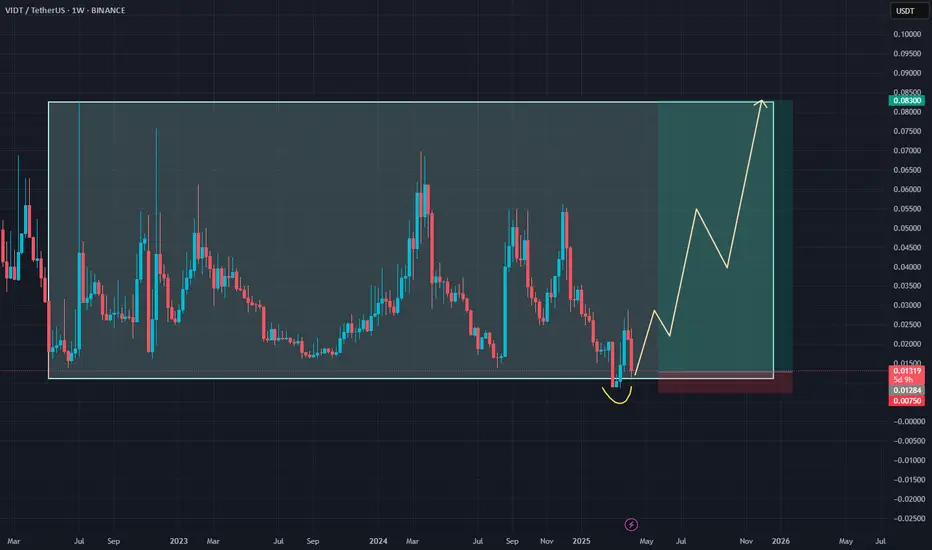
VIDT: High-Risk, High-Reward Setup at Range Low#VIDT is moving in a clear sideways range, and we’re now trading right at the lower boundary. This is a high-risk trade, but the potential reward justifies the setup—especially if we see a strong bounce from current levels.
Don’t miss the next moves—make sure to follow for more setups like this.
Entry: 0.013
TP: 0.083
SL: 0.0075
BTC: FVG Filled – Room for Further Downside?#BTC didn’t reach the major demand zones below but gave us a minor bounce and filled the Fair Value Gap (FVG).
Now that the FVG is filled, the chart looks ready to continue the move down into stronger support areas.
Stay locked in—follow me so you don’t miss the next key levels. 📉✅

NZDUSD to see a temporary move higher?NZDUSD - 24h expiry
There is no indication that the selloff is coming to an end.
A higher correction is expected.
Risk/Reward would be poor to call a sell from current levels.
A move through 0.5600 will confirm the bearish momentum.
The measured move target is 0.5525.
We look to Sell at 0.5650 (stop at 0.5700)
Our profit targets will be 0.5550 and 0.5525
Resistance: 0.5625 / 0.5650 / 0.5675
Support: 0.5600 / 0.5550 / 0.5525
Risk Disclaimer
The trade ideas beyond this page are for informational purposes only and do not constitute investment advice or a solicitation to trade. This information is provided by Signal Centre, a third-party unaffiliated with OANDA, and is intended for general circulation only. OANDA does not guarantee the accuracy of this information and assumes no responsibilities for the information provided by the third party. The information does not take into account the specific investment objectives, financial situation, or particular needs of any particular person. You should take into account your specific investment objectives, financial situation, and particular needs before making a commitment to trade, including seeking advice from an independent financial adviser regarding the suitability of the investment, under a separate engagement, as you deem fit.
You accept that you assume all risks in independently viewing the contents and selecting a chosen strategy.
Where the research is distributed in Singapore to a person who is not an Accredited Investor, Expert Investor or an Institutional Investor, Oanda Asia Pacific Pte Ltd (“OAP“) accepts legal responsibility for the contents of the report to such persons only to the extent required by law. Singapore customers should contact OAP at 6579 8289 for matters arising from, or in connection with, the information/research distributed.

ACT: Classic Range Accumulation with Breakout Potential#ACT is showing clean sideways movement with classic deviations—textbook accumulation. Horizontal volume is stacked right in the middle, confirming the range is solid.
This one’s coiling up for a move. Follow me so you’re in before it breaks out. 🚀
Entry: 0.052-0.0536
TP: 0.068
SL: 0.0463

Has SPX formed a bottom?SPX500USD - 24h expiry
Price action looks to be forming a bottom.
A Doji style candle has been posted from the base.
Setbacks should be limited to yesterday's low.
We look to buy dips.
Risk/Reward would be poor to call a buy from current levels.
We look to Buy at 4900.5 (stop at 4767.5)
Our profit targets will be 5295.5 and 5365.5
Resistance: 5219.6 / 5350.0 / 5500.0
Support: 5100.0 / 5000.0 / 4812.2
Risk Disclaimer
The trade ideas beyond this page are for informational purposes only and do not constitute investment advice or a solicitation to trade. This information is provided by Signal Centre, a third-party unaffiliated with OANDA, and is intended for general circulation only. OANDA does not guarantee the accuracy of this information and assumes no responsibilities for the information provided by the third party. The information does not take into account the specific investment objectives, financial situation, or particular needs of any particular person. You should take into account your specific investment objectives, financial situation, and particular needs before making a commitment to trade, including seeking advice from an independent financial adviser regarding the suitability of the investment, under a separate engagement, as you deem fit.
You accept that you assume all risks in independently viewing the contents and selecting a chosen strategy.
Where the research is distributed in Singapore to a person who is not an Accredited Investor, Expert Investor or an Institutional Investor, Oanda Asia Pacific Pte Ltd (“OAP“) accepts legal responsibility for the contents of the report to such persons only to the extent required by law. Singapore customers should contact OAP at 6579 8289 for matters arising from, or in connection with, the information/research distributed.

USDJPY to continue in the downward move?USDJPY - 24h expiry
The rally was sold and the dip bought resulting in mild net gains yesterday.
Selling posted in Asia.
We have a Gap open at 147.02 from 04.04 to 06.04.
The medium term bias remains bearish.
A Fibonacci confluence area is located at 143.68.
Preferred trade is to sell into rallies.
We look to Sell at 147.02 (stop at 148.02)
Our profit targets will be 143.68 and 143.10
Resistance: 147.02 / 148.09 / 150.49
Support: 144.58 / 143.68 / 143.07
Risk Disclaimer
The trade ideas beyond this page are for informational purposes only and do not constitute investment advice or a solicitation to trade. This information is provided by Signal Centre, a third-party unaffiliated with OANDA, and is intended for general circulation only. OANDA does not guarantee the accuracy of this information and assumes no responsibilities for the information provided by the third party. The information does not take into account the specific investment objectives, financial situation, or particular needs of any particular person. You should take into account your specific investment objectives, financial situation, and particular needs before making a commitment to trade, including seeking advice from an independent financial adviser regarding the suitability of the investment, under a separate engagement, as you deem fit.
You accept that you assume all risks in independently viewing the contents and selecting a chosen strategy.
Where the research is distributed in Singapore to a person who is not an Accredited Investor, Expert Investor or an Institutional Investor, Oanda Asia Pacific Pte Ltd (“OAP“) accepts legal responsibility for the contents of the report to such persons only to the extent required by law. Singapore customers should contact OAP at 6579 8289 for matters arising from, or in connection with, the information/research distributed.

EURUSD forming a top?EURUSD - Intraday
Continued upward momentum from 1.0778 resulted in the pair posting net daily gains yesterday.
Trades at the highest level in 6 months.
A Fibonacci confluence area is located at 1.1105.
Our medium term bias is bearish below 1.1014 towards 1.0700.
There is scope for mild buying at the open but gains should be limited.
We look to Sell at 1.1160 (stop at 1.1245)
Our profit targets will be 1.0837 and 1.0700
Resistance: 1.1146 / 1.1160 / 1.1214
Support: 1.0837 / 1.0700 / 1.0675
Risk Disclaimer
The trade ideas beyond this page are for informational purposes only and do not constitute investment advice or a solicitation to trade. This information is provided by Signal Centre, a third-party unaffiliated with OANDA, and is intended for general circulation only. OANDA does not guarantee the accuracy of this information and assumes no responsibilities for the information provided by the third party. The information does not take into account the specific investment objectives, financial situation, or particular needs of any particular person. You should take into account your specific investment objectives, financial situation, and particular needs before making a commitment to trade, including seeking advice from an independent financial adviser regarding the suitability of the investment, under a separate engagement, as you deem fit.
You accept that you assume all risks in independently viewing the contents and selecting a chosen strategy.
Where the research is distributed in Singapore to a person who is not an Accredited Investor, Expert Investor or an Institutional Investor, Oanda Asia Pacific Pte Ltd (“OAP“) accepts legal responsibility for the contents of the report to such persons only to the extent required by law. Singapore customers should contact OAP at 6579 8289 for matters arising from, or in connection with, the information/research distributed.

NQ - Nasdaq's potential to reboundThe Median or Centerline:
The Median (Centerline) Line is the central element of the Pitchfork and acts as the equilibrium point. Price tends to oscillate around this line, and it often serves as a strong reference for potential reversals or price targets. A price move back toward the Median Line is common after significant moves away from it.
Pitchfork (Red):
The red Pitchfork, drawn through significant price points, provides the overall trend direction and shows the potential path to the downside. The red line indicates a bearish bias in the current setup, as it has been guiding the price lower.
Green Circles and Arrows:
These represent key areas of support.
The lower green circle and green arrows indicate price has found solid support in this region. The price has been bouncing from this support level, showing that it is reacting to the [ower boundary of the Pitchfork. This behavior aligns with the rule that the price tends to respect these boundaries, creating a foundation for a potential move back toward the Median Line.
Price Action Analysis:
The price recently tested the lower green circle and green arrows, bouncing off this support level, which is a typical reaction in a Pitchfork setup.
According to the Median Line theory , when the price moves too far away from the Median Line, it often returns toward it. Therefore, the bounce off the lower boundary suggests that price may now be setting up for a bullish reversal toward the RED Median Line .
Bottom Line:
The price action is following the general Pitchfork playbook . The bounce from the lower green circle suggests that the price is setting up for a potential bullish reversal toward the RED Median Line .
The next major test will be the upper resistance in the red Pitchfork , after the break of the Centerline. If the price can break through this resistance, a strong move higher is likely.
Keep an eye on this critical point!

AUDJPY to find sellers at market price?AUDJPY - 24h expiry
There is no indication that the selloff is coming to an end.
Further downside is expected.
Risk/Reward would be poor to call a sell from current levels.
A move through 92.50 will confirm the bearish momentum.
The measured move target is 91.75.
We look to Sell at 93.00 (stop at 93.50)
Our profit targets will be 92.00 and 91.75
Resistance: 92.75 / 93.00 / 93.25
Support: 92.25 / 92.00 / 91.75
Risk Disclaimer
The trade ideas beyond this page are for informational purposes only and do not constitute investment advice or a solicitation to trade. This information is provided by Signal Centre, a third-party unaffiliated with OANDA, and is intended for general circulation only. OANDA does not guarantee the accuracy of this information and assumes no responsibilities for the information provided by the third party. The information does not take into account the specific investment objectives, financial situation, or particular needs of any particular person. You should take into account your specific investment objectives, financial situation, and particular needs before making a commitment to trade, including seeking advice from an independent financial adviser regarding the suitability of the investment, under a separate engagement, as you deem fit.
You accept that you assume all risks in independently viewing the contents and selecting a chosen strategy.
Where the research is distributed in Singapore to a person who is not an Accredited Investor, Expert Investor or an Institutional Investor, Oanda Asia Pacific Pte Ltd (“OAP“) accepts legal responsibility for the contents of the report to such persons only to the extent required by law. Singapore customers should contact OAP at 6579 8289 for matters arising from, or in connection with, the information/research distributed.

EURAUD rallies continue to attract sellers.EURAUD - 24h expiry
Trading has been mixed and volatile.
We look for a temporary move higher.
Preferred trade is to sell into rallies.
Risk/Reward would be poor to call a sell from current levels.
Bespoke resistance is located at 1.7265.
We look to Sell at 1.7265 (stop at 1.7325)
Our profit targets will be 1.7025 and 1.7000
Resistance: 1.7250 / 1.7310 / 1.7365
Support: 1.7100 / 1.7050 / 1.6950
Risk Disclaimer
The trade ideas beyond this page are for informational purposes only and do not constitute investment advice or a solicitation to trade. This information is provided by Signal Centre, a third-party unaffiliated with OANDA, and is intended for general circulation only. OANDA does not guarantee the accuracy of this information and assumes no responsibilities for the information provided by the third party. The information does not take into account the specific investment objectives, financial situation, or particular needs of any particular person. You should take into account your specific investment objectives, financial situation, and particular needs before making a commitment to trade, including seeking advice from an independent financial adviser regarding the suitability of the investment, under a separate engagement, as you deem fit.
You accept that you assume all risks in independently viewing the contents and selecting a chosen strategy.
Where the research is distributed in Singapore to a person who is not an Accredited Investor, Expert Investor or an Institutional Investor, Oanda Asia Pacific Pte Ltd (“OAP“) accepts legal responsibility for the contents of the report to such persons only to the extent required by law. Singapore customers should contact OAP at 6579 8289 for matters arising from, or in connection with, the information/research distributed.

SPX to find sellers at previous resistance?SPX500USD - 24h expiry
Daily signals are bearish.
Short term bias has turned negative.
Previous resistance located at 5700.
20 1day EMA is at 5699.8.
5705.4 has been pivotal.
We look to Sell at 5699.5 (stop at 5743.5)
Our profit targets will be 5585.5 and 5565.5
Resistance: 5630.0 / 5658.9 / 5700.0
Support: 5602.4 / 5564.3 / 5495.3
Risk Disclaimer
The trade ideas beyond this page are for informational purposes only and do not constitute investment advice or a solicitation to trade. This information is provided by Signal Centre, a third-party unaffiliated with OANDA, and is intended for general circulation only. OANDA does not guarantee the accuracy of this information and assumes no responsibilities for the information provided by the third party. The information does not take into account the specific investment objectives, financial situation, or particular needs of any particular person. You should take into account your specific investment objectives, financial situation, and particular needs before making a commitment to trade, including seeking advice from an independent financial adviser regarding the suitability of the investment, under a separate engagement, as you deem fit.
You accept that you assume all risks in independently viewing the contents and selecting a chosen strategy.
Where the research is distributed in Singapore to a person who is not an Accredited Investor, Expert Investor or an Institutional Investor, Oanda Asia Pacific Pte Ltd (“OAP“) accepts legal responsibility for the contents of the report to such persons only to the extent required by law. Singapore customers should contact OAP at 6579 8289 for matters arising from, or in connection with, the information/research distributed.

IAG Airlines Group what next? $261 Reached & Breached! $172?🤔 IAG Airlines Group what next?
ℹ️ $261 Reached & Breached!
Will the $261 be regained and start to offer some support or is $172 NEXT?❓️❔️❓️
🌍 To be completely transparent I have no horse in this race at the moment BUT I really would like a serious flush to try and accumulate a long-term POSITION.
🟢SeekingPips🟢 is not interested at current price at all unless we start to see some SERIOUS VOLUME START TO COME IN TO PLAY

ASX200 to find buyers at market price?AU200AUD - 24h expiry
Risk/reward is ample to call a sell trade.
Offers ample risk/reward to sell at the market.
Daily signals are bearish.
We are trading at oversold extremes.
20 1day EMA is at 7976.
We look to Sell at 7975 (stop at 8031)
Our profit targets will be 7815 and 7765
Resistance: 7981 / 8003 / 8028
Support: 7894 / 7860 / 7807
Risk Disclaimer
The trade ideas beyond this page are for informational purposes only and do not constitute investment advice or a solicitation to trade. This information is provided by Signal Centre, a third-party unaffiliated with OANDA, and is intended for general circulation only. OANDA does not guarantee the accuracy of this information and assumes no responsibilities for the information provided by the third party. The information does not take into account the specific investment objectives, financial situation, or particular needs of any particular person. You should take into account your specific investment objectives, financial situation, and particular needs before making a commitment to trade, including seeking advice from an independent financial adviser regarding the suitability of the investment, under a separate engagement, as you deem fit.
You accept that you assume all risks in independently viewing the contents and selecting a chosen strategy.
Where the research is distributed in Singapore to a person who is not an Accredited Investor, Expert Investor or an Institutional Investor, Oanda Asia Pacific Pte Ltd (“OAP“) accepts legal responsibility for the contents of the report to such persons only to the extent required by law. Singapore customers should contact OAP at 6579 8289 for matters arising from, or in connection with, the information/research distributed.

EURAUD forming a top?EURAUD - 24h expiry
Trading has been mixed and volatile.
We look for a temporary move higher.
Preferred trade is to sell into rallies.
Bearish divergence is expected to cap gains.
Bespoke resistance is located at 1.7360.
We look to Sell at 1.7360 (stop at 1.7420)
Our profit targets will be 1.7120 and 1.7080
Resistance: 1.7360 / 1.7420 / 1.7470
Support: 1.7275 / 1.7185 / 1.7090
Risk Disclaimer
The trade ideas beyond this page are for informational purposes only and do not constitute investment advice or a solicitation to trade. This information is provided by Signal Centre, a third-party unaffiliated with OANDA, and is intended for general circulation only. OANDA does not guarantee the accuracy of this information and assumes no responsibilities for the information provided by the third party. The information does not take into account the specific investment objectives, financial situation, or particular needs of any particular person. You should take into account your specific investment objectives, financial situation, and particular needs before making a commitment to trade, including seeking advice from an independent financial adviser regarding the suitability of the investment, under a separate engagement, as you deem fit.
You accept that you assume all risks in independently viewing the contents and selecting a chosen strategy.
Where the research is distributed in Singapore to a person who is not an Accredited Investor, Expert Investor or an Institutional Investor, Oanda Asia Pacific Pte Ltd (“OAP“) accepts legal responsibility for the contents of the report to such persons only to the extent required by law. Singapore customers should contact OAP at 6579 8289 for matters arising from, or in connection with, the information/research distributed.
