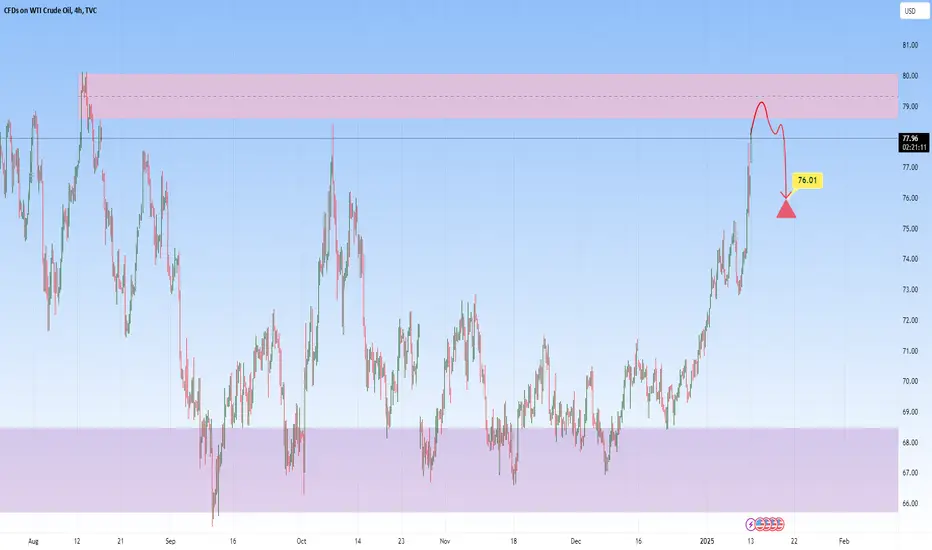
USOIL Short Setup: Key Zone to WatchUSOIL is testing a significant resistance zone around the 78.00 level, an area where price previously faced strong selling pressure. Current price action suggests potential exhaustion, with signs of rejection visible.
If sellers take control, a pullback toward the 76.01 level, acting as the first key support, could be in play. Traders should look for bearish confirmation, such as reversal candlestick patterns or breakdowns below recent lows, to position for a potential short move.
Setup
EURGBP to continue in the bullish channel?EURGBP - 24h expiry
Intraday dips continue to attract buyers and there is no clear indication that this sequence for trading is coming to an end.
20 4hour EMA is at 0.8429.
We look to buy dips.
Dip buying offers good risk/reward.
A break of the recent high at 0.8463 should result in a further move higher.
We look to Buy at 0.8431 (stop at 0.8409)
Our profit targets will be 0.8489 and 0.8499
Resistance: 0.8454 / 0.8464 / 0.8485
Support: 0.8436 / 0.8420 / 0.8404
Risk Disclaimer
The trade ideas beyond this page are for informational purposes only and do not constitute investment advice or a solicitation to trade. This information is provided by Signal Centre, a third-party unaffiliated with OANDA, and is intended for general circulation only. OANDA does not guarantee the accuracy of this information and assumes no responsibilities for the information provided by the third party. The information does not take into account the specific investment objectives, financial situation, or particular needs of any particular person. You should take into account your specific investment objectives, financial situation, and particular needs before making a commitment to trade, including seeking advice from an independent financial adviser regarding the suitability of the investment, under a separate engagement, as you deem fit.
You accept that you assume all risks in independently viewing the contents and selecting a chosen strategy.
Where the research is distributed in Singapore to a person who is not an Accredited Investor, Expert Investor or an Institutional Investor, Oanda Asia Pacific Pte Ltd (“OAP“) accepts legal responsibility for the contents of the report to such persons only to the extent required by law. Singapore customers should contact OAP at 6579 8289 for matters arising from, or in connection with, the information/research distributed.

BTCUSD | 1D SMC Short Setup with Refined SL and TargetsDescription:
This analysis identifies a high-probability short opportunity for BTCUSD on the 1D timeframe using the Smart Money Concepts (SMC) framework. The chart shows clear bearish confluences, including market structure, supply zones, liquidity levels, and Fibonacci retracement zones. I believe the current bullish momentum is merely a manipulation driven by inflation news and the upcoming Trump inauguration. Following these events, I anticipate a significant market correction. Here’s the detailed breakdown and trade plan:
Analysis:
Market Structure:
Break of Structure (BOS): Price has confirmed a bearish trend with BOS to the downside, signaling a continuation of lower highs and lower lows.
Trendline Resistance: A well-defined downward trendline indicates selling pressure, reinforcing the bearish bias.
Key Zones and Liquidity:
Supply Zone: Highlighted in purple at $102,000-$104,000 . This zone represents an area where strong selling previously occurred, creating an imbalance.
Golden Zone (Fibonacci Retracement): Located around $101,000-$103,000 , this area aligns with the 61.8%-78.6% retracement levels and offers a high-probability reversal opportunity.
Weak High: The high near $104,000 represents untapped liquidity, which smart money may target for a liquidity grab before reversing lower.
Equal Lows (EQL): Around $92,000 , these act as a bearish target where liquidity rests, aligning with the continuation of the bearish trend.
Confluences for Short Entry:
Price is approaching the supply zone and Fibonacci Golden Zone , indicating a potential reversal point.
The weak high may trigger a liquidity grab to entice buyers before sellers regain control.
Previous BOS and trendline resistance add further validation to the bearish bias.
Trade Plan:
Short Entry Setup:
Entry Zone: $102,000-$104,000 (inside the supply zone and Golden Zone).
Stop Loss (SL): $105,500 (above the supply zone and imbalance to account for liquidity grabs).
Take Profit Levels:
TP1: $97,000 – Close partial profits at this imbalance mitigation level.
TP2: $92,000 – Target the equal lows and resting liquidity.
TP3: $88,000 – Final target near the blue demand zone for maximum reward.
Risk-Reward Ratio:
With the entry at $103,000 (midpoint of supply), SL at $105,500, and TP at $92,000, the trade offers a 1:4 RR or better, depending on execution and scaling.
Additional Notes:
Monitor the price action closely as BTC approaches the supply zone for confirmation, such as bearish candlestick patterns or lower timeframe CHoCH (Change of Character).
Scaling into the trade in smaller portions across the supply zone can improve overall entry precision.
Adjust stop loss or take profit levels as market conditions evolve

LTC - Loads more up to goI've had a lot of requests for custom analysis on LTC. Its looking strong within the channel and there's potential for lots more up to complete the X wave, which would still look corrective in a very straightforward looking ABC. I actually don't like LTC too much. It's slow, sluggish, doesn't keep up with market trends. But, it's looking strong for some more up. Follow and share for more.

BTC, higher highs incomingBTC has shown huge confidence in with a trendline breakout on price, volume and MACD is looking near vertical too. These are what I call signals that 'jive' together. I would never place a trade on one signal alone, I try and gain as many signals to jive as possible before risking any assets. It's great to see and that means we're within the long awaited wave 5 of larger degree of trend 1. Which, would see at least 135k. Exciting, high confidence here. Follow and share for more.

Is This the Most Perfect Bollinger Band Breakout Ever?I’ve been keeping an eye on XCN/USDC, and this latest move is something else. After a sharp drop that looked like a liquidity grab, we’ve seen a stunning recovery and breakout above the upper Bollinger Band. Could this be the start of something huge?
This kind of setup has the potential to keep running, and I wouldn’t be surprised if we see new highs soon. Is this the strongest bounce we’ve seen in weeks, or do you think there’s more consolidation ahead?
Drop your thoughts, follow, and share for more insights like this. Let’s see where this takes us!

Nikkei to find sellers at previous support?NIK225 - 24h expiry
Price action looks to be forming a bottom.
A higher correction is expected.
With the Ichimoku cloud resistance above we expect gains to be limited.
We therefore, prefer to fade into the rally with a tight stop in anticipation of a move back lower.
Further downside is expected although we prefer to sell into rallies close to the 39280 level.
We look to Sell at 39280 (stop at 39607)
Our profit targets will be 38345 and 37705
Resistance: 39660 / 40720 / 42155
Support: 37705 / 36330 / 34955
Risk Disclaimer
The trade ideas beyond this page are for informational purposes only and do not constitute investment advice or a solicitation to trade. This information is provided by Signal Centre, a third-party unaffiliated with OANDA, and is intended for general circulation only. OANDA does not guarantee the accuracy of this information and assumes no responsibilities for the information provided by the third party. The information does not take into account the specific investment objectives, financial situation, or particular needs of any particular person. You should take into account your specific investment objectives, financial situation, and particular needs before making a commitment to trade, including seeking advice from an independent financial adviser regarding the suitability of the investment, under a separate engagement, as you deem fit.
You accept that you assume all risks in independently viewing the contents and selecting a chosen strategy.
Where the research is distributed in Singapore to a person who is not an Accredited Investor, Expert Investor or an Institutional Investor, Oanda Asia Pacific Pte Ltd (“OAP“) accepts legal responsibility for the contents of the report to such persons only to the extent required by law. Singapore customers should contact OAP at 6579 8289 for matters arising from, or in connection with, the information/research distributed.

Pareto Chart V.1 Crypto The Whale’s Perspective: A Comprehensive Framework for Market Mastery
This chart setup reflects a disciplined and strategic approach to navigating the cryptocurrency market. Rooted in principles of supply and demand, institutional flows, and psychological patterns, it aligns with a philosophy designed to trade like a whale and outsmart retail sentiment. Here's the philosophy behind it:
1. Big Picture Thinking: Macro Over Micro
The combination of BTC/USD, ETH/USD, and BTC Dominance charts provides a holistic view of market dynamics. BTC sets the tone for macro trends, ETH offers insights into altcoin strength, and dominance charts highlight shifts in risk appetite between Bitcoin and altcoins.
Why it Matters: Big-picture thinking ensures you're not distracted by short-term noise but stay focused on structural trends and institutional flows.
2. Momentum and Mean Reversion: RSI as a Psychological Barometer
The RSI on BTC and ETH charts highlights overbought and oversold zones, giving insight into market momentum and the emotional state of participants.
How to Use It: A contrarian mindset takes advantage of extreme fear (RSI < 30) or euphoria (RSI > 70), aligning entries and exits with shifts in sentiment.
3. Supply and Demand: Volume Profile and VWAP
The Volume Profile and VWAP on BTC and ETH emphasize key liquidity zones and institutional value areas. Price gravitates toward these zones, where high-volume transactions indicate areas of accumulation or distribution.
Philosophy : Accumulate at demand zones and distribute at supply zones, trading where the whales operate.
4. Contrarian Sentiment: Fear and Greed Index
The Fear and Greed Index serves as a pulse for market psychology, complementing technical analysis. Extreme fear often aligns with buying opportunities, while extreme greed signals caution and distribution.
Guiding Principle: "Buy when others are fearful, sell when others are greedy." This aligns with the contrarian aspect of the philosophy.
5. ETH/BTC Pair: Risk-On/Risk-Off Dynamics
The ETH/BTC chart is a critical indicator of altcoin strength relative to Bitcoin. A rising ETH/BTC ratio signals a "risk-on" environment where altcoins outperform, while a declining ratio points to Bitcoin dominance and risk-off sentiment.
Tactical Use: Adjust portfolio allocations based on the relative strength of ETH against BTC.
6. Discipline and Patience
This setup emphasizes disciplined entries and exits at high-probability zones. Alerts, support/resistance levels, and confluence across indicators help avoid impulsive trades.
Mindset: Wait for the trade to come to you. Reacting prematurely sacrifices the strategic edge.
Conclusion: The Art of Whale-Level Trading
This setup embodies a whale’s approach to the market: strategic, data-driven, and psychologically grounded. By combining macro insights, sentiment analysis, and technical precision, this framework empowers traders to align with smart money and capitalize on the inefficiencies of emotional retail behavior.

EURNZD to find buyers around market price?EURNZD - 24h expiry
The primary trend remains bullish. Dips continue to attract buyers. Dip buying offers good risk/reward. 20 1day EMA is at 1.8353. We look for a temporary move lower.
We look to Buy at 1.8355 (stop at 1.8295)
Our profit targets will be 1.8505 and 1.8535
Resistance: 1.8340 / 1.8481 / 1.8500
Support: 1.8368 / 1.8350 / 1.8280
Risk Disclaimer
The trade ideas beyond this page are for informational purposes only and do not constitute investment advice or a solicitation to trade. This information is provided by Signal Centre, a third-party unaffiliated with OANDA, and is intended for general circulation only. OANDA does not guarantee the accuracy of this information and assumes no responsibilities for the information provided by the third party. The information does not take into account the specific investment objectives, financial situation, or particular needs of any particular person. You should take into account your specific investment objectives, financial situation, and particular needs before making a commitment to trade, including seeking advice from an independent financial adviser regarding the suitability of the investment, under a separate engagement, as you deem fit.
You accept that you assume all risks in independently viewing the contents and selecting a chosen strategy.
Where the research is distributed in Singapore to a person who is not an Accredited Investor, Expert Investor or an Institutional Investor, Oanda Asia Pacific Pte Ltd (“OAP“) accepts legal responsibility for the contents of the report to such persons only to the extent required by law. Singapore customers should contact OAP at 6579 8289 for matters arising from, or in connection with, the information/research distributed.

bch sell midterm buy limit"🌟 Welcome to Golden Candle! 🌟
We're a team of 📈 passionate traders 📉 who love sharing our 🔍 technical analysis insights 🔎 with the TradingView community. 🌎
Our goal is to provide 💡 valuable perspectives 💡 on market trends and patterns, but 🚫 please note that our analyses are not intended as buy or sell recommendations. 🚫
Instead, they reflect our own 💭 personal attitudes and thoughts. 💭
Follow along and 📚 learn 📚 from our analyses! 📊💡"

GBPUSD to continue in the downward move?GBPUSD - Intraday
The primary trend remains bearish.
Bullish divergence is expected to support prices.
We look for a temporary move higher.
Preferred trade is to sell into rallies.
Bespoke resistance is located at 1.2350.
We look to Sell at 1.2350 (stop at 1.2380)
Our profit targets will be 1.2245 and 1.2225
Resistance: 1.2320 / 1.2360 / 1.2400
Support: 1.2240 / 1.2210 / 1.2180
Risk Disclaimer
The trade ideas beyond this page are for informational purposes only and do not constitute investment advice or a solicitation to trade. This information is provided by Signal Centre, a third-party unaffiliated with OANDA, and is intended for general circulation only. OANDA does not guarantee the accuracy of this information and assumes no responsibilities for the information provided by the third party. The information does not take into account the specific investment objectives, financial situation, or particular needs of any particular person. You should take into account your specific investment objectives, financial situation, and particular needs before making a commitment to trade, including seeking advice from an independent financial adviser regarding the suitability of the investment, under a separate engagement, as you deem fit.
You accept that you assume all risks in independently viewing the contents and selecting a chosen strategy.
Where the research is distributed in Singapore to a person who is not an Accredited Investor, Expert Investor or an Institutional Investor, Oanda Asia Pacific Pte Ltd (“OAP“) accepts legal responsibility for the contents of the report to such persons only to the extent required by law. Singapore customers should contact OAP at 6579 8289 for matters arising from, or in connection with, the information/research distributed.

EURAUD to see a capped rally?EURAUD - 24h expiry
The medium term bias remains bearish.
A higher correction is expected.
Preferred trade is to sell into rallies.
Bespoke resistance is located at 1.6680.
The hourly chart technicals suggests further upside before the downtrend returns.
We look to Sell at 1.6680 (stop at 1.6730)
Our profit targets will be 1.6540 and 1.6510
Resistance: 1.6660 / 1.6700 / 1.6750
Support: 1.6600 / 1.6550 / 1.6500
Risk Disclaimer
The trade ideas beyond this page are for informational purposes only and do not constitute investment advice or a solicitation to trade. This information is provided by Signal Centre, a third-party unaffiliated with OANDA, and is intended for general circulation only. OANDA does not guarantee the accuracy of this information and assumes no responsibilities for the information provided by the third party. The information does not take into account the specific investment objectives, financial situation, or particular needs of any particular person. You should take into account your specific investment objectives, financial situation, and particular needs before making a commitment to trade, including seeking advice from an independent financial adviser regarding the suitability of the investment, under a separate engagement, as you deem fit.
You accept that you assume all risks in independently viewing the contents and selecting a chosen strategy.
Where the research is distributed in Singapore to a person who is not an Accredited Investor, Expert Investor or an Institutional Investor, Oanda Asia Pacific Pte Ltd (“OAP“) accepts legal responsibility for the contents of the report to such persons only to the extent required by law. Singapore customers should contact OAP at 6579 8289 for matters arising from, or in connection with, the information/research distributed.

NZDJPY forming a top?NZDJPY - 24h expiry
The primary trend remains bearish.
Price action looks to be forming a top.
Preferred trade is to sell into rallies.
The hourly chart technicals suggests further upside before the downtrend returns.
Bespoke resistance is located at 89.00.
We look to Sell at 89.00 (stop at 89.25)
Our profit targets will be 88.40 and 88.20
Resistance: 88.90 / 89.10 / 89.40
Support: 88.60 / 88.25 / 88.00
Risk Disclaimer
The trade ideas beyond this page are for informational purposes only and do not constitute investment advice or a solicitation to trade. This information is provided by Signal Centre, a third-party unaffiliated with OANDA, and is intended for general circulation only. OANDA does not guarantee the accuracy of this information and assumes no responsibilities for the information provided by the third party. The information does not take into account the specific investment objectives, financial situation, or particular needs of any particular person. You should take into account your specific investment objectives, financial situation, and particular needs before making a commitment to trade, including seeking advice from an independent financial adviser regarding the suitability of the investment, under a separate engagement, as you deem fit.
You accept that you assume all risks in independently viewing the contents and selecting a chosen strategy.
Where the research is distributed in Singapore to a person who is not an Accredited Investor, Expert Investor or an Institutional Investor, Oanda Asia Pacific Pte Ltd (“OAP“) accepts legal responsibility for the contents of the report to such persons only to the extent required by law. Singapore customers should contact OAP at 6579 8289 for matters arising from, or in connection with, the information/research distributed.

EURGBP intraday rallies to continue attract sellers?EURGBP - 24h expiry
The primary trend remains bearish.
Intraday rallies continue to attract sellers and there is no clear indication that this sequence for trading is coming to an end.
There is no clear indication that the downward move is coming to an end.
The bearish engulfing candle on the 4 hour chart is negative for sentiment.
50 1day EMA is at 0.8310.
We look to Sell at 0.8309 (stop at 0.8329)
Our profit targets will be 0.8259 and 0.8249
Resistance: 0.8300 / 0.8315 / 0.8328
Support: 0.8285 / 0.8263 / 0.8250
Risk Disclaimer
The trade ideas beyond this page are for informational purposes only and do not constitute investment advice or a solicitation to trade. This information is provided by Signal Centre, a third-party unaffiliated with OANDA, and is intended for general circulation only. OANDA does not guarantee the accuracy of this information and assumes no responsibilities for the information provided by the third party. The information does not take into account the specific investment objectives, financial situation, or particular needs of any particular person. You should take into account your specific investment objectives, financial situation, and particular needs before making a commitment to trade, including seeking advice from an independent financial adviser regarding the suitability of the investment, under a separate engagement, as you deem fit.
You accept that you assume all risks in independently viewing the contents and selecting a chosen strategy.
Where the research is distributed in Singapore to a person who is not an Accredited Investor, Expert Investor or an Institutional Investor, Oanda Asia Pacific Pte Ltd (“OAP“) accepts legal responsibility for the contents of the report to such persons only to the extent required by law. Singapore customers should contact OAP at 6579 8289 for matters arising from, or in connection with, the information/research distributed.

NZDUSD to find sellers at current resistance?NZDUSD - 24h expiry
Price action looks to be forming a top.
An Evening Star formation has been posted at the high.
This is negative for sentiment and the downtrend has potential to return.
We look for a temporary move higher.
Further downside is expected although we prefer to sell into rallies close to the 0.5657 level.
We look to Sell at 0.5657 (stop at 0.5690)
Our profit targets will be 0.5587 and 0.5520
Resistance: 0.5705 / 0.5775 / 0.5850
Support: 0.5590 / 0.5520 / 0.5320
Risk Disclaimer
The trade ideas beyond this page are for informational purposes only and do not constitute investment advice or a solicitation to trade. This information is provided by Signal Centre, a third-party unaffiliated with OANDA, and is intended for general circulation only. OANDA does not guarantee the accuracy of this information and assumes no responsibilities for the information provided by the third party. The information does not take into account the specific investment objectives, financial situation, or particular needs of any particular person. You should take into account your specific investment objectives, financial situation, and particular needs before making a commitment to trade, including seeking advice from an independent financial adviser regarding the suitability of the investment, under a separate engagement, as you deem fit.
You accept that you assume all risks in independently viewing the contents and selecting a chosen strategy.
Where the research is distributed in Singapore to a person who is not an Accredited Investor, Expert Investor or an Institutional Investor, Oanda Asia Pacific Pte Ltd (“OAP“) accepts legal responsibility for the contents of the report to such persons only to the extent required by law. Singapore customers should contact OAP at 6579 8289 for matters arising from, or in connection with, the information/research distributed.

EURNZD to find resistance at previous support?EURNZD - 24h expiry
Short term bias has turned negative.
We are trading at overbought extremes.
Preferred trade is to sell into rallies.
Risk/Reward would be poor to call a sell from current levels.
50 4hour EMA is at 1.8398.
Previous support at 1.8400 now becomes resistance.
We look to Sell at 1.8389 (stop at 1.8445)
Our profit targets will be 1.8249 and 1.8229
Resistance: 1.8384 / 1.8400 / 1.8450
Support: 1.8320 / 1.8280 / 1.8250
Risk Disclaimer
The trade ideas beyond this page are for informational purposes only and do not constitute investment advice or a solicitation to trade. This information is provided by Signal Centre, a third-party unaffiliated with OANDA, and is intended for general circulation only. OANDA does not guarantee the accuracy of this information and assumes no responsibilities for the information provided by the third party. The information does not take into account the specific investment objectives, financial situation, or particular needs of any particular person. You should take into account your specific investment objectives, financial situation, and particular needs before making a commitment to trade, including seeking advice from an independent financial adviser regarding the suitability of the investment, under a separate engagement, as you deem fit.
You accept that you assume all risks in independently viewing the contents and selecting a chosen strategy.
Where the research is distributed in Singapore to a person who is not an Accredited Investor, Expert Investor or an Institutional Investor, Oanda Asia Pacific Pte Ltd (“OAP“) accepts legal responsibility for the contents of the report to such persons only to the extent required by law. Singapore customers should contact OAP at 6579 8289 for matters arising from, or in connection with, the information/research distributed.

suiusdtlong"🌟 Welcome to Golden Candle! 🌟
We're a team of 📈 passionate traders 📉 who love sharing our 🔍 technical analysis insights 🔎 with the TradingView community. 🌎
Our goal is to provide 💡 valuable perspectives 💡 on market trends and patterns, but 🚫 please note that our analyses are not intended as buy or sell recommendations. 🚫
Instead, they reflect our own 💭 personal attitudes and thoughts. 💭
Follow along and 📚 learn 📚 from our analyses! 📊💡"

suiusdt long"🌟 Welcome to Golden Candle! 🌟
We're a team of 📈 passionate traders 📉 who love sharing our 🔍 technical analysis insights 🔎 with the TradingView community. 🌎
Our goal is to provide 💡 valuable perspectives 💡 on market trends and patterns, but 🚫 please note that our analyses are not intended as buy or sell recommendations. 🚫
Instead, they reflect our own 💭 personal attitudes and thoughts. 💭
Follow along and 📚 learn 📚 from our analyses! 📊💡"

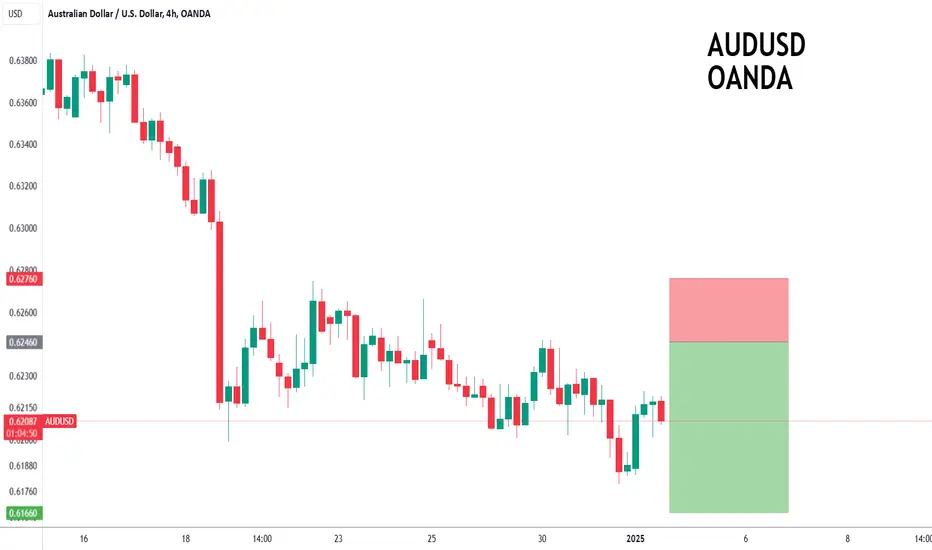
AUDUSD to continue in the downward move?AUDUSD - 24h expiry
Broken out of the channel formation to the downside.
Trades at the lowest level in 26-months.
Buying posted in Asia.
Bespoke resistance is located at 0.6246.
The previous swing high is located at 0.6246.
We look to Sell at 0.6246 (stop at 0.6276)
Our profit targets will be 0.6166 and 0.6146
Resistance: 0.6246 / 0.6271 / 0.6275
Support: 0.6179 / 0.6150 / 0.6130
Risk Disclaimer
The trade ideas beyond this page are for informational purposes only and do not constitute investment advice or a solicitation to trade. This information is provided by Signal Centre, a third-party unaffiliated with OANDA, and is intended for general circulation only. OANDA does not guarantee the accuracy of this information and assumes no responsibilities for the information provided by the third party. The information does not take into account the specific investment objectives, financial situation, or particular needs of any particular person. You should take into account your specific investment objectives, financial situation, and particular needs before making a commitment to trade, including seeking advice from an independent financial adviser regarding the suitability of the investment, under a separate engagement, as you deem fit.
You accept that you assume all risks in independently viewing the contents and selecting a chosen strategy.
Where the research is distributed in Singapore to a person who is not an Accredited Investor, Expert Investor or an Institutional Investor, Oanda Asia Pacific Pte Ltd (“OAP“) accepts legal responsibility for the contents of the report to such persons only to the extent required by law. Singapore customers should contact OAP at 6579 8289 for matters arising from, or in connection with, the information/research distributed.
#SWINGTRADE SETUP - JIO FIN SERVICES NSE:JIOFIN
❇️ Strong volume breakout on daily chart.
❇️ Flag and poll pattern in bigger time frame (1day, weekly,monthly).
❇️ Stock can achive 320 to 350 target range in upcoming days/weeks.
❇️ Short and log terms targets 340+ (10%).
❇️ Nearby support(sl) 295.
❇️ Above 310 we can see a real move🔥
👉🏻 thetradeforecast
Only for educational purposes.
This content is not a recommendation to buy and sell.
Not SEBI REGISTRAR.

USDCHF to continue in the upward move?USDCHF - 24h expiry
Intraday dips continue to attract buyers and there is no clear indication that this sequence for trading is coming to an end.
Our short term bias remains positive.
There is no clear indication that the upward move is coming to an end.
Offers ample risk/reward to buy at the market.
20 4hour EMA is at 0.9000.
We look to Buy at 0.9001 (stop at 0.8971)
Our profit targets will be 0.9081 and 0.9091
Resistance: 0.9027 / 0.9040 / 0.9060
Support: 0.9000 / 0.8981 / 0.8960
Risk Disclaimer
The trade ideas beyond this page are for informational purposes only and do not constitute investment advice or a solicitation to trade. This information is provided by Signal Centre, a third-party unaffiliated with OANDA, and is intended for general circulation only. OANDA does not guarantee the accuracy of this information and assumes no responsibilities for the information provided by the third party. The information does not take into account the specific investment objectives, financial situation, or particular needs of any particular person. You should take into account your specific investment objectives, financial situation, and particular needs before making a commitment to trade, including seeking advice from an independent financial adviser regarding the suitability of the investment, under a separate engagement, as you deem fit.
You accept that you assume all risks in independently viewing the contents and selecting a chosen strategy.
Where the research is distributed in Singapore to a person who is not an Accredited Investor, Expert Investor or an Institutional Investor, Oanda Asia Pacific Pte Ltd (“OAP“) accepts legal responsibility for the contents of the report to such persons only to the extent required by law. Singapore customers should contact OAP at 6579 8289 for matters arising from, or in connection with, the information/research distributed.

Bullish pattern on NVDAThe stocks is placing a bullish pattern
Descending broadening wedge
CASE 1: formation of a descending broadening wedge after a trough
This type of pattern appears on the troughs, it is a bullish reversal pattern.
The break in the resistance line definitively validates the pattern.
The price objective is determined by the highest point at which the descending broadening wedge was formed.
NB: often, the steeper the descending broadening wedge’s trend lines, the faster the price objective is reached.
Statistics of the descending broadening wedge after a bullish movement
In 80% of cases, the exit is bullish.
In 75% of cases, a descending broadening wedge is a reversal pattern.
In 60% of cases, a descending broadening wedge’s price objective is achieved when the resistance line is broken.
In 21% of cases, the price makes a pullback in support on the descending broadening wedge’s resistance line.

GBPAUD Bullish Trade Idea from 2.00381-2.0082GBPAUD Bullish Trade Idea
The price fell from the 2.02834 zone and hit back the 2.00381 zone, just respecting the recent support level.
Now the important question is: does the price just test back and wait for the confirmation candle over this zone to reach the next level?
In H4, the bear pressure will increase over time, and the volume increased with sentiments also showing that more volume on the buy side. and the major zone will be tested.
Key level: if the market breaks the support, then we must see at the 1.99567 zone, but on the other side, the Pound index is strong enough.
When the market breaks the 2.00820 level, put buy trade.
Buying zone: 2.00381 - 2.0082
Stop loss: 1.99778
Take Profit Level: 2.0158-2.02763
