#014: USD/SGD SHORT Investment Opportunity
In recent days, an extremely interesting window has opened on the USD/SGD exchange rate, a pair often overlooked by retail traders but highly sensitive to Asian institutional flows. I decided to open a short position, betting on a decline in the US dollar against the Singapore dollar, for a series of structural, real, and measurable reasons.
The US dollar has begun to show clear signs of weakness. Recent macroeconomic data releases have been below expectations, particularly those related to inflation and consumption. At the same time, market expectations regarding interest rates are shifting in the opposite direction from a few months ago: the probability of a rate cut by the Fed by the end of the year is growing. Added to this is a visible decline in open interest on dollar-linked futures contracts, a clear sign that many institutional long positions are being closed. The market simply no longer believes in a strong dollar.
While the US dollar is losing momentum, the Singapore dollar is quietly but solidly strengthening. The Monetary Authority of Singapore has maintained an extremely prudent and conservative monetary policy, and capital flows into Asian markets continue to grow. The Singapore dollar has historically been seen as a regional safe-haven currency, and in an environment where the US dollar is weakening, it becomes an ideal candidate to accommodate new relative strength.
One of the most significant factors in this decision, however, is retail sentiment. Currently, over 80% of retail traders are long USD/SGD. This imbalance is striking. Typically, when the vast majority of non-professional traders are aligned on one side, the market ends up moving in the opposite direction. Institutions, on the other hand, patiently build short positions, taking advantage of excessive retail euphoria. Conventional sentiment is often the best counter-indicator.
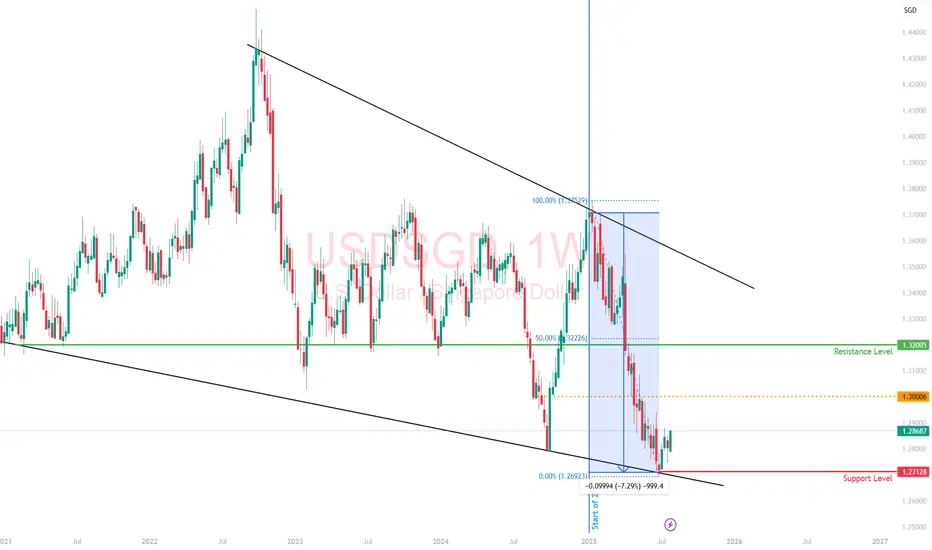
Chart and volume analysis perfectly confirm this scenario. In recent candles, we have seen an anomalous spike above resistance, followed by a sharp rejection. This is classic behavior: institutions push the price above a key zone, trigger long retail traders' stops, raise liquidity, and then let the price fall. No news, no macro trigger: just pure manipulation. The structure now has all the characteristics to unload downwards.
The chosen take profit level is not random. It is positioned in an area historically defended by institutions, specifically between 1.27680 and 1.27720. In that range, there are volume gaps, representing the classic unloading zones where banks close positions. Furthermore, FX options show a high concentration of put strikes in that same zone, confirming that options desks are also working to defend a bearish move.
All these elements combined—macroeconomic, behavioral, volumetric, and positioning—lead to a single logical conclusion: shorting USD/SGD at this precise moment is a rational, concrete trade, and consistent with institutional flows. No gambles. No forcing. Just chance, balance and timing.
Sgd

Singapore Dollar: Asia’s Quiet Safe Haven with Eyes on ParityThe Singapore dollar has quietly emerged as one of the strongest performers in Asia, gaining over 7% against the US dollar this year.
While much of the FX world fixates on the yen or franc in times of uncertainty, the SGD is carving out a niche as a regional safe-haven, driven not by size or liquidity, but by credibility.
The strength in the SGD isn’t just about USD weakness. Singapore's macro fundamentals
budget surpluses,
robust reserves, and
deep-rooted investor confidence
offer a kind of quiet strength that traders tend to overlook until it becomes obvious.
This makes the SGD a compelling hedge against both regional turmoil and global dollar decay.
As more global capital looks for stable homes outside of the traditional, Singapore’s financial system and currency are set to benefit.
The idea of SGD hitting parity with the USD, once dismissed as unrealistic, is now getting serious attention.
Analysts have suggested that it could happen within five years, but I wouldn’t be surprised if it comes sooner!
The greenback’s structural issues of twin deficits, political gridlock, and de-dollarization headwinds are no longer theoretical.
That said, liquidity is still a constraint. The SGD makes up just 2% of global FX turnover, and the MAS actively manages the currency to avoid excessive volatility.
This means that while the long-term trend favors SGD appreciation, traders betting on a rapid sprint to parity may be left waiting.
In my view, the SGD is one of the most underappreciated macro trades in FX.
LONG EUR/SGD Investment Opportunity
Entry: 1.46708 Take Profit (TP): +1.33% Stop Loss (SL): -0.86%
📊 Market Overview
EUR/SGD is in a strategic zone, with an entry level set at 1.46708, an area that could act as a key support. The idea of this LONG trade is based on a possible resumption of the trend, taking advantage of a bullish movement in case of confirmation of the momentum.
🔍 Technical Analysis
Key Support: The price has tested the entry level several times, suggesting a potential base for a restart.
Resistance: The TP target implies a movement of +1.33%, indicating a possible breakout to new highs.
Stop Loss: The protection set at -0.86% helps manage the risk and minimize any losses.
📈 Risk Management
Capital management is crucial. With a Stop Loss of 0.86%, the risk is well calibrated against the potential gain of 1.33%, maintaining a positive risk/reward ratio.
🔥 Conclusion
If the price confirms the support and shows signs of strength, this LONG strategy on EUR/SGD could generate a favorable opportunity. However, it is always essential to monitor the market conditions and adjust the strategy if necessary.

SGDCHFI previously posted an idea a few weeks ago or so about this same sentiment that is bullish. Still holding the previous trade although price has clearly shot down more since that entry. Yesterday's bear volume decreased after spiking the most it has in a long time. We might still have time to recover the previous trade and for price to reverse from its current short term move down.
Where the "sick throw up" emoji is, im looking for this same type of price movement. May have to wait through some consolidation before retracing to one the daily target ranges on this chart.

SGDCHFLooking for price to continue towards the upside from this support zone on top of the recent thrush to the downside. If we can pick up some momentum, price could possibly reach 0.64628 or higher.

$CADSGDAnother trade opportunity presented itself today. I'm going to link this to my previous published chart. The description is the same. Just found another entry candle per my strategy. Looking for price to retrace towards the target zone located on this chart.

$NZDSGDAt the current price level, price seems to have broke a nearby support/ consolidation zone and is now near the next lowest support zone. Looking for price to retrace towards the targets listed on the chart.

$CADSGDAt the current price level, price is near a support level. Price could also be in a range zone. Looking for price to retrace towards the targets listed on the chart.

FOREX: NZDSGD Short made on 4/12/2024. 0 risk holding 1) This is a trade I am holding right now. The entry point is 0.78965. The stop loss was placed on
0.79191.
2) The current risk and reward ratio is 3 and we are still holding it.
3) We have execute of tracking take profit currently as it meets our requirement.
4) We are targeting 0.77834. It is my take profit.
Feel free to ask me anything:)

USD/SGD Price Action: A Bearish Outlook EmergesYesterday, the USD/SGD currency pair rebounded at a supply zone around 1.34500, creating a bearish candle that has persisted into today. As I write this, the price is currently around 1.34195.
Analyzing the technical landscape, the latest Commitment of Traders (COT) report reveals that retail traders remain in long positions, while other market participants have adopted a more neutral stance without clear positioning. This scenario could allow the Singapore Dollar to capitalize on a potential retracement of the US Dollar, potentially enhancing its value.
Looking at historical trends, our forecasting data indicates that over the past decade, this period of the year has frequently seen bearish retracements for the USD against the Singapore Dollar. Given the prevailing market conditions, traders may want to consider positioning themselves for short opportunities.
As the market evolves, it is crucial to monitor price movements and broader economic trends closely to make well-informed trading decisions.
✅ Please share your thoughts about USD/SGD in the comments section below and HIT LIKE if you appreciate my analysis. Don't forget to FOLLOW ME; you will help us a lot with this small contribution.

NZD/SGD Tests and Rejects Key Demand Area, Bullish Sentiment.Over the past three days, the NZD/SGD pair has retested a previous demand area and shown a clear rejection, signaling potential buying interest at this level. The Commitment of Traders (COT) report adds weight to this scenario, revealing that retail traders remain predominantly short, while "Smart Money"—institutional investors—are beginning to edge higher in their positioning.
Large speculators have already turned bullish, reflecting a growing confidence in the New Zealand Dollar (NZD) relative to the Singapore Dollar (SGD). This shift in sentiment could set the stage for a possible long setup, particularly as seasonal trends suggest further upside potential for NZD/SGD.
From a technical perspective, the rejection of the demand zone, combined with the bullish shift in institutional positioning, points to a potential upward move. Traders will be closely monitoring price action in the coming days for confirmation of a breakout, which could present an opportunity to enter long positions in alignment with the emerging bullish sentiment.
✅ Please share your thoughts about NZD/SGD in the comments section below and HIT LIKE if you appreciate my analysis. Don't forget to FOLLOW ME; you will help us a lot with this small contribution.

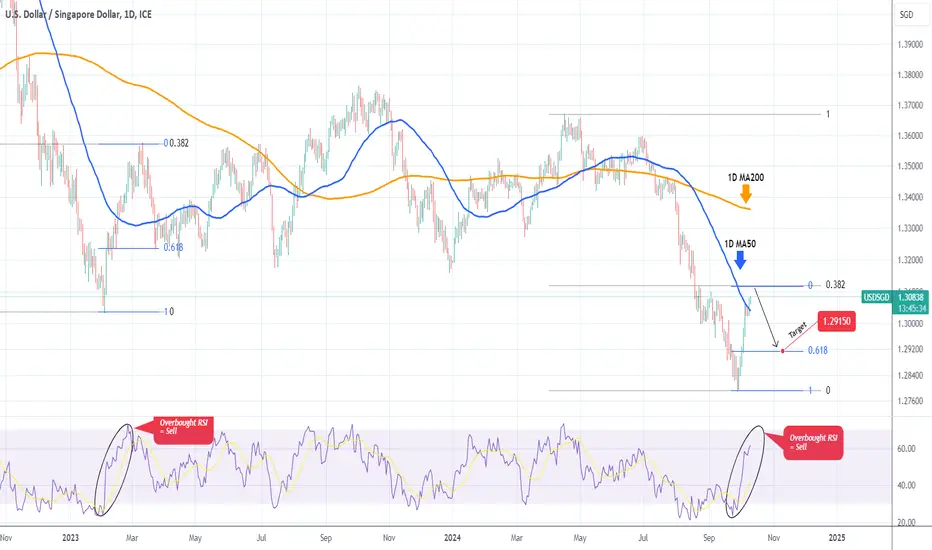
USDSGD Time to sell this rally.The USDSGD pair has been rebounding non-stop since the September 27 bottom and yesterday broke above its 1D MA50 (blue trend-line) for the first time in more than 3 months (since July 04). This confirmed that the correction since July is over but with the 1D RSI above 60.00 and heading towards the overbought barrier (70.00), we expect a rejection there.
In fact, there was a similar fractal that was rejected on March 10 2023, on the correction's 0.382 Fibonacci retracement level a little after the 1D RSI turned overbought. This resulted into a test of the 0.618 Fib of the rebound Leg.
As a result, we are expecting a rejection on the 0.382 Fib or when the 1D RSI gets overbought above 70.00 and our Target is the 0.618 Fib at 1.29150.
-------------------------------------------------------------------------------
** Please LIKE 👍, FOLLOW ✅, SHARE 🙌 and COMMENT ✍ if you enjoy this idea! Also share your ideas and charts in the comments section below! This is best way to keep it relevant, support us, keep the content here free and allow the idea to reach as many people as possible. **
-------------------------------------------------------------------------------
💸💸💸💸💸💸
👇 👇 👇 👇 👇 👇
USDSGD Buy signal at the bottom of a Channel Down.The USDSGD pair has been trading within a Channel Down pattern since the April 16 2024 High and today almost touched its bottom (Lower Lows trend-line). That is a technical short-term buy opportunity towards its top (Lower Highs trend-line).
The previous Bullish Leg of the pattern registered a +1.31% rise. Our Target is slightly lower than a new potential rise of this magnitude at 1.35000.
-------------------------------------------------------------------------------
** Please LIKE 👍, FOLLOW ✅, SHARE 🙌 and COMMENT ✍ if you enjoy this idea! Also share your ideas and charts in the comments section below! This is best way to keep it relevant, support us, keep the content here free and allow the idea to reach as many people as possible. **
-------------------------------------------------------------------------------
💸💸💸💸💸💸
👇 👇 👇 👇 👇 👇

Trade Like A Sniper - Episode 49 - GBPSGD - (18th June 2024)This video is part of a video series where I backtest a specific asset using the TradingView Replay function, and perform a top-down analysis using ICT's Concepts in order to frame ONE high-probability setup. I choose a random point of time to replay, and begin to work my way down the timeframes. Trading like a sniper is not about entries with no drawdown. It is about careful planning, discipline, and taking your shot at the right time in the best of conditions.
A couple of things to note:
- I cannot see news events.
- I cannot change timeframes without affecting my bias due to higher-timeframe candles revealing its entire range.
- I cannot go to a very low timeframe due to the limit in amount of replayed candlesticks
In this session I will be analyzing GBPSGD, starting from the 3-Month chart.
If you want to learn more, check out my profile.

USDSGD Bullish unless this Support breaks.The USDSGD pair is on the 1D MA50 (blue trend-line) currently but within conflicting Channels. The long-term one is a Channel Up that hasn't yet been invalidated, the medium term one a Channel Down and the shortest term a Channel Up.
As long as Support 1 (1.34225) holds, we will go with the short-term Channel Up and stay bullish, targeting 1.37250, which will be a Lower High on the medium-term Channel Down. If on the other hand, Support 1 breaks, we will take the loss and go short instead, targeting 1.32725 (Support 2).
-------------------------------------------------------------------------------
** Please LIKE 👍, FOLLOW ✅, SHARE 🙌 and COMMENT ✍ if you enjoy this idea! Also share your ideas and charts in the comments section below! This is best way to keep it relevant, support us, keep the content here free and allow the idea to reach as many people as possible. **
-------------------------------------------------------------------------------
💸💸💸💸💸💸
👇 👇 👇 👇 👇 👇

Trade Like A Sniper - Episode 11 - SGDJPY - (1st June 2024)This video is part of a video series where I backtest a specific asset using the TradingView Replay function, and perform a top-down analysis in order to frame ONE high-probability setup. I choose a random point of time to replay, and begin to work my way down the timeframes. Trading like a sniper is not about entries with no drawdown. It is about careful planning, discipline, and taking your shot at the right time in the best of conditions.
A couple of things to note:
- I cannot see news events.
- I cannot change timeframes without affecting my bias due to higher-timeframe candles revealing its entire range.
- I cannot go to a very low timeframe due to the limit in amount of replayed candlesticks
In this session I will be analyzing SGDJPY, starting from the 6-Month chart.
- R2F

USDSGD Still a buy but not for long.The USDSGD pair has been trading within a Channel Up pattern (blue) since the February 02 2023 Low but on December 28 2023 it posted a Lower Low, so we have to consider the possibility of an emerging (dotted) Channel Down.
As a result, the trend remains bullish but technically we should be careful and only target the top of Channel Down at 1.37350 (symmetrical Bullish Leg at +4.49%).
-------------------------------------------------------------------------------
** Please LIKE 👍, FOLLOW ✅, SHARE 🙌 and COMMENT ✍ if you enjoy this idea! Also share your ideas and charts in the comments section below! This is best way to keep it relevant, support us, keep the content here free and allow the idea to reach as many people as possible. **
-------------------------------------------------------------------------------
💸💸💸💸💸💸
👇 👇 👇 👇 👇 👇

EURCAD - Choppy Lows AheadEURCAD finds a choppy trading condition set ahead for a while, One of the least popular FX pairs - for good reason.
This correlation toward the USD/SGD and EUR/USD finds another confirmation off my initial two part EURUSD Theory posted earlier.
Links Below

USDSGD Strong bullish signal above the 1D MA200It's been again a long time since we traded the USDSGD pair (October 03 2023, see chart below) but it did manage to give us a low risk sell opportunity:
The price hit today the 1D MA200 (orange trend-line) for the first time in exactly 2 months (since November 17). That is a major pressure level as it is also exactly where Resistance 1 (1.34550) is. The long-term pattern is a Channel Up and technically this is the 3rd Bullish Leg. The previous two rose by more than +4.00% but the 2nd made a temporary pause at +3.44%.
That is our 1D MA200 break-out target and it interestingly falls almost exactly on Resistance 2. We are targeting 1.36100 but if the 1D MACD forms a Bearish Cross earlier, we will the the profit on that market price.
-------------------------------------------------------------------------------
** Please LIKE 👍, FOLLOW ✅, SHARE 🙌 and COMMENT ✍ if you enjoy this idea! Also share your ideas and charts in the comments section below! This is best way to keep it relevant, support us, keep the content here free and allow the idea to reach as many people as possible. **
-------------------------------------------------------------------------------
💸💸💸💸💸💸
👇 👇 👇 👇 👇 👇

Usdsgd still bearish bias Hello fellow traders , my regular and new friends!
Welcome and thanks for dropping by my post.
Last week, i mentioned about USDSGD having to make more downwards movement (in my tradingview stream), this coming week i believe it would be the same considering the break of the support and currently just tested and seems rejecting it.
Let's see how it unfolds next week.
Do Like and Boost if you have learnt something and enjoyed the content, thank you!
-- Get the right tools and an experienced Guide, you WILL navigate your way out of this "Dangerous Jungle"! --
*********************************************************************
Disclaimers:
The analysis shared through this channel are purely for educational and entertainment purposes only. They are by no means professional advice for individual/s to enter trades for investment or trading purposes.
*********************************************************************

USDSGD: Breakout supported by the 4H MA50.USDSGD is trading inside a Channel Up pattern on the 4H timeframe, on a bullish technical outlook both on the 4H and 1D charts (RSI = 57.738, MACD = 0.002, ADX = 20.427). Yesterday it crossed over the LH trendline and has up to now stayed supported on the 4H MA50. The 4H MACD Bullish Cross has originated this breakout and it appears that it is fairly symmetric with the one in September. Both around the 0.5 Fibonacci level. As such, we turn bullish and target Fibonacci 1.236 (TP = 1.3800).
## If you like our free content follow our profile to get more daily ideas. ##
## Comments and likes are greatly appreciated. ##

USDSGD Channel Up trading strategyWe haven't looked into the USDSGD pair in a long time (May 16), with the last idea giving a great bullish break-out signal:
The pair has since entered a Channel Up pattern, with the latest bullish leg since July 14, just reaching the top (Higher Lows trend-line) of the pattern. This is also the 0.5 Fibonacci retracement level from the 2022 High. As long as the price trades under it, we will be short, targeting the 1D MA50 (blue trend-line) at 1.36250. If the 0.5 Fib breaks, we will close the sell and go long instead, targeting 1.38600 (Resistance 1).
-------------------------------------------------------------------------------
** Please LIKE 👍, FOLLOW ✅, SHARE 🙌 and COMMENT ✍ if you enjoy this idea! Also share your ideas and charts in the comments section below! **
-------------------------------------------------------------------------------
💸💸💸💸💸💸
👇 👇 👇 👇 👇 👇

Long USDSGDIt appears that USDSGD may be setting up for a multi-day bull run.
Last week USDSGD posted a green weekly Heiken Ashi candle and I suspect it may do it again.
It is also the case that USDSGD posted a green daily Heiken Ashi candle after multiple red Heiken Ashi candles on the daily.
This signals to me that we may be in for a bull run this week.
