SGDCHF Bullish with trade callSGD_CHF shows a *Uptrend*.
📊 Current Price: 0.6554
🎯 Entry Prices:
Entry Price 1: 0.6536
Entry Price 2: 0.6522
Entry Price 3: 0.6508
Entry Price 4: 0.6488
🛑 Exit Prices:
Exit Price 5: 0.6772
Exit Price 6: 0.6891
Exit Price 7: 0.7009
Exit Price 8: 0.7083
⛔ Stop Loss: 0.6453
We can Clearly see we've had a nice down trend where had a double bottom and have been going back high ever since. We've broken through the bottom fib channel which is a good sign for more continuation back upward. We also have been having recognizable positive volume along with a Golden Cross on the Daily Very imminent The MACD is Showing Bullish and the ADX is 24 showing some Trend Strength.
SGDCHF
SGDCHF $SGDCHF Short ScalpThis is a pure digital signal processing signal just as are every other signal I post. ZERO other factors are considered in producing this signal.
Entry reasons: SGDCHF is showing momentum and confluence of mean reversion crossing up the 70 day price mean.
Exits and SL: TP and SL on chart. Move SL on TP. After TP2, trail with 0.5xATR step and 1.5xATR offset.
Two Long Entries for CHF Pairs: CAD and SGDCurrently, watching these two pair correlations on Forex, I think both of them are due for a similar type of positive wedge correlation given there entry price. I am long looking at the patterns right now. Right now I think the setup is quite intriguing. That being said, everything I say is on an opinion based basis. Invest at your own risk. Please proceed with caution and do your own due diligence.
SGDCHF technicaly based forecast
📌Short intro:
I am full time trader - analyst * High accuracy of ideas * Technicaly and Fudnamentaly side in analysis * Comment if have any questions or want to send support * Price action - FIBO - Candl pattern * FX - STOCK - CRYPTO * Simple ideas
💡 SGDCHF technicaly based idea, technicaly indicators showing we can exepct higher recovery phase in next periods, expecting to see push in ptice till FIBO 0.5 which is in some cases strong support, same on FIBO 0.5 is last support zone (yellow line).
📌Have on mind, trading involves risk, check idea on your own tactic, if have questions pls comment!
Thanks on supporting!
All best, good luck!
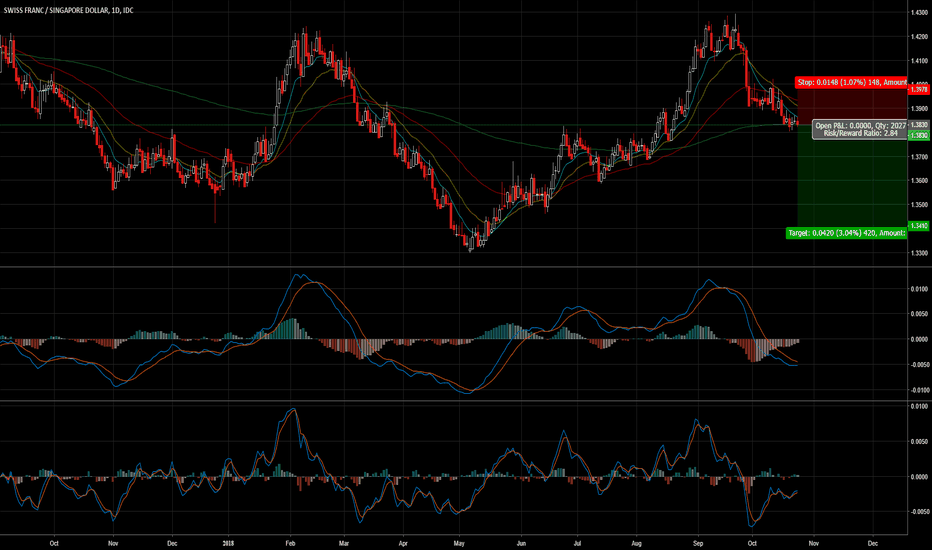
SGD/CHF - Long Term ShortSGD/CHF is not holding strong and broke under the 50 EMA on the daily timeframe.
MACD daily has also crossed the zero line and we have convergence down.
AS the pair goes down, we will see how strong the bearish move is and wheter we can keep holding to the next TPs.
First TP: 0.7153
Second TP: 0.7105
Third TP: 0.7055
You must leave enough space for your SL. That is, put it above the daily 50 EMA, or simply, above the last daily candle close with a little bit of space to it.
Trade safe.
CHF/SGD - 250 Pips + Opportunity LONG TERMCHF/SGD is weak and we can expect it to continue it's bearish trend further below on the long term this next few weeks *as long as the 50 EMA holds as resistance on the daily timeframe.
It may make some pullbacks up but it is nothing to worry about as long as it never finds support. The reasonw why I leave my SL higher than the 50 EMA just in case.
This is a long term trade and the TP target may get changed during the run as the pair makes its move and let's us know how it's doing.
The full range and duration of the trade could be up to 2 months.
I personally have risked 3% on this pair.
Remember, you're not in trading for the quick profits but for the long term gains.
Trade safe.
SGDCHF Rising Wedge TL BounceBefore I begin I would like to thank anyone who provides feedback.
Observing the D and 4h timeframes of SGD/CHF, there is a rising wedge taking place and we are currently testing the lower TL. The price also just tested the .618 fib level (.7150).
We just broke a key price area of .718 and this can act as a resistance point . If this hits resistance and the wedge is broken, then a very nice short opportunity will form.
The next area of significant resistance past the price of .718 is the .382 fib (.7225) that has played a reversal area in the past weeks. We can see a retracement back to .718 that will act as support.
The first TP area is where a lower high would form that is right on the .236 fib (.7271)
The second TP area is the top of the rising wedge TL (.7320).
I have placed the stop below the .786 fib (.7097) as this will invalidate the continuation of the wedge.
Thank you, feedback welcomed!


