SGX NIFTY AT CRUCIAL SUPPORT[SGX NIFTY SUPPORT AT 17280/300 If Sustain below these levels for 1 hour then huge Gap Down possible on monday in nifty. Else, will bounce back.
Sgxnifty

SGX NIFTY to touch 17000price action in SGX nifty shows, C4 retracement to 17000 /17090 level before thursday(17/03/22)
it has 3 confluence of resistances @17090,
1st wave bottom, 55 trendline (expanded triangle),and c4 expanded flat wave target
hope this will be the highest point of this month

Nifty 50 - Possible PathOpening around Purple line, breach will lead to approach to 17000 (red line) which will be critical support for further selling to 16800 and possible even lower.
On the upside, squeeze will cause cover to cover above 17350-360 range

SGX Nifty │ 14-02-2022SGX NIFTY 50 INDEX FUTURES
Date:- 14-02-2022
Bullish :- Buy Trade
Nifty-50 Movement :- ( 182 ~ ) Point ( Positive Closing ) Sideways Closing
TIME CONSTANT LEVELS ATTENDANCE ( T.C.A ) :- 17294 ~ 17279
TOP HIGH :- 17378
STOP-LOSS :- Uses Your Own Stop-Loss
Quantum Physics Researcher :- Jeevan Singh
T.C.A Created Using With HPC ( High performance Computing )
Guys This is R&D ( Research And Development ) Purpose Only.
I am Not Responsible If your Stop-Loss Hit And! I am Also Not Responsible If Regulator Call Me Manipulator.
Thank You For Making Trust And Don't Forget To Support Me!

Head & soulder pattern in niftytraders should observe the pattern formation , LH,Head formation completed
wait for Right shoulder formation , aggressive traders can short @18000 levels(RS)
conservative traders can open short position after the neckline break, target given around 16900

Price action strategy-SHORT SGX NIFTYA simple price action strategy explained for SGX NIFTY
Same can be applied to indian NIFTY too.
Explanations; Origine of engulfing (peak) formed at 18621
First drop from peak completed with climax (5waves) indicating SHORT TERM REVERSAL .
Now ,recovery to resistance Level (minor SR) is nearing to complete at 18123.
What next? Selling will resume and drop in price till it reaches the base, in Drop ,Base,Drop (3waves) form as i mentioned.
please note that this is my view based on PURE PRICE ACTION theory

Nifty opening based on SGX OpeningAs long as SGX is not closing above 18030-18000, better not to look for long trades.
If the SGX opens above 18000 on 10 Jan 2022, Nifty can see the same levels.


Live update Monday Nifty &Banknifty TargetsLive prediction on nifty & banknifty analysis.
must watch

MCX Crude oil LongMarket hold the price point .than market pull back to top zone
Long for Buy Indicate and Hold for you T on your mind
My opinion is Long on this price point and Your's

SGX NIFTY CORRECTIONSGX NIFTY which is traded based on our indian NIFTY, will give you an ADVANCED movements before our market opens.
This will give traders an edge to take or quit positions ,sometimes loss of sleep also!
Elliot waves should be drawn as per cash markets(as per Glen neely) But there is nothing wrong since this future is the mainly traded by matured participants unlike our retailers.
Having said we can follow our nifty using SGXNIFTY(IND50)Charts.
Bears won today by bringing nifty to 458 points from its peak(17809), wait for 2 days to allow the injured Bull to recover and again BEARS will demonstrate full power after wednesday(22/09).

SGX Nifty on way to New Highs?View on SGX Nifty for 15-09-2021.
As per the Chart Currently Sgx Nifty is trading in Sideway Trend but it break and close above the Resistance Line which is 17450 then we might see the upside of 100 to 125 points i.e. 17550-17575.
On Other Side of coin there is Strong Support of 17350 if it break then it may go to test Horizontal Support Line which is coming at 17280.
Which you a Very Profitable Day.

SGX NIFTY : Nifty Prediction TodaySGX Nifty gives FPIs an advance chance to take positions before Indian market opens up.
Contrary to popular belief, it is very much liquid and since SGX sessions last more than Indian market, it is darling of FPIs.
On one hour candle, SGX Nifty can be seen drifting towards Support and if this is breached decisively, we might see a bigger move.
On the upside, the resistance is seen at 16357 level and as and when it is breached, a further push might come to take it to greater heights.
If neither of these 2 scenarios happen, it will be dancing between 02 lines and eating premium of option buyers. In that case, Option Sellers might sell options out of this range.
Happy Trading.

ASHOKLEY - short AUGUST FUTURES below 124short below 124 close (15 mins candle close)
Target 1 - 121.25
Target 2 - 117.20
Stop loss - 132

SGX nifty SGX nifty making a down trend. in few weeks we can see 14200-14600. This is only for education not any long or short recommendation.

SGX NIFTYThis is only for educational purposes. It's not any buy recommendation or any sell recommendation.


NIFTY GROUND BELOW 13800 BOMB READY SGX NIFTY INDIA50NIFTY GROUND BELOW 13800 BOMB READY SGX NIFTY INDIA50

SGX Nifty at crucial levelSGX nifty had formed Fakey inside bar candle all details specified on chart.
Now safe to wait and watch for the price action level

NIFTY STRONG DIVERGENCE QUICK REVERSAL EXPECTED POST 1 MORE HIGHNIFTY STRONG DIVERGENCE QUICK REVERSAL EXPECTED POST ONE MORE HIGH - TAKE CARE

my long term nifty view a Trg 1 of 14100-14000 then final move nifty futures trg please note it its a long term view can keep sl of 14480

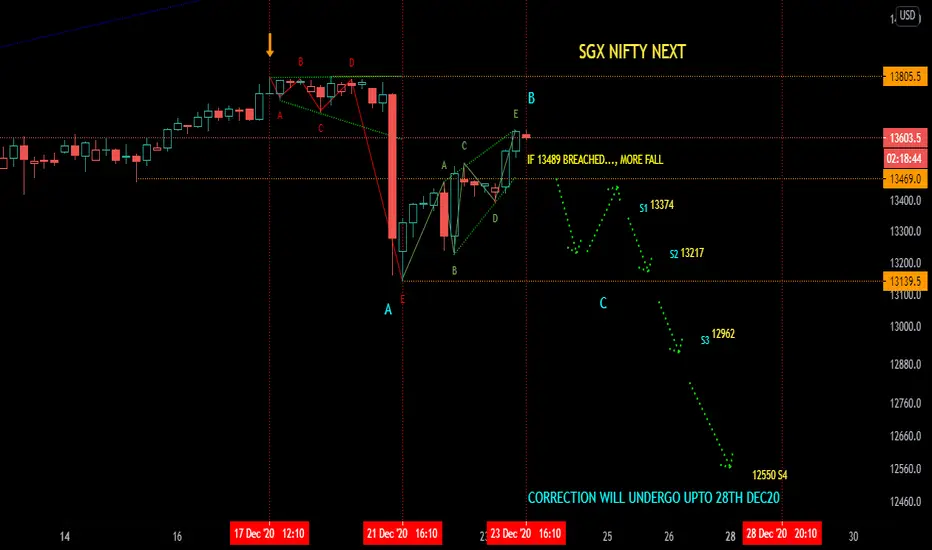
SGX NIFTY NEXT MOVEI already mentioned the WAVE count in SGX NIFTY is very easy to predict, since it respects all rules of ELLIOT wave principle.
wave A and B completed in equal time ,now its time for WAVE''C''. You can use the levels for indian NIFTY too(approx),and trending directionfor appropriate PUT OPTIONS