SPANISH SHARES BANCO POPULARAfter a good impulse, a flag contracting pattern is being formed.
I am expecting this to trully rise, the reward on this type of shares is insane, as they are less than 1 unit, you can buy a lot of units and every cent it moves, gives you an insane reward.
There is two possibilities, buy in the E or buy the break out. I will personally probably buy the E as I am a risky guy and I want to make the most of this.
By the way I already have a long term position on this with 2k shares at 0.96. expeting to rise to 1.3 to make at least 700 bucks.
Have a great week.
Shares


Will 21st Century Fox make a bid for Sky PLC?The share price of Sky PLC spiked as much as 30% earlier today as news broke out about a potential takeover from 21st Century Fox. Fox already holds 39% of Sky PLCs shares and a preliminary deal has now been reached for Fox to purchase the remaining stake at £10.75 per share. Sky currently operates in five different countries within the EU and with the current weakness of the pound, UK companies are attractive for foreign companies. If this deal successfully goes through, it will greatly increase Fox’s market share of the Global Television industry. Rupert Murdoch, executing co-chairman of 21st Century Fox has made it clear previously that he would like to own all of Sky. Fox have until 6th January 2017 to make their intentions clear or walk away for six months due to the UK Takeover rules. From the chart, we can see that Sky PLCs share price shot up towards the trendline before retracing to close just below it. Over the next month, we would expect to see some retracement until Fox make their intentions clear or make a formal offer. If no deal is made or the shareholders of Sky reject the proposed offer, the share price of Sky would be expected to fall back towards £7.90. If a deal is successful, price could head in excess of £12.00 depending on Fox’s plans with Sky PLC.

Gap Close before Christmas??!!Will ebay close the gap from october 2016?? In my opinion it will. The question is when. :)
This is just an idea after going trough lots of US stock charts.
IDEA NOT ADVICE! :)


Shire (Pre Election) Pharmaceuticals shares have been hit hard since Clinton's public disapproval of Pharmaceuticals Co.'s prices and profits. Pharmaceuticals shares in general have declined across the board. which is evident in the H1 chart of Shire.
R4 5155.88
R3 4985.27
R2 downward trendline
R1 4634.31
Current 4580.50
S1 4317.47
If Clinton wins I believe we will enter a new lower distribution.

HSBC (HSBA LN) earnings MondayThe banking sector has been hit by Trumps latest resurgence in the polls, but the UK banks received a slight boost after a UK court ruled that MP's will have a say on when and how article 50 will be invoked, increasing hopes of a soft Brexit.
The weekly chart has printed a bearish candle signal but on the daily chart prices look overstretched. on the D1 chart the RSI indicator is making lower lows while price is making higher lows (Divergence). Currently is right in the middle of value which indicates if earnings come out of line we could see a move into a new distribution.
The weekly downtrendline has been broken but since price has moved back in but on lower volume. On the lower timeframes we are in a uptrend, but the recent retracement looks strong but overdone.
R3 660.00
R2 Weekly downtrend line
R1 Daily downtrend line
Current 592.80
S1 590.20
S2 558.00
S3 541.86
S4 489.52

Shell (RDSA LN)This Co. has has a interesting time in recent months, the will they wont they OPEC saga has made energy based shares volatile. The most recent rhetoric from today has been from Saudi Arabia who stated that they considered scrapping output cuts if Iran refuse to join in. Last week API and DOE crude oil inventories reported a large build which doesn't bode well for the stock price.
In regards to the chart the long term trend is bearish (D1) but more recently share price retraced after the output cut was announced. On the H1 chart price has made a lower high and the previous wave low has just been broken at the 2026 area which could confirm a change in trend. In regards to value we are at the bottom of the recent value range but could break into the lower mean price range between 1980 and 1900.
R5 Downward trendline
R4 2125.30
R3 2093.84
R2 Internal downtrend line
R1 2026.62
Current 2019.00
S1 1956.17
S2 1940.00
S3 Upward trendline
S4 1929.80

Barclays (BARC LN)Barclays (BARC LN) – recently Co.’s shares have taken a hit after Trump gains ground in the election polls. Yesterday shares received a lift after UK courts decided that MP’s must be involved in the invoking of article 50. This led financial names and GBP to rally as a soft Brexit may be the outcome. Taking a look at the chart we are in a technical downtrend on the D1, but on the lover timeframes we are clearly making higher highs and higher lows. In terms of the RSI on the D1 chart we are still in positive territory, albeit mildly so. On the hourly chart we are seeing a bullish failure swing develop which suggests we are slightly stretched short term. We are slightly above the relative value area on the H1 chart which does suggest after a mild retracement we could see prices move back to the 170-172 area, but the 180.53 support zone would confirm a break lower as the first lower high and lower low would be confirmed.
R3 192.99
R2 downtrend line above current price
R1 187.065
Current 180.65
S1 179.73
S2 177.04
S3 174.81
S4 161.09

FTSE 100 CashThis market is still in a technical uptrend although signs are beginning to emerge that we may be falling off, but the confirmation will come if the 6700 level is broken to the downside. In terms of indicators the RSI has moved into bearish territory but is producing a bullish failure swing. On the monthly timeframe the candlestick action is very bearish but despite this the daily chart is showing signs of exhaustion (which means we may see a retracement). In terms of fundamentals today we saw a court ruling that MP's will have a say on invoking article 50 before it is triggered which was bullish for GBP but bearish for large caps like GSK and mining names, this is due to their profits being denominated in USD. Importers like Dixons Charphone and companies that need a stong GBP i.e. Ryanair this was positive but these companies make up much less of the FTSE100.
R2 7098
R1 6940
Current 6809
S1 6780
S2 6704
S3 Downward internal trendline starting 15th Aug

Schroders (SDR)Since hitting 2000.00 the share price has retraced 41% and since have consolidated around the 2800 area. The average estimates from brokers are still at a hold - buy rating. The RSI is showing a bullish failure swing with the indicator making lows and the price making a higher low.
On the weekly chart price action has been bearish with a shooting star candle (last week). However, the daily chart contradicts this with a hammer candle rejection of the 2754 lows.
R3 2876.80
R2 2850.00
R1 2800.00
Current 2722.00
S1 Upward trendline starting from June 6 low.
S2 2722.00
S3 2651.00
S4 2620.13

Morrison (MRW LN)Price is in a firm up trend despite retracing recently and in recent Kantar surveys showed the Co.'s market share decline 3.2% but stand at a respectable 10.4% with Tesco still in the lead at 28.2%. However, recent news for the Co. has been positive with the tie up with Amazon and their last set of earnings showing an increase in revenues.
R3 230.14
R2 Intraday downtrend line
R1 223.56
Current 221.41
S1 216.98
S2 214.87
In terms of Value Areas we have extended above the mean area on the daily chart and would need another distribution if results are outstanding. If results are worse than expected we could see prices trade back into mean value at around 200.00

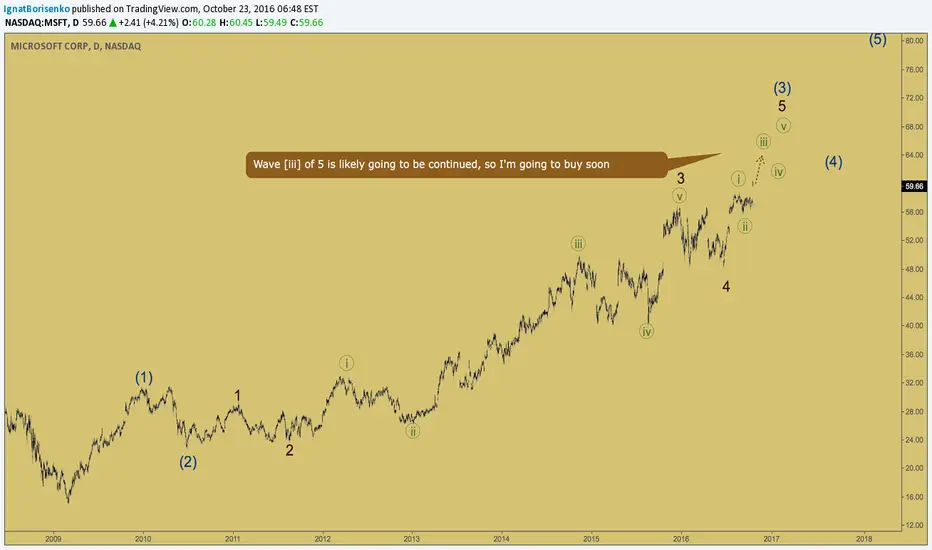
MICROSOFT - bulls going to move onWave of 5 is likely going to be continued, so I'm going to buy soon

Gold Correcting ContinuesGold continues to correct despite the soft rally now taking place. I am inclined to think the highs will open some good sell side opportunities.

mka longone ive watched since IPO and missed my buy. byt eventually got my buys, average : 4p ish. not planning on selling around here. TP; 8-10p


LONG POSITION ON SANTANDER S.A. - D1FOR THOSE WHO DO NOT KNOW SANTANDER S.A. IS ONE OF THE MOST IMPORTANT BANKS IN SPAIN. THE STOCK VALUE HAS BEEN DECREASING SINCE MAY 2015 WHEN THE PRICE WAS WORTH 6.80 € A SHARE. NOW SANTADER IS 3.87 € A SHARE AFTER 1 YEAR AND 3 MONTHS APROX.
THIS FALL HAS STOPPED NOW. FIRST SIGN OF CHANGE OF DIRECTION WAS THE TRIPLE GROUND SUPPORT LEVEL BELOW. THE MARKET CHANGED DIRECTION AND IT HAS BEEN FORMING A SOLID TRIANGLE PATTERN WHICH HAS BEEN FINALLY BROKEN.
I HAVE PUT A BUY LIMIT ORDER AS YOU CAN SEE LOOKING FOR THE RETESTING OF THE TRIANGLE. IF IT HAPPENS WE COULD MANAGE TO DO A VERY NICE ENTRY TOWARDS TO FURTHER RESISTANCE LEVELS FROM THE PAST YEAR AND 3 MONTHS AND LOOK FOR MANY BENEFITS!
TELL ME WHAT YOU THINK ON THIS!!
CARLOS

