$VFF: Log Scale Bullish Shark Visible on the MonthlyWe've got an 0.886 Bullish Shark visible on the Monthly Log Scale Chart with heavy amounts of MACD Bullish Divergence, if we can reach the minimum Bullish Shark targets, then we should expect to see VFF reach 5 dollars in the coming months.
Shark

BONEUSD: Bearish Shark with Bearish PPO ConfirmationWe have Double Confirmation on the PPO that this Bearish Shark Harmonic is active and along with that we have some Bearish Divergence on the MACD and PPO as the RSI Moves down below the 50 Line in an impulsive manner. This could lead to BONE going down 50-90% especially as Shibarium Disappoints.

Immediate Trading Opportunities AwaitDon't let Monday's reputation of slower market movement deceive you! This week, four immediate trading ideas present themselves right at the market's open. Many traders might overlook these due to the common notion that Monday trading is sluggish. Avoid this pitfall by conducting your analysis over the weekend. Stay ahead of the game and seize these trading prospects.
Canadian Dollar vs. Japanese Yen
Turning to the Canada Yen pair, the weekly chart shows a retest of the previous high, indicating a predominantly bullish movement. The daily chart solidifies this bullish trend. Counter-trend traders can explore pullback opportunities to secure good earnings. The four-hour and one-hour charts mirror this setup, offering counter-trend traders a chance to benefit.
🔍 Weekly Chart Insights 🔍
For the Canada Yen pair, a bearish Shark pattern retest presents an opportunity. Counter-trend traders can consider shorting at 108.75, potentially accompanied by RSI divergence. On the daily chart, a shorting opportunity is plausible with a retest at 109.12.
📊 Immediate Focus: Four-Hour Chart 📊
A bearish Bat pattern, already completed, captures my attention on the four-hour chart. This can potentially be shorted right at the market's open, or a bit of patience can be exercised to await an ideal confirmation. An entry point of 107.87 seems fitting if the trade conditions align. Conversely, a buying opportunity might arise with a bullish Bat pattern at 104.67.
🕒 Action-Oriented Monday 🕒
On Monday, my attention will primarily be on the four-hour chart for this trade setup.

NSDQ Possible BUYPrice just reject optimal trading zone and close above the mention range .You initiate buy positions

Apple Inc. : Potential Harmonic; Bearish ConsolidationAAPL has been on the rise ever since it broke above the descending Bullish Dragon Trend Line and confirmed the middle of the Trading Range as support, but as it's risen, both the PPO and RSI have been consolidating tightly within the Overbought Zone which also aligns with the PCZ of a Bearish Deep Gartley on the PPO; just recently, price has hit the HOP level of a Potential Bearish Shark pattern. If we start to see the RSI and PPO come down sharply from the Overbought zones and closer to the 50 levels, then we could confirm a safer Bearish Entry with the stop marginally above the HOP level and target the 0.382 and 0.618 Fibonacci Retraces below.

Worldcoin (WLD) formed bullish Shark for upto 21% pumpHi dear friends, hope you are well and welcome to the new trade setup of Worldcoin (WLD) with US Dollar pair.
On a daily time frame, WLD has formed a bullish Shark for the next price reversal.
Note: Above idea is for educational purpose only. It is advised to diversify and strictly follow the stop loss, and don't get stuck with trade.

Euro-Dollar vs Pound-Dollar: Why Choose🌐 If I had to choose between Euro-Dollar and Pound-Dollar, I'd trade both! However, let's focus on Pound-Dollar for now. On the weekly chart, it's still on a bullish continuation that started earlier than Euro-Dollar.
💹 Lower Timeframes: On lower timeframes, we have a buy zone and a counter-trend trading opportunity. This gives us various entry points for trading.
📊 Weekly Chart: The buy zone ranges from 1.2593 upwards. Daily Chart: A bullish gartley pattern has already formed, offering an immediate buying opportunity for aggressive traders once the market opens. Remember to set stop-loss, targets, and be aware of warning signs.
📈 Four Hour Chart: Another Gartley pattern suggests waiting for a retest at 1.2669 for a second chance entry opportunity. One Hour Chart: A head and shoulder formation indicates a possible pullback before engaging in a bullish shark pattern at 1.2697.
🎯 When trading, keep an eye on the 1.2700 level. A strong bullish run might occur, or if it breaks below 1.2700, a bearish movement could ensue due to stops placed beneath the buy zone.
💼 If you're intrigued by this type of analysis, have fixed rules, and know which direction to focus on...

Nested Harmonic PatternHi
BTC is maybe in a wide range until this end of year.
Looking for these nested Patterns :
Down to Bullish Shark around 20.4K
Up to Bearish 5-0 around 25.5K
Down to Bullish Gartley around 18.5K
Gl in your trades

Kusama (KSM) forming a bullish Shark for next bullish reversalHi dear friends, hope you are well and welcome to the new trade setup of Kusama (KSM) coin with Bitcoin pair.
Previously we caught almost 20% pump KSM as below:
Now on a 4-hr time frame, KSM is about to complete a bullish Shark move for the next price reversal.
Note: Above idea is for educational purpose only. It is advised to diversify and strictly follow the stop loss, and don't get stuck with trade.

NEO coin forming bullish Shark for the next pumpHi dear friends, hope you are well and welcome to the new trade setup of NEO coin with US Dollar pair.
Previously the we caught a nice pump of NEO as below:
Now on 4-hr frame, NEO is about to complete a bullish Shark move for the next price reversal.
Note: Above idea is for educational purpose only. It is advised to diversify and strictly follow the stop loss, and don't get stuck with trade.

Bearish Shark Pattern with RSI Divergence🦈📉 Bearish Shark Pattern with RSI Divergence 📉🦈
Finally, the trade I've been patiently waiting for on EURJPY is here! 🚀 This one calls for a shorting opportunity, treating it as a pullback trade, a retracement trade.
Now, it's time to keep a close eye on how the market reacts when it reaches our first target at 154.25. 🎯 If the market respects this level and chooses to rebound upwards, we have our answer. But if it bashes through the blue box, then we know there's a higher chance of hitting our second target.
Make sure to follow my only account @raynlim for more updates and insights on the financial markets. Let's trade smart and seize the profit opportunity together! 💪💰

Banknifty Bearish Under 45450 till 45100Banknifty Bearish Under 45450 till 45100
Low Support Area
bearish till 45200 OI
after 11.30 Eruopean market open may be sideways market and after 1 may be trending

Nasdaq on the Verge of Retracement
📉🚀 Nasdaq on the Verge of Retracement - Bearish Shark Pattern & RSI Divergence Pointing Downward! 📉🚀
I've spotted a Bearish Shark Pattern with RSI Divergence on the Nasdaq, signaling a potential retracement ahead. I've entered the trade with precise stops and targets in place. Let's keep a close eye on how it unfolds.
📊 If this trade turns out profitable, brace yourself, US stocks might be heading for a bearish ride that could last for weeks to months.
⚠️ US Stocks Traders, get ready for possible impact!
📈 Follow my only account @raynlim for timely updates and trading insights. Let's navigate the markets with confidence! 📈🚀

USDCAD Buying Shark
0.618 222
I am publishing this upcoming trade for the future.
Hopefully this debut is a trade a lot of people make money with.
Good luck.

Sideway Consolidation, Perfect for Counter-Trend Traders!📊 If you're a trader seeking both buying and selling opportunities without worrying about trends, this one's for you! Australia-Canada is in a sideway consolidation, ideal for counter-trend traders who love buying low and selling high. 📉📈
👀 On the daily chart, observe the group of highs and lows. The four-hour chart heads towards previous supports, while the one-hour chart shows a new low, great for shorting.
📈 Weekly potential shark pattern at 0.8704, and daily shark pattern at 0.8728, hint at a close-range longer-term buying opportunity. Don't miss the ABCD pattern on the left—amazing trading opportunities await!
🦋 Butterfly traders watch for completion at 0.8730 on the four-hour chart. Focus on repeated levels for the best returns.
💡Want to spot opportunities like a pro in just 15 mins a day? Scan the QR code and join our community of like-minded traders!
🔍 Different trading strategies point to the same level, making it a key focus for buying opportunities. But don't disregard shorting opportunities—be cautious around 0.8730.
📈 Follow me on my only account @raynlim for insightful analysis and updates. Let's trade smarter together! 💹📈

Nifty Below 19500 Bearish till 19000Fib Retracement 19600 till 50% Pullback to Go higher than 20k
Below 19500 M pattern activation till 19000
Above 21 EMA
50 EMA
100 EMA
200 EMA


Banknifty 47000 1hr Creating Inverted Head-ShoulderBanknifty 1hr Creating Inverted Head-Shoulder Pattern
Above 45800 Activation
14 Aug 2023 Target 47000 BankNifty
EMA 50
EMA 100
EMA 200

Nifty 19800 Inverted Head & Shoulder above 19720Nifty Target 19800
Inverted Head & Shoulder above 19720 active
Fibb Retracement from 50%

Banknifty 45600 15min Creating Head and Shoulder Below 4595015min
Creating Head and Shoulder Below 45950 activation
Target Banknifty 45600
RSI
ADX
200 EMA 100 EMA 50 EMA

Finnifty 20350 15min Creating Head and Shoulder Below 20500
15min
Creating Head and Shoulder Below 20500 activation
Target Finnifty 20350
RSI
ADX
200 EMA 100 EMA 50 EMA

Harmonically, US Interest Rates are Headed Toward 35%The US Interest Rate chart has been trading within a Descending Broadening Wedge and has recently broken out of the wedge. The target for a pattern like this is typically back to the inception of the pattern, which in this case would be 20%; but we also have an additional variable here, and that's the Potential Logscale Harmonic Formation we've made here. If we are to treat the action of this chart as we'd treat any other chart, then we'd expect that once B gets broken, we'd get an accelerated move all the way up to the Harmonic Completion of a Bearish Shark, which would land us at the 1.13/1.618 Harmonic Confluence Zone up at around 34-35%
There have been previous instances where Harmonics have had a predictive quality over data like this, such as the accelerated liquidity exit out of the reverse repo facility, the bond yield charts on multiple occasions, and the US Inflation Rate Charts. Which can all be seen in the related ideas tab if you are skeptical of my use of Harmonic Patterns in this context.

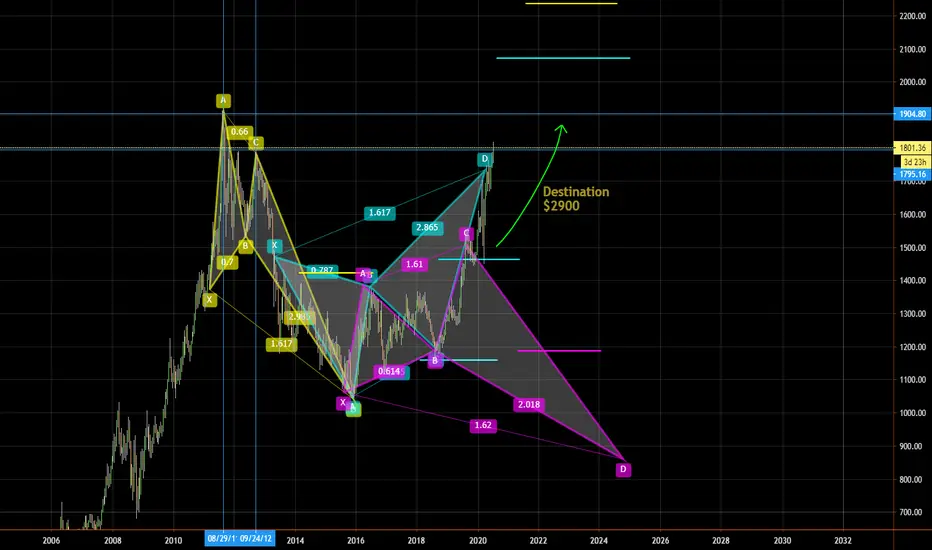
GOLD MARKET GO BULL-rrrI had short term reservations on GOLD, but zooming out and looking at MAX Potential Gold appears to be on an upper trajectory of
2900/ oz. for paper gold. This is an upper area - ther are other significant targets marked on the chart as well. Physical Gold could end up being much more.
Yes there will be some corrections as the DJI, NDX, and SPX move, but overall with the approaching Bear Market GOLD is primed and has not even begun to show off yet.
CHEERS!