Harmonically, US Interest Rates are Headed Toward 35%The US Interest Rate chart has been trading within a Descending Broadening Wedge and has recently broken out of the wedge. The target for a pattern like this is typically back to the inception of the pattern, which in this case would be 20%; but we also have an additional variable here, and that's the Potential Logscale Harmonic Formation we've made here. If we are to treat the action of this chart as we'd treat any other chart, then we'd expect that once B gets broken, we'd get an accelerated move all the way up to the Harmonic Completion of a Bearish Shark, which would land us at the 1.13/1.618 Harmonic Confluence Zone up at around 34-35%
There have been previous instances where Harmonics have had a predictive quality over data like this, such as the accelerated liquidity exit out of the reverse repo facility, the bond yield charts on multiple occasions, and the US Inflation Rate Charts. Which can all be seen in the related ideas tab if you are skeptical of my use of Harmonic Patterns in this context.
Shark

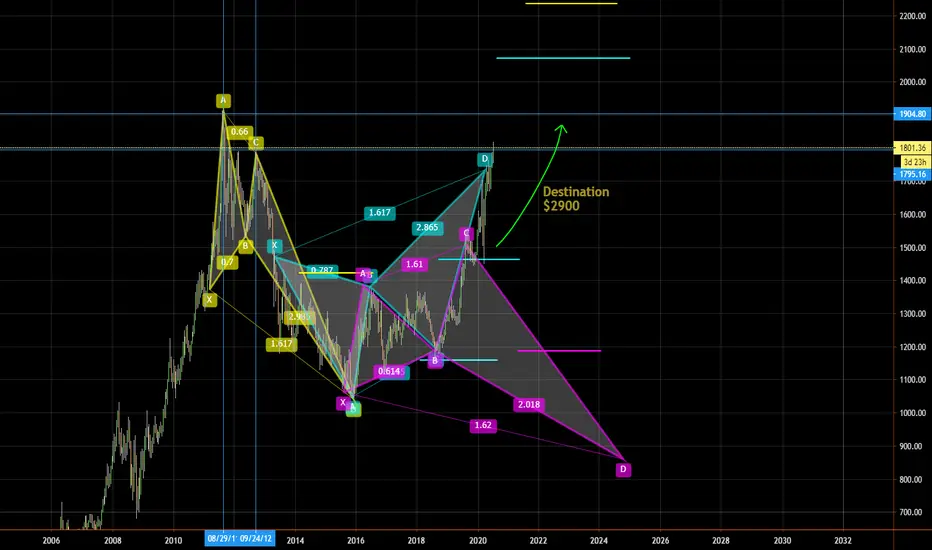
GOLD MARKET GO BULL-rrrI had short term reservations on GOLD, but zooming out and looking at MAX Potential Gold appears to be on an upper trajectory of
2900/ oz. for paper gold. This is an upper area - ther are other significant targets marked on the chart as well. Physical Gold could end up being much more.
Yes there will be some corrections as the DJI, NDX, and SPX move, but overall with the approaching Bear Market GOLD is primed and has not even begun to show off yet.
CHEERS!
QQQ: Looking Out for a 20-40% Pull BackThe NASDAQ100 is currently sitting at the 0.886 and 1.618 PCZs of big Bearish Shark and Bearish Butterfly patterns as the indicators hover around the overbought zones; we don't exactly have much confirmation yet that these PCZs will hold, but it seems like it wouldn't be a bad idea to position against the QQQ early on via some SQQQ monthly calls and perhaps getting Bearish on some of the top stocks within the index such as NVDA, TSLA, and MSFT.
Being conservative, I will only be looking for it to come back to the common Fibonacci Retracement zones below, but it's also possible that this ends up being a macro top; for the time being, that doesn't really matter because as of right now, it looks quite Bearish.
On a side note, the VIX also looks like it's been preparing to spike up for a few months now and the targets for such a spike are pretty massive, as seen here:

Aggressive Approach on USDCAD!Get ready for some action! The USDCAD trade is heating up, and here's why you should be excited! 💪
On the Weekly Chart, a key support level has been broken, signaling a potential trend reversal. 📉🚫 This opens up an aggressive shorting opportunity for traders who thrive on bold moves! 📉💥
The Bearish Shark Pattern has formed at 1.3587, and all signs point to a potential bearish trend continuation. 🦇📉 But remember, aggressive trading requires careful risk management! 🛡️💼
Should the market retraces to 1.3175 before the Bearish Shark, I will long USDCAD with the help of Bullish Shark Pattern and I might be using a trade management known as the Upsize Trade.
Stay tuned as we dive deeper into this aggressive approach, and remember, trading is all about seizing opportunities! 📈✨

GBPJPY ADVANCE HARMONICS PATTERN SHARK BULLISH GBPJPY has formed an Advance Harmonics Pattern Shark Bullish on its hourly chart.
The price is trading above near the long entry level EL: 180.265.
ST: 179.824
Target:
38% CD: 181.424
62% CD: 182.412
79% CD: 183.122

Bearish sharkbe careful and aware from market this one is risky but on daily tf and harmonic is always reliable.......

CADCHF Bullish Harmonic SharkA Bullish Harmonic Shark pattern is nearly completed and and ready for long positions.

SingularityNET (AGIX) forming bullish Shark for upto 24.50% pumpHi dear friends, hope you are well and welcome to the new trade setup of SingularityNET (AGIX) with US Dollar pair.
Recently I shared a trade signal for AGIX and it was really close to enter the buying zone but pumped before the completion of final leg as below:
Now on a daily time frame, AGIX is about to complete a bullish Shark pattern for the next price reversal.
Note: Above idea is for educational purpose only. It is advised to diversify and strictly follow the stop loss, and don't get stuck with trade.

Major Counter-Trend Trade🔍 Dive into my latest analysis on the related article and compare it with my previous week's analysis.
📉 Just like last week, we have identified the formation of a Bearish Shark Pattern. This pattern suggests a potential bearish movement in the market.
⚖️ For conservative traders, it's recommended to wait for a violation of the trendline on the 4-hourly chart. Once the trendline is violated, patiently wait for the retest before considering entering the trade.
Stay updated with my analysis as we navigate the market and uncover potential trading opportunities. Don't miss out on valuable insights! 💼📈

Shorting Opportunity🔍 Take Note! This week's market may experience a retracement, and my focus is on a potential shorting opportunity at the resistance level of 1.0987.
Stay tuned as we analyze the charts and identify the optimal entry points for profitable trades.
Let's navigate the retracement together and seize the right opportunities! 💪📉

Algorand (ALGO) formed bullish Shark for another price reversalHi dear friends, hope you are well and welcome to the new trade setup of Algorand (ALGO).
Our last successful trade of ALGO was as below:
Now on a 4-hr time frame with Bitcoin pair, ALGO has formed a bullish Shark move, at the moment after the completion of final leg the priceline is slightly moved up, therefore, we can wait for some correction.
Note: Above idea is for educational purpose only. It is advised to diversify and strictly follow the stop loss, and don't get stuck with trade.

Great Wins on WTI💰 Celebrating two great wins on WTI in June! But let me clarify, I'm not chasing streaks—I focus on proper setups. Let's dive into the current situation for WTI, aka US Oil.
📈 The market is testing the support line on the weekly chart. While some traders see it as strong support and anticipate buying opportunities, multiple retests increase the likelihood of a break. That's why my highest priority is shorting WTI and monitoring key levels.
⏰ On the 4-hourly chart, I'm cautious about shorting at the Bearish 5-0 pattern. If I spot an RSI divergence, my perspective may change.
⬇️ Instead, I'm patiently waiting for the Bearish Shark Pattern at 72.03 for a shorting opportunity.
⏱️ On the 1-hourly chart, if you're seeking a buying opportunity, watch for a confirmed candlestick pattern on the Bullish Bat setup at 69.61.
📊 Share your trade plan for WTI! What's your top investment product?

Finally, Shorting Opportunity📉 After a week of waiting, the market has finally retested my preferred entry price for a short position on the Bearish Crab Pattern(daily chart), which complements the Bearish Shark Pattern(weekly chart) at the 88.50 level. Check out the link article in the TradingView post for a refresher on last week's discussion.
💼 Trading is all about minimizing initial stop-loss and maximizing profits sensibly.
🔄 A retest of the key resistance level at 88.60 on the 1-hourly chart would confirm this trading idea for me.
🔝 This trade holds the highest priority for me in the upcoming week.
Share your highest priority trade for the week! 📊💭

Aggressive Buying🔍 Current Situation: No favourable buying opportunity on GBPUSD, but counter-trend trading possibilities exist.
🔴 Retest of Double Top: Watch for a retest of the double top pattern completing at 1.2745 on the 4-hourly chart. Traders eyeing a reversal will be attracted. #DoubleTopPattern
🦈 Bearish Shark Pattern: Keep an eye on the Bearish Shark Pattern completing at 1.2743. Short-savvy traders may join in. #SharkPattern
💥 Market Reaction: As two trader groups converge at 1.2745, expect heightened volatility and rapid movements. Stay prepared! #VolatilityAlert
📊 Trade Strategy: Exercise caution with counter-trend trades. Set conservative targets and manage risk effectively. Scale in wisely. #RiskManagement
👀 Stay Vigilant: Continuously monitor price action and adapt your approach as the market unfolds. Protect your capital! #StayAlert

Shorting Opportunity🔍📊 Current Market Overview:
I'm closely monitoring the EURUSD pair for a potential shorting opportunity on the higher timeframe. However, at the moment, two buying opportunities have emerged, which deserve our attention. Let's dive into the details:
🦋 Bullish Butterfly Pattern:
On the daily chart, we have identified a Bullish Butterfly Pattern with completion anticipated at 1.0355. This pattern suggests a potential buying opportunity, indicating a reversal in the price action. It's crucial to keep a close eye on the price as it approaches this level.
🦈 Bullish Shark Pattern:
Another interesting development is the Bullish Shark Pattern observed on the 4-hourly chart. This pattern is expected to complete around 1.0764, signalling a potential buying opportunity. However, it's important to remember that these patterns occur in the context of a counter-trend trading strategy.
💼 Trading Strategy:
Given the absence of a clear shorting opportunity, I will adopt a conservative approach and focus on the identified buying opportunities. I will set conservative targets for these trades while remaining vigilant for a suitable shorting opportunity to align with my overall strategy.

WTI H4, Bullish Shart RetestThe Bullish Shark Pattern has formed on the 4-hourly chart. It is a retest of entry; the setup looks legit, its potential returns tempt me
If you are interested in getting involved, the entry price is at
EP: $67.67(buffer $2.50)
ISL: $66.55($-1.12)
TP1: $70.31($2.64)2.35
TP2: $72.15($4.48)4
Do your own analysis, and do not follow blindly.
At 9.30pm(SGT), approx 6hours from posting, there's a lot 4 major Central Bank Gov. speaking.
BOJ, BOE, ECB President,Fed Chair
If the situation permits, that's the time I would like to shift my stops to entry.

EURGBP → Formation of a pre-breakout consolidationFX:EURGBP a week earlier forms a break of the resistance of the descending price channel. A consolidation of 0.86000-0.85400 is forming. We see consolidation at the resistance. What to expect from the price?
Most likely, the price will continue to test resistance 0.86067. Pre-break consolidation is forming, which can be interpreted as another attempt of price exit from the range, followed by the strengthening of the currency pair.
Moving averages are beginning to narrow and if the conditions are favorable, they may soon form a signal that confirms the intention of the market to change the trend.
A breakout at 0.8606767 will send the price to 0.86722, but if the breakout does not happen, correction to the trend support will be formed.
Resistance levels: 0.86067, 0.86345, 0.86722
Support levels: 0.85725, trend support
The market is showing good dynamics and consolidation confirms the intention of the buyers. I am waiting for breakthrough of resistance with the subsequent growth.
Regards R. Linda!

Bullish Shark on GBPUSDI'm much more comfortable trading the Forex Pair then Oil, where comes the Bullish Shark retest on the GBPUSD on the 8-range bar for a buying opportunity.
I might even keep my second target open, as I'd the bullish bias on the GBPUSD.
What's your thoughts on GBPUSD?

Nifty forming ALT SharkNifty made new high as i said in my group on may 17, Now its time for a pullback. expecting it to hit 19087-103
It will become weak if it break 18592, targets on chart

HDFCLIFE TOWARDS 800-840 levels
HDFCLIFE Ltd is trading in an up-sloping channel, and within this channel, there is a probability of a Shark Pattern, which if unfolds can take stock towards 800- 840 levels in the coming weeks and months.
Can't comment on how smooth is movement is going to be, but any dip in the stock would be an opportunity to go long in the stock, as long as the stock is trading above the 590-600 levels.
Positional Trade timeline: 3-4 months.
The upside of approx 25%, more if bought in the dip.

USDCAD SHORT FOR THE NEXT WEEKIf the solid is formed for us in the Next six days, and the price rebounds from the yellow line, we enter SHORT position.
EN:1.32875-132842
TP1:1.32249
TP2:1.31847
SL:1.33154
It better if the stop lose is close day candle higher 1.32875

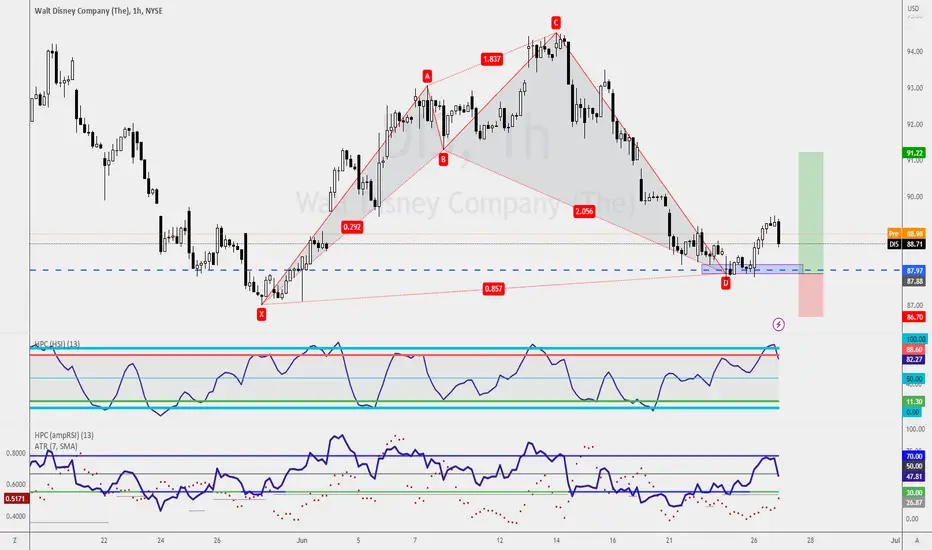
I might want to own DisneyI might want to own Disney as my first stock. Now this is why!
Are you aware that Netflix stopped allowing users of different IPs to log in and watch the show, even when you had a premium subscription?
That means, even if you are from the same household, but one of you has an extended overseas trip, he could be booted out after he has "used up" the overseas button.
In some countries, the subscription fee of Disney is 3 times cheaper than Netflix. I'm unsure if that's what Disney offers for the first-time sign-up client, but it is worth noticing.
Disney owns some of the biggest brands, such as Marvel, Starwars, 20th Fox Century Studio, and more.
Although I'm not optimistic about some of the new Marvel series, there is so much more potential with Disney.
So when the Bullish Shark Pattern has confirmed at $87.90, it is great news for me to own my first stock and it might be Disney.
What's your take on this?
Correlation Matters No More
For the longest time, I've been saying that the correlations between the currency pairs have been weakened.
Traders have asked me why I have NZDJPY and NZDUSD in my portfolio. Doesn't it move in the same direction?
Over the years, these correlated pairs move pretty differently. And recently, the WTI and Gold have no longer moved in an inverse relationship.
So yeah, I'm treating them as their own.
Although both the 4-hourly and 1-hourly charts show buying opportunities through a potential Bullish Bat Pattern and a Bullish Shark Pattern, I'm more interested in waiting for a shorting opportunity on the 5-0 Pattern.
What's your take on the NZDUSD?
