COIN: Bearish Shark with Class C Hidden Bearish DivergenceI think it will pullback and make a 50% retrace from here.
Shark

Banknifty - at Important levels There is a formation of a Shark pattern on the daily chart of the Banknifty
Supply Zone: 38000-38430
We might see the banknifty taking pause around these levels and we may see some correction also.
RSI is also slightly overbought.

NIFTY 50 - Probable path moving ForwardThere is a probability of Shark Pattern on the daily chart of Nifty50.
We have seen a rapid up move in the past two weeks and this week also nifty opened on a positive note and might see some more upside in the coming trading sessions.
Though the Nifty 50 is coming close to a major supply zone and we might see it either halting or a sharp correction from there.
Supply zone 17500- 17800.

Scenario 2 (Bullish Shark) 19.5k OR 18.3kBullish Shark pattern target is matching the numbers - it says 19.5k for the 0.886 fib, or 18.3k for the 1.618 fib. Either one can happen.
The 1.113 fib has confirmed our top for BTC at X-B (it head dead on)
I have changed my LONG to order at 18.3k, with the same LONG TP as in the "Link to Related Ideas" chart I posted yesturday.
The thing that convinces me is the 1.113 of OX is the exact same point as the 1.618 of AB, that is 18.3k.
Therefore, I am leaning more towards 18.3k.
18.3k would also make a lot of Bears think its going much lower (bear flag fakeout).
-----------------
Bullish Shark rules:
The Shark pattern has the following ratios.
CONFIRMED - AB leg extends OX leg between 113% – 161.8% (because of this, 26.5k is also kind of possible but not likely now, whales just pushed price up to form this harmonic and then BARTed it.)
CONFIRMED - BC leg extends beyond O by 113% of the OX leg
LETS SEE - BC leg is also an extension of AX by 161.8% – 224%
Unlike other harmonic patterns, the trades are entered as follows:
Entry is at 88.6% of OX leg (19.5k) with stops coming in below point C (18.3k or 19.5k, so lets say 18.1k)
Targets can be 61.8% of BC (This would be around 22,222 if 1.618 reaches and 22.7k if only the 0.886 reaches)

💎 COMPUSDT: 797.52% Profit Potential in Next 9 Months💣💣💣💣Last 2-3 weeks we seen huge buying in COMP coin, in upcoming months its to going pump very hard.
entry and targets are given on the chart. Treat this idea as long-term investment
please Like and comment if there are any queries.
#bitcoin #altcoinseason #altcoin #altnews

GBPUSD-Weekly Market Analysis-Aug22,Wk1A counter-trend setup on GBPUSD, a Bullish Shark Pattern that is completing at 1.2015. As Shark Patterns can be tricky, a candlestick pattern confirmation is important.

Shark Pattern on AAPLI made the mistake of shorting Apple into earnings based on a quick analysis without carefully analyzing its chart pattern. It's clearly on the last leg of a shark pattern and should continue pushing higher. I will be watching carefully for another opportunity to short near the 88% retracement point, which also happens to be near trendline resistance.
Tips: ETH Address: 0x13cd45d7d282ee0ee4635645cce2e2a566d9bed8

EURJPY - Bullish SharkA Bullish Shark Pattern has checkback and retest. It seems like a busy Monday for Japanese Yen traders.

EURJPY - Bullish SharkShark Pattern is the most tricky Harmonic Patterns, I will have to wait for candlestick close at 1pm(GMT +8) to decide if this is the trade for me.

GBPUSD - Bearish SharkHarmonic Patterns in a trend trading setup are possible. The Bearish Shark Pattern became a perfect setup for traders who want to get into the trend trading setup, but do note that it is possible that the structure trader could get involved in the trade.
Check the related ideas at the bottom.

EURUSD-Weekly Market Analysis-Jul22,Wk5This Bearish Shark setup might concern traders who trade Bullish Flag Pattern. I will observe how the market reacts at 1.0264 for a shorting opportunity, the RSI Divergence does gave me additional confirmation to short the EURUSD.

Burger Swap formed bullish Shark for upto 175% rallyHi dear friends, hope you are well and welcome to the new trade setup of Burger Swap with Bitcoin pair.
On a 4-hr time frame chart, burger has formed bullish Shark .
Note: Above idea is for educational purpose only. It is advised to diversify and strictly follow the stop loss, and don't get stuck with trade

Potential Bearish BAMM On The USDT DominanceThis is a Potential Bearish BAMM Play on the USDT.Dominance that if it plays out could take us back down to the overall .786 retrace of the Harmonic Range which is Confluent with the .886 retrace of the Currently Potential Harmonic Shark BAMM; The Shark BAMM will be confirmed once price trades below the B point of the Shark but as of right now it's atleast trading below the Moving Averages and heading in that direction which may warrant an Early Entry into markets for those who like to front run and play it a bit more agressively than most.

STORJ shark pattern to $1#STORJ/USDT
$STORJ broke out from descending resistance and confirmed it as support and can complete SHARK pattern between $0.93 and $1

Nifty - Bearish BatNifty near to prz of bearish bat and also hitting parallel upper channel. Looks like its forming a shark on htf... Once target achieved we can expect up side rally till shark.
Target on chart.

MATIC 15mins Shark patterpossible Shark pattern . pratice charting only. Not a financial advise
This is only to monitor progress in my trading journey.
Anyone is free to make comment or suggest for me to improve my trading skills.

BTCUSD M15 POTENTIAL SHARK PATTERNHello traders. I see potential SHARK pattern and RSI divergence on BTCUSD M15 chart. We have to wait for the price to reach that level to enter the transaction from the D zone. Good luck everybody.

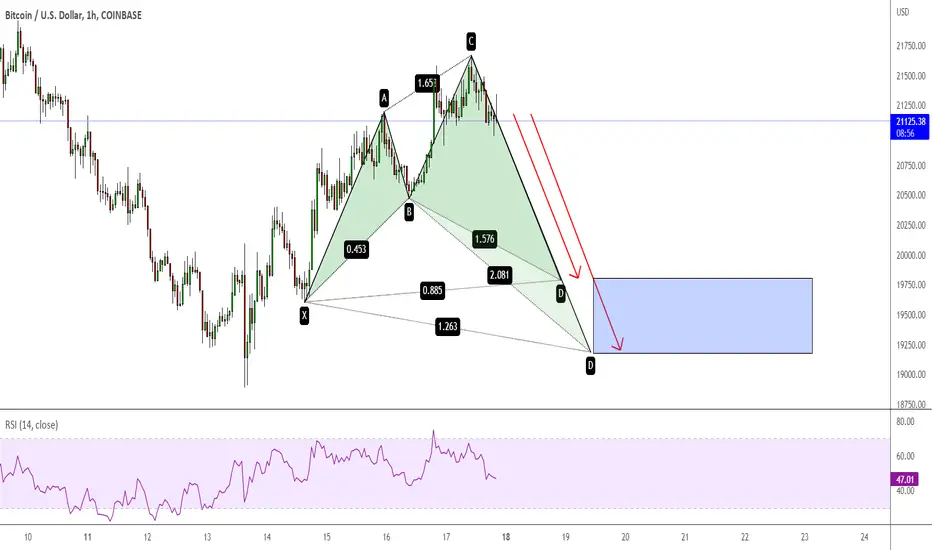
BTCUSD H1 POTENTIAL SHARK OR CYPHER PATTERNHello traders. I see potential SHARK pattern or CYPHER pattern on BTCUSD H1 chart. We have to wait for the price to reach that level to enter the transaction from the D zone. Good luck everybody.
EURUSD-Weekly Market Analysis-Jul22,Wk4The Bullish Deep Crab Pattern on the Daily Chart might not form up, and even if it did, it might not be ideal. However, if you have long based on the counter-trend trade on the Bearish Parallel Channel, congratulation is in place.(check out last week's chart at the bottom of the tradingview link).
Alternatively, you can wait for the Bearish Shark Pattern on the 4-hourly timeframe to complete, hitting the first target and waiting for a buying opportunity on a 5-0 pattern setup.
In trading, being patient is important.

Burger Swap formed bullish Shark for upto 49% pumpHi dear friends, hope you are well and welcome to the new trade setup of Burger Swap.
On a 4-hr time frame chart, burger has formed bullish Shark .
Note: Above idea is for educational purpose only. It is advised to diversify and strictly follow the stop loss, and don't get stuck with trade

Common features of all bullish harmonic patterns.www.tradingview.com
By combing all bullish harmonic patterns together, we can observe the following:
1. The Bat, Cypher , Gartley and Shark pattern point D is (0.786 - 0.886) XA without breaking the low.
2. The Butterfly, Nenstar , Crab and Deep Crab point D is (1.272 - 1.618) XA after breaking the low.
3. Point C band is common for all patterns (0.382 - 0.886) AB
4. Pint B band is common for three patterns ( 0.382 -0.618) : Bat (upto 0.5) , Gartley and Crab, with the Gartley pattern point B fixed at 0.618 XA
5. Patterns breaking out of Point A high have a band ( 1.13 - 1.61 )AB

GALA Shark patternpossible shark pattern . pratice charting only. Not a financial advise
This is only to monitor progress in my trading journey.
Anyone is free to make comment or suggest for me to improve my trading skills.

EURJPY - Bearish FlagCounter-trend traders can wait for a shorting opportunity at 138.81 to fulfil a potential Bearish Flag Pattern. This could be the most volatile trade compared to the Shark Pattern.
Although the Bearish Shark Pattern is a more conservative setup, that doesn't mean it won't be profitable. Should the candle break and close beyond the first red box, traders can wait for a candlestick confirmation at 141.81 to engage this harmonic patterns.
