POSSIBLE CRAZY FALL ON USDJPY ??!All through 2021, we've seen price rise steadily on USDJPY.
Right now, price is approaching a monthly resistance, from which a huge reaction could occur that could take price to 102.00
There's also a shark harmonic pattern in formation.
When the time is "right", we'll be looking to capitalize on this move with a 30 pip stoploss (max.)
Trade safe🥂
Keep it simple ✅
Shark
Shark Pattern at BTC DailyBTC Daily has formed a Shark Pattern. The 0.886 retracement of XA and the 2.236 extension of BC have created a cluster zone between 44000 and 43745. However, we have now unfortunately already bounced through the zone. Had the price stopped here and formed a very bullish candle, then we would have had a long signal. Presumably, however, the correction of XA is now completed, should a bullish signal arise, the direction of XA would have to be resumed, at least for 66.8%.
AUDUSD - Bearish Shark (9Jan2022)Compare to EURJPY, AUDUSD has a better Shark Pattern formation and that is because the Bearish Shark Pattern forms within the previous consolidation zone which is also known as the sell zone or the supply zone.
I'm waiting for the candle pattern confirmation at 0.7214.
You can check out the EURJPY Shark Pattern under the related ideas within the tradingview post.
EURJPY - Bearish Shark (9Jan2022)A Bearish Shark Pattern emerge on EURJPY at 131.63. Have you spotted the possibility of a Bullish Shark Pattern within the same chart? This makes EURJPY an interesting currency pair to trade.
I will wait for candlestick confirmation to engage this trade.
What's your trade plan?
TRC | Bull Trap Beware | Anti Shark Bearish Harmonic | DowntrendTRC | Thailand SET Index | Construction Sector | Chart Pattern Trading
Chart Pattern: Anti Shark Harmonic Bearish Pattern - Bull Trap
Price Action: Short Entry @ low breakout recommendation - Target Downtrend at the Shark tail
Good Luck
DP
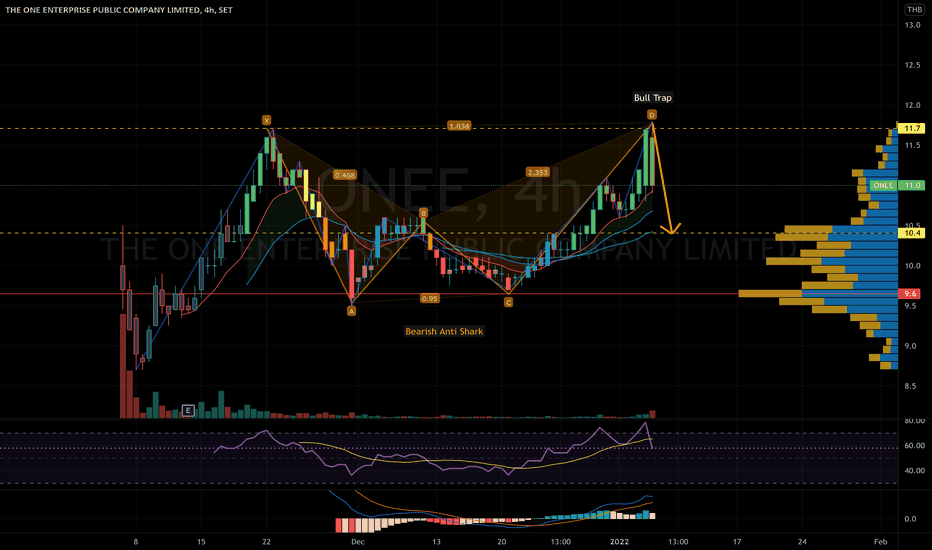
ONEE | Bearish Anti Shark Harmonic | Bull Trap | Entry@Pullback?ONEE | Thailand SET Index | Media Sector | Price Action & Chart Pattern Trading
Chart Pattern: Anti Shark Bearish Harmonic
Price Action: Short Entry @ Breakout avoid Bull Trap and could be entry @ pullback position for speculative buy
Indicator:
> RSI down dead cross MA line still on high bullish side above 50.
> MACD remains upside above baseline 0
Stop-loss @ Shark’s tail position - target at shark’s head until further new pattern changes
Trade with affordable risk ratio 3:1
Always respect your stoploss
Good Luck
DP
Bitcoin re-entered potential reversal zone of harmonic patternHi friends, hope you are well and welcome to the new trade setup of Bitcoin ( BTC ).
In reference to the below idea:
On a weekly time frame, this time BTC has again entered the potential reversal zone of the same bullish Shark pattern and there is also very strong support at $41330, The Stochastic has entered the oversold zone, therefore the price may start a reversal move from above this level. However, as per the Fibonacci sequence, the buying and sell targets can be as below:
Buy between: $42701 to $36005
Sell between: $48609 to $61939
Stop loss:
The maximum extent of the buying zone $36005 can be used as stop loss.
Possible profit and loss ratio:
As per the above targets, this trade has a profit possibility of up to 72%, and the loss possibility is 16%.
Note: Above idea is for educational purpose only. It is advised to diversify and strictly follow the stop loss, and don't get stuck with trade
BITCOIN, 15 min, BITSTAMP:BTCUSD
DISCLAIMER:
I am not a financial /investment advisor. All information i am sharing here is for entertainment purposes only and should not be considered personal investment advice. While the information provided is accurate, it may include errors or inaccuracies. Please, do your diligence when it comes to investing or trading in the market. You are responsible on your choice. Thank you
POSSIBLE 400 PIPSStructure has been broken on the 4H timeframe.
Prime Entry ... 0.6235
30 Pips Stoploss
Target ... 0.6630
Risk : Reward
1 : 13
Move stoploss to breakeven around 0.6355 (i.e 38.2 level of the CD Leg of the harmonic pattern)
Manually exit position if price closes below 0.6235 ON THE 4H TIMEFRAME


