AUDNZD | Hidden Bearish Divergence | Harmonic Bearish Shark The AUDNZD chart currently shows the formation of a XABCD Harmonic Shark Bearish Pattern, indicating a Potential Reversal Zone (PRZ). Additionally, there is a hidden bearish divergence, suggesting that the current uptrend is likely to reverse into a downtrend. Furthermore, on the daily chart, the price has just touched a strong daily resistance zone, which also serves as an Order Block (OB). This action confirms the bearish OB and all these indicators collectively suggest a shift in the trend to a downtrend.
In technical analysis, a Harmonic Shark pattern is a specific type of harmonic pattern that signals potential trend reversals. The completion of this pattern at the PRZ indicates an area where traders might anticipate a change in the current price direction.
A hidden bearish divergence occurs when the price forms higher highs, but the corresponding indicator (such as the Relative Strength Index or RSI) shows lower highs. This suggests underlying weakness in the upward momentum, potentially leading to a reversal.
The concept of an Order Block (OB) refers to a significant level of support or resistance where institutional traders have previously entered the market. When the price approaches and reacts to this level, it can confirm the strength of the OB.
On the 1-hour time frame, also there is a hidden bearish divergence, and the Previous Day High (PDH) liquidity has been taken. Whenever the PDH is breached, a pullback to the downtrend is often observed. Additionally, the trend line on the 1-hour time frame has been broken, and the price has retested this trend line. According to Dow Theory, these indications suggest a shift in price behavior from forming higher highs (HH) and higher lows (HL) to forming lower highs (LH) and lower lows (LL).
On the daily time frame, the price has tested a strong resistance zone and is rejecting from its peak resistance level bearish OB. Overall, the daily chart appears bearish, indicating a potential trend change. Additionally, there is a trend line liquidity that needs to be breached for the price to move in either direction.
In summary, the combination of the Harmonic Shark Bearish Pattern, hidden bearish divergence, and interaction with a higher time frame to lower time frame strong daily resistance zone (Order Block) suggests a strong indication of a potential shift from an uptrend to a downtrend in the AUDNZD pair. However, it's essential to conduct comprehensive analysis and consider other factors before making trading decisions.
Shark

Bullish Beautifull Golden Shark Pattern Will Start at 1905 $the detail is shown in the above Chart.
I made this Idea based on Candlestick Analysis and Harmonic pattern.
Bullish Shark Pattern Will Start at 1905$.
The Golden Shark recently bounced back from the 0.88 Fibonacci level at $1,952
And 1 Fibonacci level at $1,936.
So we expect gold to start rising at the 1.13 level based on the shark pattern.
Good Luck
SEYED.

Audio Usdt Bearish Shark & Rising Wedge Though there be expected Bearish Shark through 0.26 levels, also rising wedge points out same range. I expect 10 days of down trend to be continued with the effect of the rising usdt dominance of it 5-5.3 leaves.

Counter-Trend for Greater ProfitsThis week, I'm looking at NZDJPY with a bearish perspective, and here's my trade plan:
1. Bearish Shark Pattern Confirmation at 91.74: I'll be patiently waiting for the Bearish Shark Pattern to confirm at the level of 91.74. This level coincides with the formation of a Head & Shoulders pattern, adding confluence to the bearish setup.
2. Extended Trading Targets: If the Bearish Shark Pattern sets up as anticipated, I'll extend my trading targets beyond the traditional Target1 and Target2. By doing so, I aim to capitalize on the potential bearish momentum and maximize profits from the trade.
3. Stop Loss Management: Once the market reaches the traditional Target1 of the Shark Pattern, I'll shift my stops to the entry level to protect profits and minimize risk.
By patiently waiting for the bearish setup to confirm and managing stops effectively, I aim to capitalize on the shorting opportunity presented by NZDJPY this week.
What are your thoughts on NZDJPY? Feel free to share your trade plans and insights below!
Wishing everyone successful trading ahead!

Short on EURUSDThis week, I'm leaning towards a shorting opportunity on EURUSD for a couple of reasons:
1. **Bearish Shark Pattern on Daily Timeframe:** The presence of a Bearish Shark Pattern on the daily timeframe suggests a potential downward movement in the price.
2. **Breakthrough of Bullish Gartley Pattern:** The Bullish Gartley Pattern on the 4-hourly chart breaking through the Potential Reversal Zone (PRZ) indicates a weakening bullish sentiment.
3. **Waiting for Retest:** I'll be patient and wait for the market to retest the resistance level at 1.09121 before entering a short position.
What are your thoughts on EURUSD? Share your trade plans and perspectives below!
Let's make this week a profitable one!
Happy Trading!

BOIL: Set for a Potential Bullish Reversal at Bullish Shark PCZNatural Gas on an intra-week basis seems to be in a position to Bullishly Reverse as it sits at the PCZ of a potential Bullish Shark with slight Bullish Divergence near the previous month's low. My target will be anywhere between $16 and $20 though it could always go higher.

Anticipating a Buying Opportunity on Daily ChartEURUSD is catching my attention, and here's my perspective:
1. Bearish Shark Pattern on Daily Chart:
- For traders seeking shorting opportunities, there's a Bearish Shark Pattern on the Daily chart.
- The completion of this pattern might indicate a potential bearish move.
2. Buying Opportunity at 1.0879:
- Personally, I'm eyeing a buying opportunity on EURUSD.
- Despite a flawed Bullish Shark Pattern, I'm looking to enter long at 1.0879.
Share your thoughts and trade plans for EURUSD in the comments below. Let's keep the discussion going!

RSI Divergence and Bearish Shark Pattern Combo TradeToday, let's delve into an intriguing setup on GBPJPY that combines a Weekly Chart RSI Divergence with a 1-hourly Bearish Shark Pattern:
1. Weekly Chart RSI Divergence:
- Observe the RSI Divergence on the Weekly Chart, signaling a potential weakening of the bullish trend.
- This divergence might serve as a precursor to a reversal or retracement.
2. 1-hourly Bearish Shark Pattern at 190.72:
- Look for a shorting opportunity as the Bearish Shark Pattern completes at 190.72 on the 1-hourly chart.
- Engaging in a short position aligns with the potential bearish sentiment suggested by the RSI Divergence.
This combo trade approach involves using higher timeframes for trend analysis (Weekly RSI Divergence) and pinpointing a precise entry with a harmonic pattern on a lower timeframe (1-hourly Bearish Shark).
Feel free to share your thoughts and trade plans for GBPJPY in the comments below. For a visual representation, refer to the chart link provided.

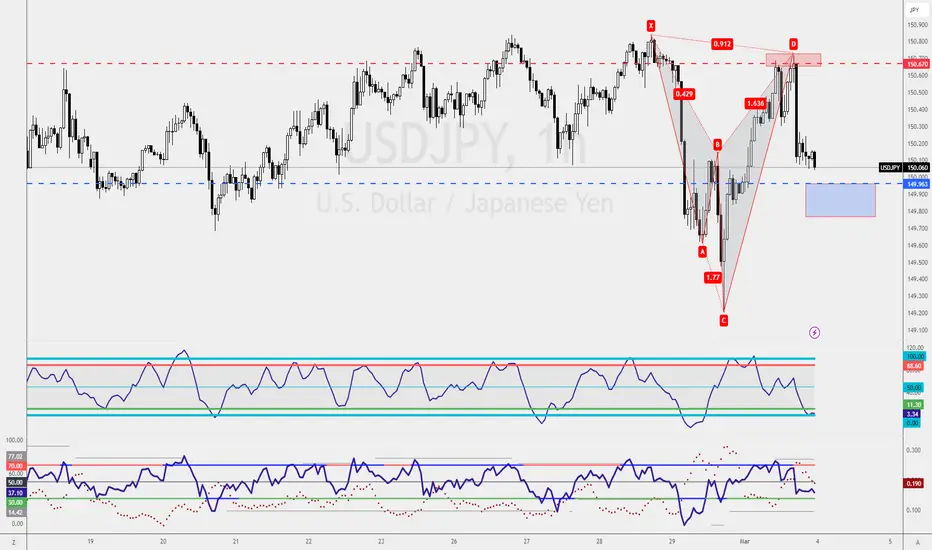
Bullish 5-0 vs. Type2 Bearish Shark PatternIf you're navigating conflicting biases, here are two potential setups:
1. Bullish 5-0 Pattern at 149.96: Long Opportunity
- Engage in a long position based on the completion of the Bullish 5-0 pattern at 149.96.
- This pattern signals a bullish bias, providing an opportunity for traders expecting an upward move.
2. Type2 Bearish Shark Pattern at 150.67: Shorting Opportunity
- Consider a short position if the Type2 Bearish Shark Pattern completes at 150.67.
- This approach factors in the possibility of Fed rate cuts in June, potentially influencing a bearish move.
As a trader, it's essential to weigh the conflicting signals and align your strategy with your overarching market outlook. Feel free to share your preferences and insights on these setups.
Science of Trading ApproachToday, I'm excited to share a detailed approach for trading GBPUSD. If you're considering a short position, here's a comprehensive strategy:
1. 1-Hourly Chart: Shark Patterns at 1.2676
- Wait for Shark Patterns to complete at 1.2676 on the 1-hourly chart.
- Look for a trading combo within the chart when the market retests the Trendline Break (red line).
- Ensure the market doesn't violate the trendline during this process.
2. 4-Hourly Chart: Bearish Gartley Pattern at 1.2725
- The ideal scenario is for the Bearish Gartley Pattern to complete at 1.2725 on the 4-hourly chart.
- Aim for completion before Monday, March 4, 2024, by 5 pm. Patterns completing after this time are considered disqualified.
This Science of Trading approach allows for a meticulous analysis and synchronization of different patterns across multiple timeframes. It provides a well-defined strategy for traders looking to short GBPUSD.
Feel free to share your thoughts and insights. Are you considering a similar approach or have different plans for GBPUSD?
For a visual representation, please refer to the chart link in the TradingView post.

EURUSD Type2 Bullish Shark Pattern - Two-Trade StrategyI'm pleased to share an update on the EURUSD Type2 Bullish Shark Pattern trade. If you've been following my TradingView post, you might have already profited from the first target, and now we're looking at a potential second target.
Here's the current strategy:
- First Target : Already Profited
- Second Target: Awaiting Fulfillment
In the event of a retracement to 1.0815, I am considering engaging in an additional long position.
This strategy involves a Double Bottom retest trade. Essentially, if the market retraces and reaches 1.0815, I'll enter another long position.
This way, if the market moves in my favor, I'll have two trades in profit. On the flip side, if the market goes against me, I'll have one trade incurring losses.
Feel free to share your thoughts and trade plans for EURUSD. Are you considering a similar two-trade strategy or have other plans in mind?
For a visual representation, please refer to the chart link in the TradingView post.

FILECOINFILUSDT trading pair has now managed to break through resistance for one year and it looks like it will make a neckline, like a shark pattern. After the price is reached, there will be a decline and there will be an opportunity to buy back.

AUDIO with the sharkAUDIOUSD with the shark harmonic, creating a higher low, and currently on breakout watch.
Keep the stop loss in place, take some profit at each target, and once target 1 is achieved, move your stop loss up to the entry level. Stop loss is triggered upon DAILY candle close confirmation.

ORDI LONG - Bullish Shark Harmonic Pattern#ORDI
- Bullish Shark harmonic pattern
- 1h Hidden Bull Divergence (X-B)
- 1h Bear Divergence (A-C)
Entry: 58.616 - 56.474
Stop: 56.463
TP: High of C
Warning: The formation is considered canceled If the price surpasses $70,544

RUNE ANALYSIS🔮 #RUNE Analysis - Support and Resistance 🚀🚀
💲💲 #RUNE is trading around its major resistance zone and #RUNE is trying to retest the zone. If #RUNE breakout and closes above the resistance zone and sustain the higher price, it will indicate a good bullish move and will achieve the next target easily📈
🔖 Current Price: $5.387
⏳️ Target Price: $6.065
⁉️ What to do?
- We have marked crucial levels in the chart . We can trade according to the chart and make some profits. 🚀💸
#RUNE #Cryptocurrency #Support #Resistance #DYOR

Bullish Shark PatternI'm closely monitoring GBPJPY for a potential buying opportunity based on the Bullish Shark Pattern. Here are the details:
- Setup: Bullish Shark Pattern
- Completion Level: 189.06
Given the recent decline in the JPY and the resulting upward movement in JPY pairs, I'm anticipating a bullish scenario on GBPJPY.
The completion of the Bullish Shark Pattern at 189.06 is the level I'm eyeing for a buying opportunity.
Feel free to share your insights and trading plans for GBPJPY. Are you considering a long or short position?

USDJPY Trading Plan: Bullish Shark PatternI'm maintaining my bullish outlook on USDJPY and currently eyeing a potential buying opportunity. Here are the details:
- Setup: Bullish Shark Pattern
- Completion Level: 150.09
It's crucial to note the presence of the Type2 Bearish Fib-3 Bat on USDJPY's Weekly Chart. While it signals caution, my focus is on the bullish scenario with the completion of the Bullish Shark Pattern at 150.09.
Feel free to share your thoughts and trading plans for USDJPY. Are you considering a long or short position?
Check the chart link within the TradingView post for a visual representation.

EURUSD Trading Plan: Bearish Shark Pattern RetestIn our EURUSD analysis, we are identifying a potential shorting opportunity for counter-trend traders. Here are the details:
1. Setup: Bearish Shark Pattern Retest
2. Timeframe: 1-Hourly Chart
3. Key Levels:
- Retest Level 1: 1.0852
- Retest Level 2: 1.0874
The Weekly Chart suggests a weaker bull trading setup, and on the 4-hourly chart, a bearish trend is noticeable. The Bearish Shark Pattern on the 1-hourly chart provides a counter-trend trading opportunity.
Feel free to share your thoughts on which retest level you find more suitable for a shorting opportunity.

Bounce Token (AUCTION) completed a setup for upto 34.50% pumpHi dear members, hope you are well and welcome to the new update on Bounce Token (AUCTION).
Recently we caught almost 29% pump of AUCTION as below:
Now on a daily time frame, AUCTION has formed a bullish Shark move for the next pump.
Note: Above idea is for educational purpose only. It is advised to diversify and strictly follow the stop loss, and don't get stuck with trade.

Stick, Twist or Fold?You hedged Long from 1.07935 (profits taken, risk free).
With a short (entry 1.08806) twice the size of your remaining long.
WWYD?
A) Leave as is - That's a great carry into the weekend.
B) Cash out the short - We bottoming out.
C) Close the long - Sunday open, shit's gapping down hard.

NZDJPY Trading Plan: Bearish Shark Pattern RetestIn our NZDJPY analysis, we are observing a potential shorting opportunity on the 1-hourly chart. Here are the details:
1. Setup: Bearish Shark Pattern Retest
2. Timeframe: 1-Hourly Chart
3. Key Level:
- Entry Point: Bearish Shark Pattern Retest at 92.07
The Daily Chart reveals a Bearish Gartley Pattern at X with RSI Divergence, suggesting a potential bearish move. On the 1-hourly chart, the Bearish Shark Pattern provides an additional layer of confirmation for a shorting opportunity.
Feel free to share your insights, and let's navigate this market together.

EURUSD Trading Plan: Bearish Shark Pattern on 4-Hourly ChartLet's delve into the EURUSD trading plan for the upcoming period.
The weekly chart suggests a weaker bull trading setup, signalling a bullish trend with some weakening.
However, the four-hour chart paints a different picture, displaying a bearish trend.
Here's the comprehensive trading plan:
1. Weekly Chart: Indicates a weaker bull trend.
2. 4-Hour Chart: A Bearish Shark Pattern is anticipated to complete within the sell zone at 1.0874, presenting a potential shorting opportunity.
Given the bearish trend identified on the four-hour chart, the focus will be on the Bearish Shark Pattern for a potential short trade.
Share your thoughts and insights on this trade plan!

Asian panits bearish PE2100Asian paints showing weakens
Option trader take PE call in ACC to HH and LL strategy and Target PE2100
For more chart analysis comment me in this post
