Bullish Shark on GBPUSDI'm much more comfortable trading the Forex Pair then Oil, where comes the Bullish Shark retest on the GBPUSD on the 8-range bar for a buying opportunity.
I might even keep my second target open, as I'd the bullish bias on the GBPUSD.
What's your thoughts on GBPUSD?
Sharkpatterns

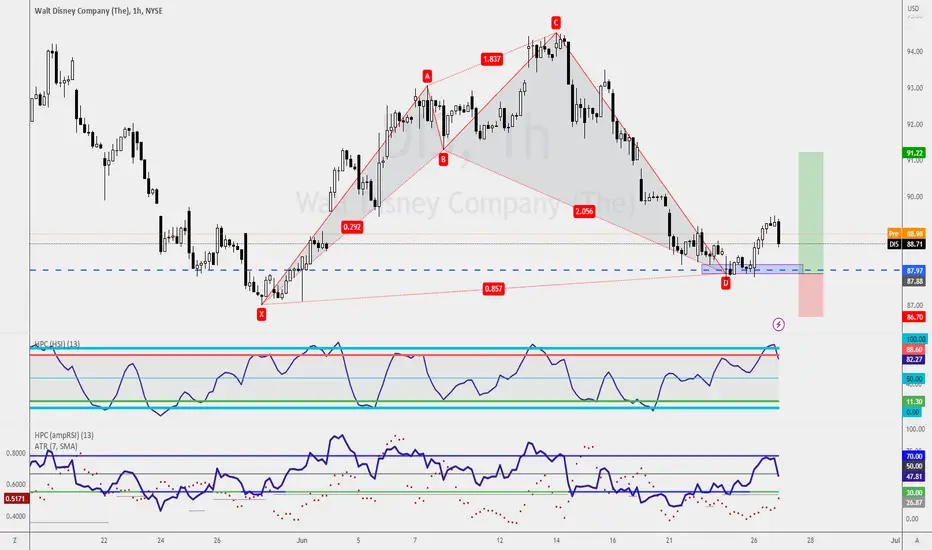
I might want to own DisneyI might want to own Disney as my first stock. Now this is why!
Are you aware that Netflix stopped allowing users of different IPs to log in and watch the show, even when you had a premium subscription?
That means, even if you are from the same household, but one of you has an extended overseas trip, he could be booted out after he has "used up" the overseas button.
In some countries, the subscription fee of Disney is 3 times cheaper than Netflix. I'm unsure if that's what Disney offers for the first-time sign-up client, but it is worth noticing.
Disney owns some of the biggest brands, such as Marvel, Starwars, 20th Fox Century Studio, and more.
Although I'm not optimistic about some of the new Marvel series, there is so much more potential with Disney.
So when the Bullish Shark Pattern has confirmed at $87.90, it is great news for me to own my first stock and it might be Disney.
What's your take on this?
Correlation Matters No More
For the longest time, I've been saying that the correlations between the currency pairs have been weakened.
Traders have asked me why I have NZDJPY and NZDUSD in my portfolio. Doesn't it move in the same direction?
Over the years, these correlated pairs move pretty differently. And recently, the WTI and Gold have no longer moved in an inverse relationship.
So yeah, I'm treating them as their own.
Although both the 4-hourly and 1-hourly charts show buying opportunities through a potential Bullish Bat Pattern and a Bullish Shark Pattern, I'm more interested in waiting for a shorting opportunity on the 5-0 Pattern.
What's your take on the NZDUSD?

Trend Doesn't Matter!!I'm not saying that trend isn't important, but on this particular trade, it is NOT.
And that is because the NZDJPY is on a sideway market, and it didn't show a particular prominent sign.
My top focus is to wait for a shorting opportunity on the Bearish Crab Pattern that shows up on the daily chart. It is common for crab patterns to have their retest before the actual move.
Why this Crab Pattern?
It coincides with the Bearish Shark Pattern on the Weekly Chart.
If you want a buying opportunity, a magic candle confirmation 87.21 on the 1-hourly chart will allow you to engage the trade. Gartley Pattern is the first pattern that was discovered. What makes this Bullish Gartley Pattern interesting is that the completion falls on the Key Support Level on the Daily Chart, marked as the Blue Horizontal Line, indicating a Key Support Level.
This is both amazing and disturbing to see for both traders.
What's your take on the NZDJPY?

This is why Most Traders Lose MoneyLook at the higher timeframe(right), on the Weekly chart, and have your focus on the retest of the previous high. Not only it fails to close above the previous high, but it also has an RSI Divergence. On the bigger picture, EURUSD is on a Bearish Move.
I'm not saying you can't make money if you have bought EURUSD, but you shouldn't stretch your target when you are counter-trend trading and you won't know that if you didn't get the trend right.
On the lower timeframe, the 4-hourly chart, Trend Traders could wait for a retest of the Key Resistance Level at 1.0912 and wait for a Magic Candle Confirmation to engage the trade.
Counter-Trend Traders could wait for the completion of the Bullish Shark Pattern, followed by a Magic Candle Confirmation at 1.0707 before heading for a buying opportunity.
What's your trade plan for the week? Comment down below.

Finally!! An OpportunityThis is not a lot, but it is something, at least the second target has a good Profit Factor. I'd engaged the Bullish Shark Pattern and if you have noticed, the market is on a sideway movement, which is great for counter-trend traders.

Support BrokenIf you had read last week's analysis, you would know I've been waiting for a buying opportunity on Major Support.
Now that the Support has broken, I'll be waiting for a shorting opportunity, and what is needed is a retest of previous support(1.3305), which turns resistant.
A better way for me to engage the shorting opportunity is to wait for the Bearish Shark Pattern that completes at 1.3321.
What's your trade plan for the USDCAD?

Expansion PatternsAUDCAD has a unique setup that I'd not seen before. We have shark patterns from the Weekly chart to the 1-hourly chart.
This is a clear sign of sideway increase volatility, a situation I DID NOT trade when I started trading 18years ago, not until I found the Shark Pattern trading strategy 12years ago.
I'm more comfortable waiting for the Shark Pattern form up on the 1-hourly chart at 0.8902. Not only because it was the lowest timeframe, which means lesser initial risk on the trade and the completion of the Shark Pattern lands on the Key Support level on the 1-hourly chart.

Expect a pullbackOverall Analysis on EURUSD is still on a Bearish Move; however, this week, I expect a substantial pullback(bullish movement on the EURUSD off the lower timeframe.
If you are looking for a buying opportunity, wait for the Bullish 5-0 Pattern to be completed as early as 1.0723.

Counter-Trend Trading opportunityLow Risk, Good Return Trade
A Bearish Shark Pattern has shown up on the AUDUSD 4-hourly chart. As it is not the best trading setup but the second target produces a healthy Profit Factor of 2.
I've shorted the Shark Pattern as it coincides with the 1-hourly chart 3 drive formula.
This is possible because we use our in-house A.P.E framework and this is known as the combo trade.

BTC Expects a Tiny FUDThe pressure of the SEC on Binance and Coinbase was not only badly received in the markets, but also stopped my bull analysis and we had to close the position at a loss.
The first thing I saw when I looked at the chart from afar before opening a new position was that Bitcoin was on the eve of creating a second shark pattern.
Bitcoin, which repeats the pattern it made in August 2021, can move towards the $18400 target if this upward trend is broken.
Even though I see no reason not to make this move when an extraordinary FUD is swirling in the markets and fear prevails, I still keep my positive mindset and will start sharing pessimistic scenarios only if it retests after breaking the resistance.
Even if uptrend continues, this risk seems to continue as long as the $30700 level is not exceeded.

Low Risk, High Return TradeA combo trade, this is what I call it.
A Bearish Shark Pattern appears on the M15 chart coinciding with the 1-hourly chart Wedge Pattern with a retest of resistance, allowing me to engage the trade base on the M15 chart but allow an extended target on the 1-hourly chart.
As good as it sounds, I'll be placing my stop loss as per usual and will not overtrade this.

A simple trading strategyEarning money can be as simple as waiting for the market to pull back to 0.6631 and waiting for a shorting opportunity.
Trading could be easy; what's not easy for most people is having the patience to wait for the trading opportunity.
They like to get involved in all moves. Mature traders will only wait for the best trading strategy and not get involve in every candlesticks move.
What kind of traders would you be?
Comment down below!!

Trading within the 2 zonesThis could be interesting!
If you are looking to short, you have a Bearish Shark Pattern that has completed at 174.50, you could wait for a pull back off the lower timeframe, like the 15-minutes chart or the 8-range bar chart for a shorting opportunity.
Alternatively, you could wait for a buying opportunity on the 5-0pattern a 100pips later at 173.50.
Which trade would you take? And why?
comment down below.

Perfect automated detection of Shark & Nenstar PRZ - ShortA bearish-type Shark pattern occurred.
If the price rises to 1.6938, a bearish-type Nenstar pattern could occur.
Also on the weekly chart, bearish-type Shark pattern is occurring.
Short after seeing the rebound.
*Harmonic patterns are automatically detected using the indicators below.
- Harmonic auto-detect PRO

The Oldest Pair I've TradedDo you still remember those unforgettable moments when I first embarked on my trading journey with GBPJPY? It holds a special place in my heart as the very first pair I traded, and I stuck with it through the ups and downs until the spread for GBPJPY skyrocketed to 14 pips for an extended period. Oh, the memories!
Presently, GBPJPY finds itself in a captivating sideways movement, offering ample opportunities for those employing the support and resistance trading strategy. It's a perfect scenario for executing the age-old principle of buying low and selling high, or even exploring the realm of harmonic patterns.
Personally, I'm eagerly awaiting the completion of a bearish shark pattern at 173.23, signaling a potential shorting opportunity that aligns with my analysis.
Alternatively, you can choose to navigate the daily chart's defined zone, indicated by the red resistance line at 172.05 and the blue support line at 167.48. Within this trading range lies an enticing profit potential of 457 pips just waiting to be tapped into.
Join me as we delve into the timeless allure of GBPJPY and unleash the vast possibilities it holds for traders like us.

It's NO SECRET, I'm shorting AdidasIt's no secret that I've been looking to short Adidas for weeks before the Bearish Bat Pattern show up.
As a trader, I love to wait for the precise price with candlesticks confirmation before engaging my trade; hence I miss the first opportunity.
And that's ok!
In trading, I have this philosophy that is better to miss a trade than to engage in a trade at a price of disadvantage.
So here I am, trading for the past 18 years.
At this moment, I'm waiting for the Bearish Shark Pattern to form up on the 8 range bar chart to give me a second chance entry to get on this ride.

Effortless trade execution: seize the opportunity with easeAs a trader, I prefer to search for trades that display a distinct direction on the higher timeframe and then hone in on that direction on the lower timeframe.
However, I understand that some traders prefer to jump on opportunities as they arise.
This week, the AUDUSD has presented us with such an opportunity, as the Bullish Shark Pattern trading setup has completed at 0.6637.
The next step is to wait for a confirmation of a candlestick pattern on the 4-hourly chart before entering the buy position. This approach provides a clear plan and enables us to make informed decisions based on sound trading principles.

My Bullish Bias RemainsUSDJPY Shorting Opportunity Looming, But My Bullish Bias Remains Strong
In the midst of a Type 2 Bearish Bat Pattern on the daily chart and a Bearish Shark Pattern on the 1-hourly chart, traders may be eyeing a shorting opportunity for the USDJPY. However, my bullish bias on this currency pair remains steadfast.
Rather than jumping on the bearish bandwagon, I am patiently waiting for a prime buying opportunity on the USDJPY. I'm closely monitoring a Bullish 5-0 pattern that could potentially complete at 134.71, presenting an ideal entry point for a long position. Stay tuned for further updates on this developing trade opportunity.

Unlocking Profit Potential: Why I'm Holding Out for a Prime BuyiThis week, an opportunity has presented itself for a potential buying position on the GBPUSD pair. Two prominent trading setups - the Bullish Shark Pattern and the AB=CD pattern - have emerged, signalling a potential bullish trend.
While I hold a bullish bias due to a previous break and close above resistance on the weekly chart, I exercise caution and wait for confirmation from candlestick patterns before entering the trade.
This strategic approach ensures that I make informed and calculated trading decisions.

Second Chance to ShortTraders who missed out on the previous shorting opportunity may have a second chance at hand with the potential setup of Type2 Bearish Shark and Type2 Bearish Deep Gartley pattern in the market.
However, it is important to note that one of the downsides of Type2 setup is its unpredictability, and it may not always work.
To mitigate the risk, it is crucial to exercise patience and wait for a candlestick pattern confirmation before engaging in the trade.
Rushing into the market aggressively without proper confirmation could lead to unwanted consequences.

Executing Mid to Long-Term Short Position on This TradePatiently waiting for a prime shorting opportunity on EURUSD as the market struggles to breach the crucial level of 1.1093 on the weekly chart.
My strategy involves utilizing the Bearish Shark Pattern setup, which shows completion at 1.1097 on the 1-hourly chart. With a calculated approach and keen attention to market behaviour, I am poised to execute a confident and informed trade decision.

Profitable Shorting Opportunity Presenting ItselfWithin the consolidation zone, a bearish shark pattern has emerged, and with the presence of a magic candle, it presents an opportunity for an aggressive trade entry.
The consolidation phase offers a prime opportunity to identify harmonic patterns.
