Shiba Inu Whales Amass 4.66 Trillion SHIB As Price Falls 12%BINANCE:SHIBUSDT price is currently trading at $0.00001353, down 11.5% over the past 24 hours . The altcoin is holding above the support level of $0.00001368.
The large holders' netflow for BINANCE:SHIBUSDT has recently spiked, reaching a two-month high. In the last 24 hours, 4.66 trillion SHIB were accumulated by addresses holding at least 0.1% of the circulating supply. These whales, who have collectively invested $63.7 million , are betting on a price rebound.
A successful bounce off $0.00001317 would likely pave the way for further price appreciation, potentially pushing BINANCE:SHIBUSDT to $0.00001553 . Securing this level as support could mark a recovery of today’s losses and initiate a new uptrend, provided the broader market conditions remain favorable.
On the other hand, if BINANCE:SHIBUSDT falls below the support of $0.00001317 due to profit-taking, the meme coin could slip to $0.00001188 . This would invalidate the bullish thesis and further reduce investor confidence. The next few days will be crucial in determining if SHIB can maintain its current support levels .
Shib

$PENGU Penguin consolidation at the moment.As long as CSECY:PENGU remains between .039 and .035 I consider it in consolidation. Breaks above or below these levels should see the targets posted.

$SHIB Ready to Move?CRYPTOCAP:SHIB has printed confirmed weekly bullish divergence in RSI and is now attempting to overcome the weekly 200EMA resistance.
A High Volume Node lies just above but a close above this will signal a bullish trend ready to move the initial target of the weekly pivot point followed by the 0.0003579 High Volume Node.
Price completed its retracement to the 'alt-coin' golden pocket 0.786 Fibonacci retracement.
Bearish divergence is currently growing on the weekly RSI but will be diverted with a thrust high!
Is it MEME season? CRYPTOCAP:DOGE also looks ready to go!
Safe trading

$PENGU Pudgy PenguinsWithout a breakout to the DOWNside, CSECY:PENGU is still looking bullish for at least a hit to .04.

SHIB could explode soon.Multi year accumulation, crossing a significant fib-time pivot, similar set up to XRP.. could follow DOGE once it takes the lead as a catch up trade and rip..
Technical breakout: Above 200-day MA + golden cross formation
Volume surge: Social + trading volume spiking, driving demand
Ecosystem catalysts: Shibarium L2, metaverse progress, aggressive token burns cutting supply
Macro tailwinds: ETH rally + broad altcoin strength
I think it could be one of the leaders before capital rotates into the lower caps
SHIBUSDT🕯 The key resistance level, identified as the best resistance for a break and pump, stands at 0.0000135, with a potential price increase to 0.00001567 if breached, serving as the next target (Pullback level). On the support side, the main level is observed at 0.0000115, and should the price fall below this, it may decline further to the lower Major Level of 0.0000100.
🔽 Resistances:
Main resistance level: 0.0000135 (potential break for pump)
Next target (Pullback level): 0.00001567
🔼 Supports:
Main support level: 0.0000115
Lower level (Major Level): 0.0000100
⚠️Contorl Risk management for trades.

SHIBUSDT 4H Potential 10% Drop – Wave 4 Incoming? Hey traders,
On the 4H timeframe, SHIBUSDT seems to be completing Wave III of a classic 5-wave impulse structure. We can clearly identify:
- Wave I and II behind us
- Wave III topped out recently with a strong push upward
- Now expecting a Wave IV correction to unfold
What supports this setup:
- Wave II was an irregular correction (note how Wave B pushed above Wave A).
- According to Elliott Wave alternation rules, if Wave II is complex/irregular, Wave IV is likely to be a simple ZigZag (ABC) correction.
- Zigzags are typically sharp and quick, which fits the momentum of the current market structure.
🕵️♂️ What’s next?
- The potential correction target lies in the marked rectangle zone (around -10% to -13% drop
from the recent top).
- On lower timeframes (like 7min or 10min), we’ll be watching for a support break to confirm
the start of Wave IV.
- If the support is broken with confirmation, that may offer an opportunity to enter a short
position — as long as it fits within the personal risk parameters.
📌 Disclaimer: This is not financial advice. Trading is risky — always manage your risk, do your
own research, confirm your setups, and never blindly follow others. Stay safe and smart.
🧠 Are you planning to catch this correction? Or waiting for the final Wave V? Let me know in the comments 👇

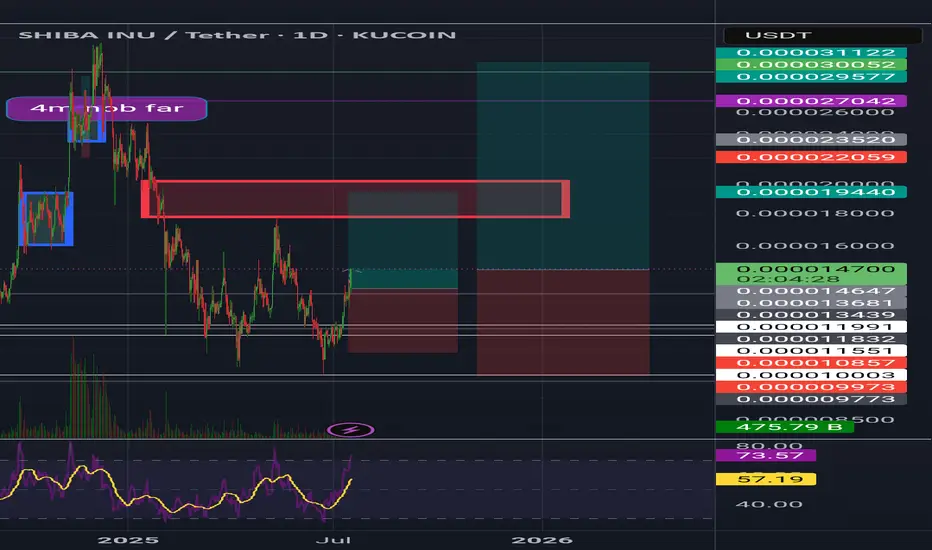
Shiba inuShib usdt Daily analysis
Time frame daily
First target = 0 00001944$
Risk rewards ratio =2 👈👌
Second target = 0.00003
Risk rewards ratio >3.5 👈 👌
The red box that you can see on the screen is very important resistance area.
If Shiba breaks it strongly, second target will be reach
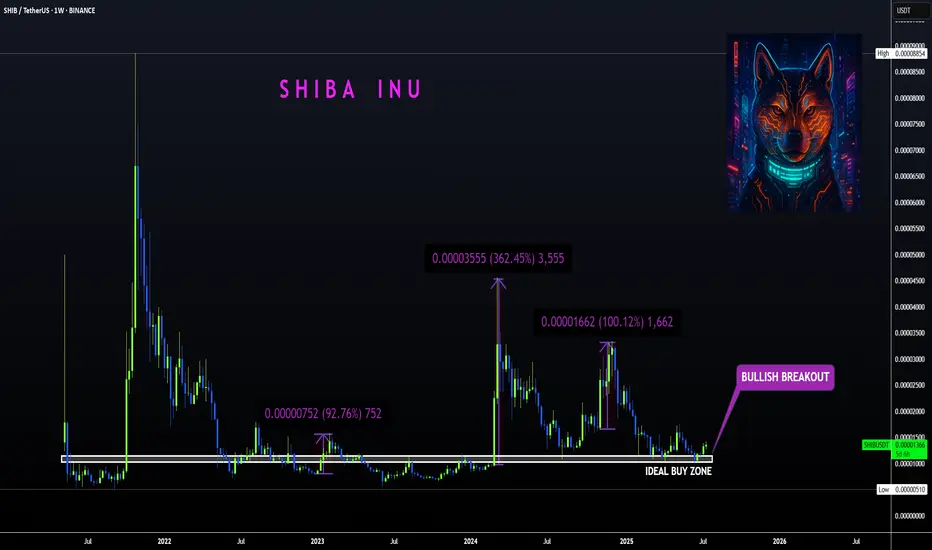
SHIBA | Bullish Breakout ABOVE Ideal Buy ZoneBINANCE:SHIBUSDT
Shiba is know to make big increases in short periods of time... that's why we love it!
The tricky thing about SHIBA is that the pumps can be unpredictable so the best way to ensure a position is to buy as low as possible to the ideal buy zone.
In the weekly timeframe, the technical indicators are not quite bullish yet. The moving averages is still above the price, meaning the bulls have yet to take full control of the price in lower timeframes.
The same can be said for the daily, although we are seeing progress as the 200d moving averages have been reclaimed:
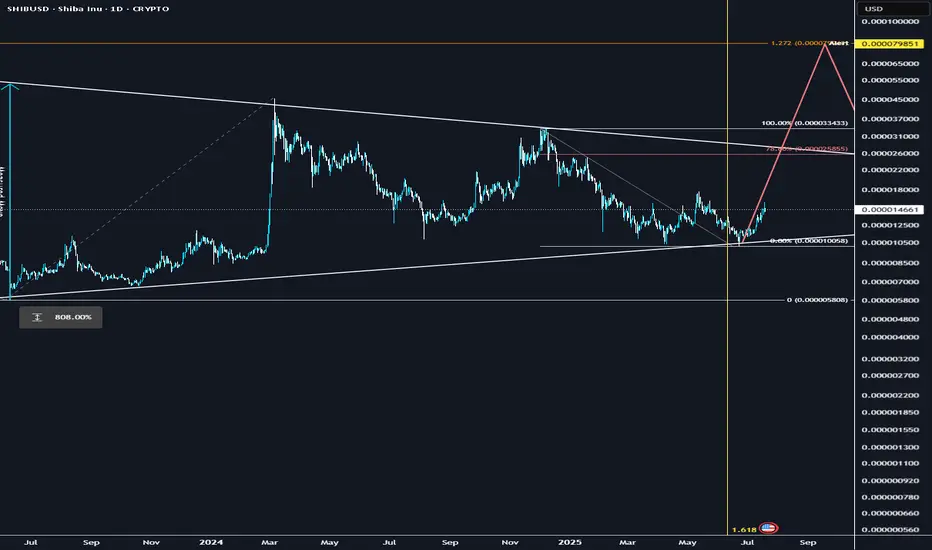
Shiba Inu Still Early Massive Wave yet Bullish —1,558% PPThe blue pattern on the chart is an analog of the purple pattern but bigger.
It is still early for Shiba Inu (SHIBUSDT) because the action is happening below MA200. The long-term bullish bias is only confirmed once the action moves and closes above this level.
This shouldn't be considered bearish because we have a clear higher low based on the two different consolidation patterns. The purple one produced the main low and the blue one the higher low. Multiple higher lows.
Lows—support confirmed—in August 2024, April & June this year. And that's it. This weekly candle is now full green and everything is about to turn positive crazy. Shiba Inu has been bearish since March 2024.
There was some bullish action in November 2024 but it ended as a lower high, what a bummer. All this time with no new highs, no major growth. This cycle is coming to an end. The null cycle, the boring cycle, the little-to-no-profits cycle is over... That's awesome. What does Shiba Inu has in store for us?
A new all-time high to start. Maximum growth. Euphoria, higher prices; growth. It will be awesome.
I am giving you all of the targets for Shiba Inu (SHIBUSDT). The highest one is 0.000220491. Total profits potential reach 1,558% from current price.
There are two resistance levels of interest below the previous ATH: 0.000067612 & 0.000057511.
Minimum new 2025 all-time high we will go for 0.000103188 for 676%.
You can find more numbers and targets by doing a close-up on the chart.
I hope you find this information useful.
Your support is appreciated.
Namaste.

MOONPIG - Solana Meme Coin Ready to Rocket in the Next Bull RunTechnical Analysis: Bullish Signals Flashing Bright:
The MOONPIG/USDT chart is painting a bullish picture. After a sharp retracement from its all-time high near a $125M market cap, the token has found solid support around $0.0045 and is now trading at $0.0052, showing signs of a reversal. Here’s what the charts tell us:
Breakout Momentum: On the 6-hour chart, $MOONPIG recently broke above a key downtrend line, signaling a shift from bearish to bullish momentum. A potential double bottom pattern suggests a continuation toward $0.008 or higher.
Support and Resistance: The $0.0045 level has held as strong support, with resistance looming near $0.0075 (a recent high). A clean break above $0.0075 could open the door to $0.01 or beyond, aligning with the 1.618 Fibonacci extension from the recent swing low.
With Bitcoin rallying and altcoins showing signs of life, $MOONPIG’s technical setup screams opportunity for traders eyeing a breakout.
Fundamentals:
Community Power: With over 18,000 holders as of early June 2025, $MOONPIG boasts a fiercely loyal community. Unlike many meme coins reliant on paid shills, its growth is organic, driven by retail investors who love its “normie-friendly” branding. Posts on X highlight strong morale, with users like JamesWynnReal calling it a “raging bull flag” poised for a $50M–$100M market cap.
Exchange Listings: Recent listings on HTX Global, MEXC, and LBank have boosted liquidity and visibility, with more exchanges reportedly in talks. These listings are a catalyst for retail FOMO, as seen in the $7M+ on-chain trading volume.
Solana’s Hot Streak: Solana’s fast, low-cost blockchain is the perfect home for meme coins like $MOONPIG. With Solana’s ecosystem thriving and retail interest in tokens like $POPCAT and SEED_WANDERIN_JIMZIP900:WIF soaring, $MOONPIG is well-positioned to ride the wave of altseason capital inflows.
Market Timing: As Bitcoin nears new highs and market sentiment turns bullish, low-cap meme coins historically see explosive gains.

SHIBA +100%?? | BEST Buy OPPORTUNITYSHIBA has been in a downtrend for many weeks.
From here, upside is likely - especially if we look at the consecutive amount of "red" weekly candles (blue on this chart).
A 40% bounce zone is easily possible from this zone. Even at modest, 20% would be ideal:
____________
BYBIT:SHIBUSDT

SHIBUSDT: Price Weakness & Your Next Short OpportunityMy focus is on SHIBUSDT, and the picture is clear: price is weak. This isn't a market where buyers are proving their strength; in fact, the opposite is true.
Most traders are confused by volatility. But you need to see the real opportunity. My analysis points to this: both red boxes I've marked on the chart are prime zones for short opportunities. They represent powerful selling regions.
Here's why, and your plan for action:
Red Box Power: These zones are where sellers are truly in control. I'm actively looking for price to engage with these areas.
Green Box Uncertainty: As for the green box, its strength is questionable. I'm not confident it will hold as reliable support for a bullish move, reinforcing my overall bearish view.
Confirm the Downside: Your decisive move comes with confirmation:
Volume Footprint: I'll be scrutinizing the volume footprint to see clear distribution from sellers.
CDV (Cumulative Delta Volume): Look for CDV to turn deeply negative, affirming seller dominance.
LTF Breakdowns: On the low timeframes (LTF), demand concrete breakdowns. Price must fail, retest the red boxes as resistance, and then continue lower. This is your undeniable signal.
My general bias remains bearish. I only trade assets showing a sudden increase in volume, and while this is a short setup, the volume dynamics confirming weakness are what I'm seeking.
Keep a sharp eye on those red boxes. If these confirmations line up, you'll uncover precise, high-probability short entries. This is where smart, confirmed decisions are made.
📌I keep my charts clean and simple because I believe clarity leads to better decisions.
📌My approach is built on years of experience and a solid track record. I don’t claim to know it all but I’m confident in my ability to spot high-probability setups.
📌If you would like to learn how to use the heatmap, cumulative volume delta and volume footprint techniques that I use below to determine very accurate demand regions, you can send me a private message. I help anyone who wants it completely free of charge.
🔑I have a long list of my proven technique below:
🎯 ZENUSDT.P: Patience & Profitability | %230 Reaction from the Sniper Entry
🐶 DOGEUSDT.P: Next Move
🎨 RENDERUSDT.P: Opportunity of the Month
💎 ETHUSDT.P: Where to Retrace
🟢 BNBUSDT.P: Potential Surge
📊 BTC Dominance: Reaction Zone
🌊 WAVESUSDT.P: Demand Zone Potential
🟣 UNIUSDT.P: Long-Term Trade
🔵 XRPUSDT.P: Entry Zones
🔗 LINKUSDT.P: Follow The River
📈 BTCUSDT.P: Two Key Demand Zones
🟩 POLUSDT: Bullish Momentum
🌟 PENDLEUSDT.P: Where Opportunity Meets Precision
🔥 BTCUSDT.P: Liquidation of Highly Leveraged Longs
🌊 SOLUSDT.P: SOL's Dip - Your Opportunity
🐸 1000PEPEUSDT.P: Prime Bounce Zone Unlocked
🚀 ETHUSDT.P: Set to Explode - Don't Miss This Game Changer
🤖 IQUSDT: Smart Plan
⚡️ PONDUSDT: A Trade Not Taken Is Better Than a Losing One
💼 STMXUSDT: 2 Buying Areas
🐢 TURBOUSDT: Buy Zones and Buyer Presence
🌍 ICPUSDT.P: Massive Upside Potential | Check the Trade Update For Seeing Results
🟠 IDEXUSDT: Spot Buy Area | %26 Profit if You Trade with MSB
📌 USUALUSDT: Buyers Are Active + %70 Profit in Total
🌟 FORTHUSDT: Sniper Entry +%26 Reaction
🐳 QKCUSDT: Sniper Entry +%57 Reaction
📊 BTC.D: Retest of Key Area Highly Likely
📊 XNOUSDT %80 Reaction with a Simple Blue Box!
📊 BELUSDT Amazing %120 Reaction!
📊 Simple Red Box, Extraordinary Results
📊 TIAUSDT | Still No Buyers—Maintaining a Bearish Outlook
📊 OGNUSDT | One of Today’s Highest Volume Gainers – +32.44%
📊 TRXUSDT - I Do My Thing Again
📊 FLOKIUSDT - +%100 From Blue Box!
📊 SFP/USDT - Perfect Entry %80 Profit!
📊 AAVEUSDT - WE DID IT AGAIN!
I stopped adding to the list because it's kinda tiring to add 5-10 charts in every move but you can check my profile and see that it goes on..

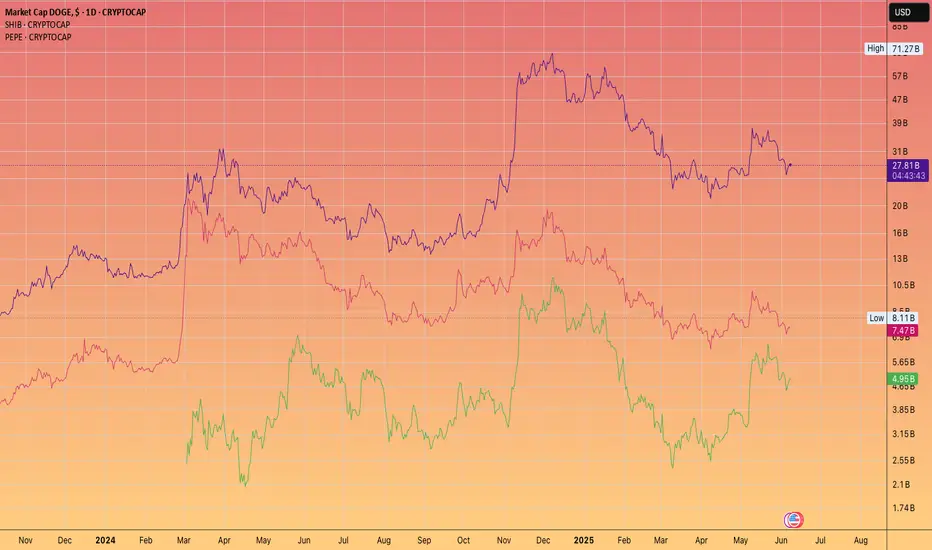
Pepe is going flip SHIB. But can it catch Dogecoin?If Ethereum were to smash $10k
Then it has a genuine chance IMHO
We shall be watching and tracking this as the cycle reaches it's mania phase!
SHIB/USDT Potential UpsidesHey Traders, in today's trading session we are monitoring SHIB/USDT for a buying opportunity around 0.00001420 zone, SHIB/USDT is trading in an uptrend and currently is in a correction phase in which it is approaching the trend at 0.00001420 support and resistance area.
Trade safe, Joe.

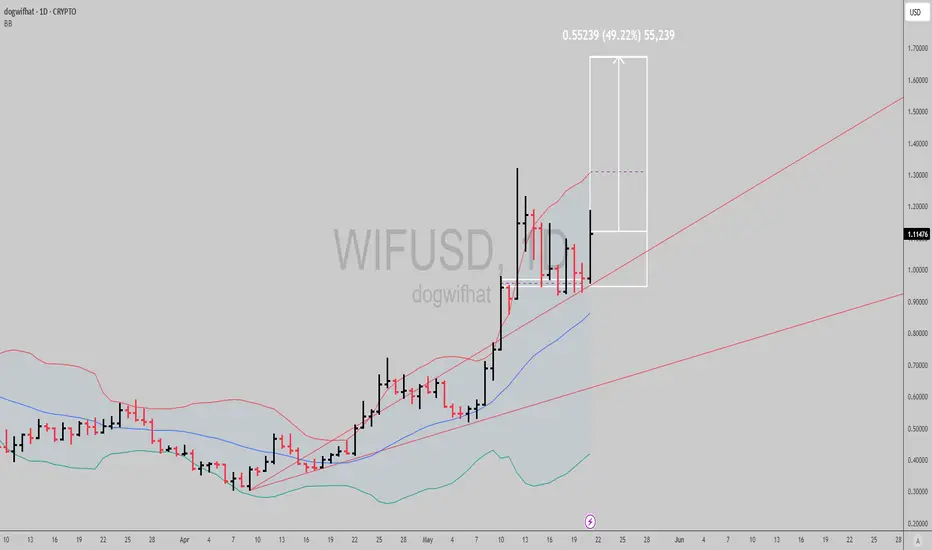
$WIF: Uptrend signal activeNice signal in SEED_WANDERIN_JIMZIP900:WIF here, the trend in the daily timeframe has been bullish since April 18th, and has been giving us multiple continuation signals to trade in and out, or scale in with low risk as we move the stop higher if playing it longer term.
If prices hold above recent lows, we can see a close to 50% run from here within a week give or take.
Best of luck!
Cheers,
Ivan Labrie.
$SHIBUSDT – Major Retest Holding!CRYPTOCAP:SHIB is retesting a key breakout zone after breaking through a long-term descending trendline + 200 EMA. The structure remains bullish with a clean higher-low forming at the confluence of support.
📊 Technical Breakdown:
Breakout from descending triangle
Bullish retest of trendline + 200 EMA
Price printing higher lows above key support
🎯 Targets:
TP1: 0.000015252
TP2: 0.000017091
TP3: 0.000018929
🛑 Stop-loss: 0.000013153
📍 Entry Zone: Around 0.000014785
If bulls hold this zone, SHIB could see continuation toward mid-May highs and beyond.

SHIB – Long Here, Aiming for 50% Upside
Time to go long on CRYPTOCAP:SHIB and ride this wave.
Doesn't look like it's going much lower—I was hoping to grab some a bit deeper into the green zone, but that might’ve been too picky.
Stepping in with a decent-sized position here. Will add more if it dips.
Planning to hold through June, market conditions permitting. First target: +50%.
BINANCE:SHIBUSDT

Consolidation Before the Next Big Move?The price is sitting close to a support level at $0.00001405, which has held strong lately. The Relative Strength Index (RSI) sits at 57, showing decent buying pressure but not overbought yet, while the 50-period moving average at $0.00001430 acts as a floor beneath the price. If SHIB breaks above $0.00001500 with confidence, it could climb toward $0.00001600. But if it falls below $0.00001405, the next stop might be $0.00001320.
What’s Driving SHIB Right NowOn the news front, Shiba Inu’s ecosystem is buzzing, especially with Shibarium, its layer-2 network, hitting over one billion transactions recently. Despite this milestone, SHIB’s price hasn’t taken off, likely due to a cooling crypto market and some investors cashing out after a May rally. Big players (whales) are stacking SHIB, with noticeable token inflows, and the burn rate is picking up, which could make SHIB rarer over time.

SHIB/USDTWe're seeing liquidity grabs followed by the start of a local bullish move.
Looking to enter long from the highlighted zone, but only if proper conditions and confirmations align.
🎯 Upside targets: 1765 – 1918 – 2496 points

SHIB New Update/Roadmap (3D)The correction for this coin started from the point where we placed the red arrow on the chart.
The price appears to be inside a Triangle or Diametric, nearing the end of wave D.
The green zone is a low-risk rebuy area.
There is a liquidity pool on the chart, which we expect to be swept soon.
Targets are marked on the chart.
A weekly candle close below the invalidation level will invalidate this analysis
For risk management, please don't forget stop loss and capital management
When we reach the first target, save some profit and then change the stop to entry
Comment if you have any questions
Thank You

SHIB to pop 400% very soon.SHIB appears poised for a potential breakout, mirroring XRP's historical price action. After consolidating for approximately 1,000 days, SHIB has reached a key Fibonacci time extension (1.618), a significant technical milestone often associated with trend reversals. The chart structure shows similarities to XRP before its major rally to previous highs, suggesting a possible repeat scenario.
On the daily timeframe, SHIB is forming an inverse head-and-shoulders pattern, a bullish reversal setup indicating potential upward momentum.
As a "forgotten" meme coin, SHIB could see renewed interest, especially with positive ecosystem developments like Shibarium upgrades, token burns, and new token launches (TREAT and SHI), which may act as fundamental triggers. The diminishing exchange supply and broader market sentiment (e.g., a Bitcoin super-cycle) could further support a rally, similar to XRP’s unexpected surge on positive news.

Could PEPE reach a staggering 3000X and hit a market cap of 69B...this year?
YES 69 BILLION Dollars for a Frog coin!
To assess the potential growth of a cryptocurrency, we first need to identify its all-time low price.
Coinpedia reports that PEPE's all-time low was $0.00000005514 on ETH via Uniswap on April 18, 2023, marking the lowest price recorded on a decentralized exchange.
For PEPE to achieve a 3000X increase, it would need to rise to $0.00016542 by December 31st.
Given its current price of $0.000014238, this represents an 11.5X increase from its present value.
With a total supply of 420.69 trillion tokens, reaching the target price would result in a market cap of $69.58 billion.
While this may seem ambitious for a memecoin lacking utility, the idea of hitting such a whimsical market cap is tempting.
I estimate the likelihood of this happening at around 2.5%.
(This scenario also suggests a reasonable portfolio allocation for those primarily holding #BTC and #ETH and I highly suggest rebalancing above 5%)
