✴️ Shiba Inu Major Bullish DevelopmentShiba Inu has been growing since late December, wait no, it has been trying to grow since June 2022 but each time it met EMA300 as resistance, a strong rejection happened.
In mid-August 2022 SHIBUSDT tried to move above EMA300 but only did so by a wick, a strong rejection happened and a multi-months long correction followed.
Late October 2022 the story repeats, a wick high that was rejected at EMA300.
Again, but this time 18-January SHIBUSDT faces resistance at EMA300, no rejection, it keeps battling with this level for weeks until finally yesterday EMA300 breaks, the bulls win.
A major development as EMA300 is the longest moving average we track and moving above this level confirms long-term growth.
Moving above MA200 opens the doors for long-term growth but above EMA300 this potential has been confirmed.
As this level is conquered Shiba Inu hits a multi-months high and is set to continue growing.
The next target as usual is mapped on the chart.
You can see the 'Related Ideas' below for previous predictions... They all hit.
Namaste.
Shib

$SHIB #SHIB | LTF LONGThe green box ($0.010885) is the optimal pullback zone.
I am optimistic until it closes below the recent swing low which is ($0.0104s).
Resistances can be seen in the chart.

ShibusdtRecently Takes Entry on Lower tfs running In very good profit
Now Testing daily Trendline Incase Of breakout Expecting Massive 100 to 120% Bulish Wave
Place Sl Below Last Swing Low Entry would Be Only Valid After Breakout

Ern Testing Critical Area Ern Range Getting Tighter Also Breaking out To The Upside
Incase Of Breakout Expecting 180% To 200% Bulish Move

SHIBUSDT heading for monthly resistance levelIt looks like for SHIB the upward path is clear till the next monthly resistance.

GST Long$GST Green Satoshi Token seems to have choose the path UP vs DOWN for now. It may just be bouncing the levels in the triangle. We shall see. If continues up, take profit at marked red circle. If no breakout, expect retrace and swing trading to bottom triangle trendline or buy area. The coin is quite unpredictable. But we do what we can. Lol.

Xvgusdt Breaks Key Resistance Descending Channel Breakout And Retest Has Already Done
Expecting 60 to 70% bulish Move

$SHIB outperforming $DOGE again$SHIB leapfrogging $DOGE again
#SHIB looks good & volume coming in
14 area is next
#Shibarium #ShibaArmy

SHIB🐕 breaking out once again? 2Wassup guys! This is a follow-up to my last SHIB idea where we had no trade in the end...
It's still the same song as we are knocking on the cyan channel upper edge (daily timeframe) again and again:
Price is consolidating right below the channel upper edge in form of symmetrical triangle which is usually continuation pattern. It seems to me that Shiba Inu could be ready to break up this triangle📐 and IF successful I think there is chance for run to 0.00001375. I'm setting the BUY STOP-LIMIT order to recent range high anticipating the triangle breakout. If you would like to see SHIB pumping, just smash the 🚀 button! 😀
ENTRY : local high @ 0.00001195
STOPLOSS (SL) : local low @ 0.00001129
TARGET : height of the triangle projected from midpoint of the local range (BUY STOP-LIMIT - SL) @ 0.00001375
REWARD RISK RATIO (RRR) : 2.7
INVALIDATION : when SL level hit
Check my other stuff in related ideas.
Please boost🚀, comment🗣️, follow me✒️, enjoy📺!
⚠️Disclaimer: I'm not financial advisor. This is not a financial advice. Do your own due dilingence.

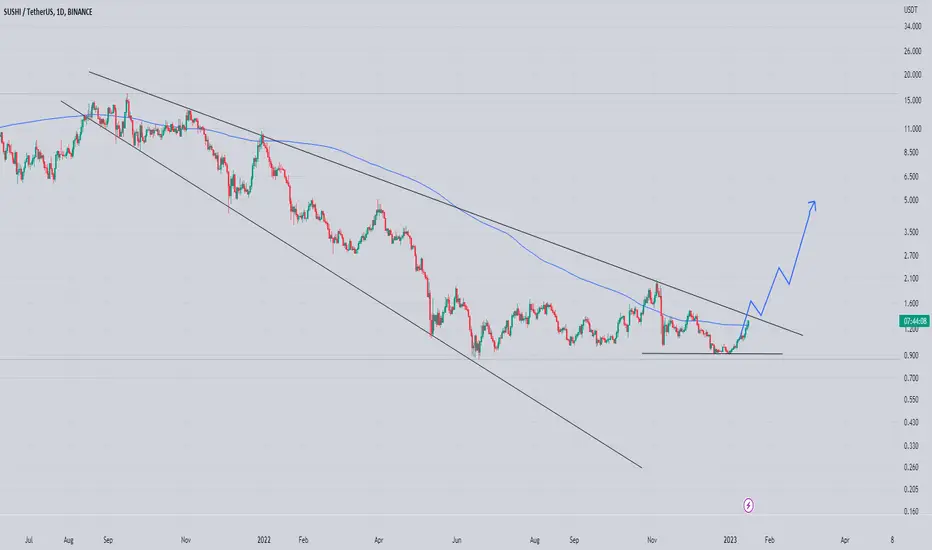
Sushiusdt Looks Bulishformed Desecnding Broadening Wedge Also Breaking 200Ma Too
Incase Of Wedge Breakout Expecting Move Towards As 1st 2$ My final Tp Would Be Around 4$ Once Breako9ut Confirmed can Place Stoploss Below Blackline
Entry Will Be Valid after confirmed Breakout
FILUSDT Formed Bulish Pennant Forming Bulish Pennant In H4 timeframe
Incase Of breakout Expecting 25 to 30% bulish move

🔥XRPvsSEC: WHEN WILL IT FINALLY END? LOCAL TARGETS FOR RIPPLE🔥 Hi friends! The big news for Ripple was realized today. SEC v. Ripple - all briefings are over, the motion has been filed, and the judge's decision is pending! Earlier, Ripple's lawyer said that he hoped for a judge's decision in June.
Finally, this story comes to an end. Hope the decision will help the crypto market to grow and develop.
Now we see how Ripple is squeezing to trendline and trying to break it. If the next candle after the breakout will close below the trendline, it will mean that bulls have no enough power to push price higher. In the case of a false breakout, I recommend you to open a short with sl above the highs.
📊 TRADING PLAN FOR XRP:
🔥false breakout of the $0.4 key level
🔥 volume growth
🔥 bearish BTC will push the alts lower
🚩 If XRP will continue to consolidate above the highs, it will be a strong bullish signal. It's a big chance to open a long with these targets..
✅ THE MAIN TARGETS FOR XRP:
1. $0.42- the key level
2. $0.45-0.46 - the value area
3. $0.51 - the key level
Friends, what decision should make the court about XRP case? Will XRP be recognized as fraudulent or will it be acquitted, which will save other similar projects like Ethereum? Write in the comments!
💻Friends, press the "boost"🚀 button, write comments and share with your friends - it will be the best THANK YOU.
P.S. Personally, I open an entry if the price shows it according to my strategy.
Always do your analysis before making a trade.


$DOGE weekly bull flag Plan is to piece out $DOGE lil by lil
Keep 1/2-1/4 LONG TERM
If $SHIB is lagging by decent amount roll it into that
#DOGE historically has led #SHIB in price action
BTW look at todays volume, not bad #dogearmy
But still low volume by older standards #crypto

SHIB🔥For a long time, Shiba has become the favorite currency of the people.
As long as Bitcoin is in a correction wave
You have to wait
After that, there will be an explosion in Shiba
Label the waves based on Bitcoin.
For example, we are in wave 4 in Bitcoin, so we are also in wave 4 in Sheba

$DOGE leading atm - $SHIB not shabby either - Meme coin turn???Please look at profile for more data on this post
LOOK @ S T R E N G T H
$DOGE looks good
As pointed out some time sold ton of $SHIB & rolled most into #DOGE, price is low - high 7's
Would still buy if didn't have
First time EVER, in my personal, anything is similar in size to #SHIB
Who let the dogs out? #meme
#dogearmy #SHIBARMY #crypto

🔥WHERE TO OPEN YOUR NEW NEAR LONGS? TRADING PLAN AND TARGETS🚩🔥 Hi, friends! I think that bulls have enough power to push the price higher. Just take a look on BTC weekly and monthly candles.
So I recommend you to use these pullbacks as the possibility to accumulate more crypto. But where? Here is my trading plan.
📊 MY TRADING PLAN FOR NEAR:
🔥 fill the imbalance at $2.07-2.23
🔥 volume growth
🔥 squeeze to the trendline
🔥 bullish BTC
🚩Bullish BTC is the main precondition to open a long because in this case, all the altcoins will continue to follow it to 20-21k until BTC won't stop.
✅ MY TARGETS FOR NEAR:
1. $2.73 - the mirror level
2. $3-3.12 - the closest value area
3. $3.5-3.65 - the value area
Traders, do you start to close your long trades because of this pullback or wait for the market to pump soon? It is very interesting to know your point of view.
💻Friends, press the "boost"🚀 button, write comments and share with your friends - it will be the best THANK YOU.
P.S. Personally, I open an entry if the price shows it according to my strategy.
Always do your analysis before making a trade.

Is the Green Satoshi gonna moon?? Green Satoshi Token $GST #GST. We are above the 200 on 4 hour. Are we gonna cross the ema's daily? Rockets soon??


SHIBUSD Potential for Bullish Continuation | 30th January 2023Looking at the H4 chart, my overall bias for SHIBUSD is bullish due to the current price being above the Ichimoku cloud, indicating a bullish market. Looking for a buy stop entry at 0.00001295, where the recent high is, we are looking to take profit at 0.00001518, where the previous swing high is. Stop loss will be placed at 0.00001111, where the previous overlap support is.
Any opinions, news, research, analyses, prices, other information, or links to third-party sites contained on this website are provided on an "as-is" basis, as general market commentary, and do not constitute investment advice. The market commentary has not been prepared in accordance with legal requirements designed to promote the independence of investment research, and it is therefore not subject to any prohibition on dealing ahead of dissemination. Although this commentary is not produced by an independent source, FXCM takes all sufficient steps to eliminate or prevent any conflicts of interest arising out of the production and dissemination of this communication. The employees of FXCM commit to acting in the clients' best interests and represent their views without misleading, deceiving, or otherwise impairing the clients' ability to make informed investment decisions. For more information about the FXCM's internal organizational and administrative arrangements for the prevention of conflicts, please refer to the Firms' Managing Conflicts Policy. Please ensure that you read and understand our Full Disclaimer and Liability provision concerning the foregoing Information, which can be accessed on the website.

SHIB MAY RALLY ANOTHER 40% IF THE PRICE WILL DO A BREAKOUTSHIB is an important structure. The price is playing inside a nice parallel channel where the current market price holds the upper boundary and the resistance is formed on the daily timeframe. If the price can do a bullish breakout here, then we may see a nice rally to the upside which can push the prices by 30%-40%.
But the prices and the bullish closings of recent daily candles are following a neutral or bearish sentiment by respecting the upper boundary and the resistance formed. If the price still manages to respect the upper boundary and the resistance as a sell zone, there we may see another bearish trend that can revisit back toward the support highlighted.
Thanks for visiting my tradingview profile. Hope the chart update helps you out. If you like the content do hit the thumbs up and follow me for future updates. Don't forget to leave your thoughts and opinions on the following market. 🙌🏻😎
📌For more details regarding this chart update, please message me on tradingview chat. Thank you!

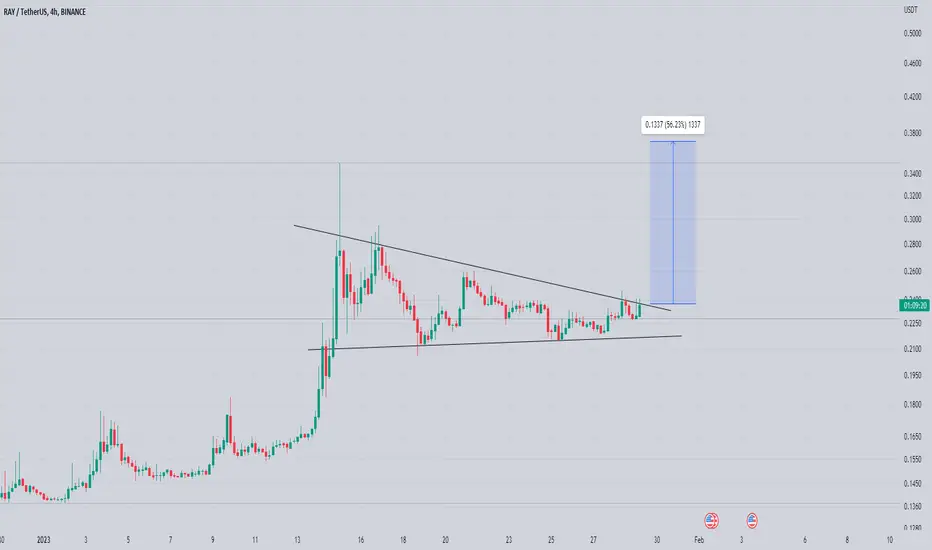
Rayusdt Formed Bulish Pennant Forming Bulish Pennant In h4 Timeframe
Incase Of breakout Expecting 45 bto 50% bulish Move
(Note always wait For confirmed Breakout )
SHIBA Weekly View - JANUARY 2023Hello Guys, Weekly Analysis is on the SHIBA Symbol in a 1H Time frame, I Hope it Will be Useful for You, Don't Forget to Like, Follow, Comment
