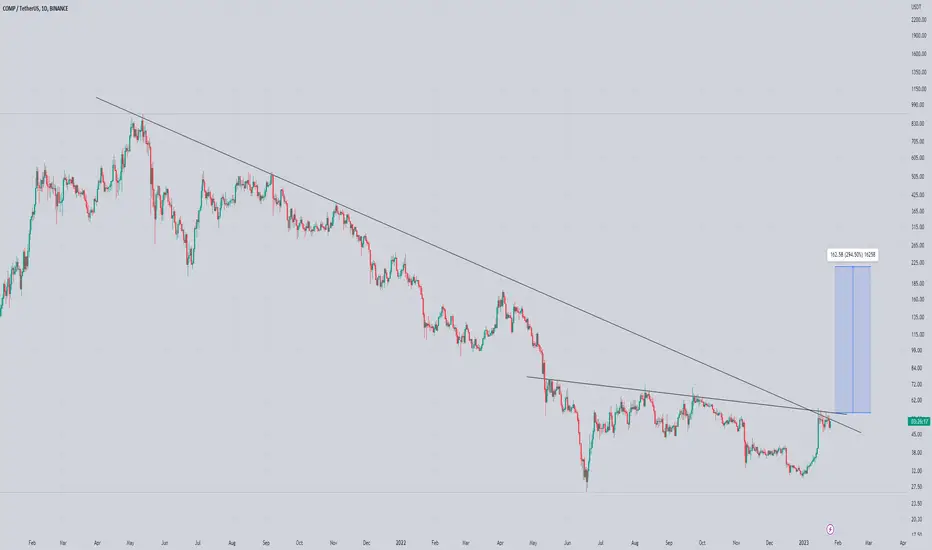
Compusdt Testing 2 Trend line At Same Time
Incase Of Breakout Expecting 300% Bulisih Move
(Note) Always Wait For Confirmed Breakout)
(Comp Will Remain Bearish Untill Its Broke Trendlines)
Shib
SHIB🐕 breaking out once again?Please 1st of all click the boost 🚀 button if you want me to post more ideas and follow me to support my work! It's absolutely for free.
After this accurate call...
...the price has been testing the channel upper edge from daily timeframe repeatedly the whole last week:
Also price is consolidating right below the channel upper edge in form of symmetrical triangle which is usually continuation pattern. It seems to me that Shiba Inu could be ready to break up this triangle📐 and IF successful I think there is chance for run to 0.00001410. I'm setting the BUY STOP-LIMIT order to recent range high anticipating the triangle breakout.
ENTRY : local high @ 0.00001220
STOPLOSS (SL) : local low @ 0.00001179
TARGET : height of the triangle projected from midpoint of the local range (BUY STOP-LIMIT - SL) @ 0.00001410
REWARD RISK RATIO (RRR) : 4.7
INVALIDATION : when SL level hit
Check my other stuff in related ideas.
Please boost🚀, comment🗣️, follow me✒️, enjoy📺!
⚠️Disclaimer: I'm not financial advisor. This is not a financial advice. Do your own due dilingence.

🔥TRON IS GOING TO BREAK THE 2-YEAR TRIANGLE: PUMP SOON?🚀🔥Hi friends! First of all, take a look at the chart. See how the whales accumulate their positions: sl hunting and volume confirmation? This is a perfect example of how they work.
📊 MY TRADING PLAN FOR TRX:
1. squeeze to the trendline
2. sl hunting below the POC area ($0.06-0.064)
3. bullish BTC
🚩 I think that this squeeze to the global trendline will be successful and TRX will break it with PUMP. This will be the best scenario,
✅ MY TARGETS FOR TRX:
🔥 $0.072 - the key level
🔥 $0.092 - the key level
🔥 $0.12 - the local high and key level
Traders, will TRX become the top gainer of the bull market? According to this triangle pattern, the target is at least +290%. Write your thoughts in the comments!
💻Friends, press the "boost"🚀 button, write comments and share with your friends - it will be the best THANK YOU.
P.S. Personally, I open an entry if the price shows it according to my strategy.
Always do your analysis before making a trade.

🔥CARDANO IS MOVING IN WEDGE: OPEN THIS TRADE ON FALSE BREAKOUT🔥 Hi friends! Cardano is moving inside the wedge and going to break it up before the dump. That is what I think to happen with high possibility.
📊 MY TRADING PLAN FOR ADA:
1. false breakout of the $0.44 local highs
2. volume growth+huge whales sell orders at highs
3. bearish BTC (approx. $25-27k)
🚩 I will decline the dump scenario if it becomes to consolidate above the key level of $0.44. In this case, it will be better to find the long entry point.
✅ MY TARGETS FOR ADA:
1. $0.4-0.41 - the value area
2. $0.38 - the key level
3. $0.31-0.32 - the value area
Traders, you can open a long trade inside this wedge and wait for reaching the $0.44 key level. You need some preconditions to enter a trade and short sl to maximize profit, of course. Share your trading plans in the comments!
💻Friends, press the "boost"🚀 button, write comments and share with your friends - it will be the best THANK YOU.
P.S. Personally, I open an entry if the price shows it according to my strategy.
Always do your analysis before making a trade.

SHIBUSDT 1HSHIB at this moment is trying to pass the cloud from bottom to top, forming a triangle. A clear accumulation movement that will result in an upward explosion.
Main support levels : 0.00001150 / 0.00001134
Main Resistance Levels : 0.00001163 / 0.00001177
MM100: At the height of $0.00001153
RSI: Exhaustion of Buying Forces
To date, Shiba Inu's burn rate has seen a whopping 28,850% increase in the last 24 hours, which is the highest percentage increase on the network seen in recent months.

Mc Coin Looking Ready Descending Channel breakout Has already Confirmed
Seems Like ready For Massive Bonuce
Expecting 300 To 350% Bulish Move

NEXT LEVEL TO WATCH FOR BICO🚀🚀💰🚀🚀💰🚀🚀💰🚀🚀💰🚀🚀💰🚀🚀💰Very nice patterns are drawn by the BICo. Long again from here chances for another breakout!!!

🔥BTC ALWAYS MAKE IT AFTER THE RANGE: HISTORY AND MY FORECAST🔥Hi friends! We already forget how Bitcoin can grow and it makes the New Year gift for all of us. A week ago, I opened the spot and futures position at $16,900-17,100. Since there was no false breakout at $17,500, so this trade is still open.
But what is my current target for BTC? We need to take a look at the previous situations on BTC chart. It was always pumping after exiting the range.
📊 BITCOIN MOVES AFTER EXITING THE RANGE
I've taken the price history from 2019 and make some research. The price pumps in 100% cases, but with a wide range:
🚩 2019
1. +238%
2. +32%
🚩 2020
3. +53%
4. +29%
5. +470%
🚩 2021
6. +110%
🚩 2022
7. +28%
8. +12%
🚩 2023
9. +23%? - the pump is just starting
So BTC had +12-470% PUMPs after the range breakout. Now it's already +23% of profit, so the PUMP is likely to continue. As you see, BTC has 1-3 pumps per year, so we can expect 2 more HUGE pumps this year too.
✅ MY TARGETS FOR BITCOIN :
🔥 First scenario. BTC pullback to $18,000-18,500 and after that move to $35,000-42,000. This pullback allows the price to calm down a bit. Actually, this helps BTC to grow higher.
🔥 Second scenario. BTC will pump to 28,000-32,000 straight after some consolidation at $20,000-21,000. The targets are reduced because without a pullback the price will be too "overheated".
🚩 Traders, be careful these days. I will open/close the trades depending on crypto market situation. Stay tuned to get more timely and profitable updates.
💻Friends, press the "boost"🚀 button, write comments and share with your friends - it will be the best THANK YOU.
P.S. Personally, I open an entry if the price shows it according to my strategy.
Always do your analysis before making a trade.

🔥WHAT IS NEEDED FOR BITCOIN TO GROW HIGHER? 1300%vs4900%🚀🔥Hi friends! A lot of newbies consider these things as something bad. These make them very unhappy and disappointed because their position gets the loss. These things are the pullbacks or corrections after significant growth. Everyone is waiting for it now to buy more cheap crypto.
📊 The pullback is the price fall after significant growth. But why is it so good for price growth:
🔥 1. it makes the market (BTC as well) much healthier because it liquidates overleverage traders.
For example, -40% pullback liquidates all traders with 1.5x leverage and coll down the market (as it was in the 2016-2017 bull market).
🔥 2. it gives the opportunity to enter the long traders for the advanced traders. If we have 5-6 pullbacks every time after 100-150% growth, you can use already earned money in new trades (increase the risk per trade).
When the price doesn't make the pullbacks and you enter the trade at the very beginning of the bull market, you have no chance to exit the trade and use the margin from the profit to increase the risk per trade.
✅ COMPARISON OF 2016-2017 AND 2020-2021
🚩 2016-2017 BULL MARKET
The market had made 4900% of profit in just 2 years. I mention 6 huge dumps with 30-40% drawdowns. These dumps cool down the market and liquidate overleveraged traders. Lots of entrance opportunities. Hope the next bull market will be the same.
Of course, you can say that market was not as big as now and I agree with you. But the whole BTC capitalization is equal to 3.5% of the entire gold cap, so it's just the beginning for crypto.
🚩2020-2021 BULL MARKET
This bull market as well as the 2019 local bull market was almost with no pullbacks and entrance possibilities. Bitcoin had made just +1300% in 2 years. Just 3 pullbacks with +16-30%. Almost no liquidations and no cool down of the market. Not the best growth as the result.
In that bull market, the beginners can't even normally use their gaining margin to open new trades.
🔥 WHAT WILL HAPPEN IN THE NEXT BULL MARKET?
I think that this growth will be the same as at the last bull market. Of course, it will be some surprises as at each bull market, but it will grow nonstop.
I make a huge update about this in the last idea. Check it if you want to know what to expect from BTC and the crypto market here👇
🚩Traders, what is your expectation about BTC bull market? Do you agree with me or have another argument? Write it in the comments!
💻Friends, press the "boost"🚀 button, write comments and share with your friends - it will be the best THANK YOU.
P.S. Personally, I open an entry if the price shows it according to my strategy.
Always do your analysis before making a trade.

BICO💰🤑💴🚀💰🤑💴🚀💰🤑💴🚀💰🤑💴🚀💰🤑💴🚀💰🤑💴🚀💰🤑💴🚀BICO is the most bullish coin right now!! A gem !!!!
A web3 gem. There were indicators it was going down, but it reversed the pattern to the bullish structure. Enter now, since we may not see another low beyond the current level.
Even it visits the lower area it will be for a short time and we all will miss that entry. Long and wait!! and retire early.
NFA!!!!


🔥DOGE GIVES YOU THE LAST CHANCE TO ENTER THE LONG TRADE 🔥Hi friends! Dogecoin is going to make a pullback after the false breakout. That value area should become the huge support area. Exactly there we should find our best entry point to long.
If it start to squeeze to the key level of $0.092, it will also be an interesting entry point for us.
📊 MY TRADING PLAN FOR DOGE:
1. test the $0.075-0.078 value area as the support
2. the volume growth
3. bullish BTC
🚩 Twitter thinks about its own crypto coin to make a payment inside the ecosystem. I think that Doge can PUMP on this announcement too.
✅ MY TARGETS FOR DOGE:
🔥 $0.092 - the key level and local high
🔥 $0.1 - the key level
🔥 $0.11 - the key level
🚩 Traders, is DOGE have a chance to grow in this bull market or it will be scammed as many similar crypto projects? Write your thoughts in the comments!
💻Friends, press the "boost"🚀 button, write comments and share with your friends - it will be the best THANK YOU.
P.S. Personally, I open an entry if the price shows it according to my strategy.
Always do your analysis before making a trade.

🔥 MATIC IS GOING TO BREAK $1 KEY LEVEL!🔥 Hi friends! The value area is a place where the whales accumulate/distribute their positions. Now MATIC is consolidainge inside the HUGE value area and I think it's an accumulation.
🚩The price of this altcoin should skyrocketing when it break the top boundary of this area ($0.96). So this is a main reason to open our longs before it happen and make a good profit.
📊 THE TRADING PLAN FOR MATIC:
1. squeeze to the trendline after the pullback
2. the huge buy orders on DOM and Footprint sclaping tools before the breakout
3. bullish BTC is a must have for the 99% of altcoins growth
🚩 The huge volume confirm the liquidation of the overleveraged long traders. It's force me to think that the recovery is possible even in a short term.
✅ MY TARGETS FOR MATIC:
🔥 $1 - key level and even number
🔥 $1.16 - key level and local high
🔥 $1.3 - key level and local high
Traders, I recommend you to book at least 30% of profit when the price reach each of our targets. Make a money and stay tuned!
💻Friends, press the "boost"🚀 button, write comments and share with your friends - it will be the best THANK YOU.
P.S. Personally, I open an entry if the price shows it according to my strategy.
Always do your analysis before making a trade

🔥BINANCE CONTINUES TO "SUFFER": DUMP COMING SOON?🔥Hi, friends! BBG is followed by RTRS with an article about how Binance handled hundreds of millions of dollars for Bitzlato.
According to the news, Binance moved $346 mln for seized crypto exchange Bitzlato, data show. Binance, in response to such reports, already said it provided substantial help in the investigation of the case against Bitzlato.
In total, this is not the best news for Binance and BTC too. As you remember, Binance is under newspaper pressure after the FTX collapse and this is only getting worse.
If you will see some FUD around Binance I think it will not be for so long. I recommend you try to find a long entry point. I will help you with it if something like this will happen.
📊 MY TRADING PLAN FOR BNB:
1. false breakout of the $318 key level
2. pullback to $292-295 value area
3. bullish BTC
✅ MY TARGETS FOR BNB
🔥 $318 - the key level and local high
🔥 $340 - the even number and key level
🔥 $361 - the key level
Traders, what do you think about BTC? How far will its growth going? Write your targets in the comments!
💻Friends, press the "boost"🚀 button, write comments and share with your friends - it will be the best THANK YOU.
P.S. Personally, I open an entry if the price shows it according to my strategy.
Always do your analysis before making a trade.

🔥🚀BINANCE FUD COME TO AN END? TRADING PLAN FOR BNB🚩🔥 Hi friends! At the weekends CZ tried to calm everyone down and it seems that it has succeeded so far.
📊 CEO Binance named 4 main reasons for FUD:
1) the audit firm Mazars, which strangely stopped cooperating with crypto companies after the FUD started
2) statements that Binance is insolvent
3) Binance's position in FTT tokens for $2.1 billion
4) unsubstantiated BUSD stablecoin
Then he posted an analysis of Binance's Cryptoquant reserves claiming that Binance's reserves cover liabilities.
He also said that the maximum greed is always observed at the top, and the maximum FUD is always observed at the bottom and said that any FUD is temporary.
✅ After his tweets, the price of BNB bounced from $220 to $250 by +13%.
🚩 Friends, now many say that Bitcoin is dead, the cryptocurrency will fall to 0, etc. But considering what a fight for the market started after the FTX crash, this is not the end but the beginning of the cryptocurrency market as an industry.
📊SHORT TRADING PLAN FOR BNB:
1. pullback to the lower boundary of the channel
2. false breakout of the local highs
3. bearish BTC
✅ THE TARGET FOR SHORT IS THE LOCAL LOW AT $220 AND THE GLOBAL LOW AT $180.
🚩 Although the end of the FUD altcoins follows BTC and it has a downtrend now. We may see another strong drop after a local rebound.
✅ The main thing is a channel where BNB consolidates for the 4 months. If bulls will have enough power to keep the price inside, we can enter a long trade with these targets:
🔥 $295-300 - the mid of the channel and even number
🔥 $337 - the top of the channel
🔥 $360 - the local high, important key level
Traders, let me know in the comments, what plan is more probable for you. Are u hold money on exchanges or have you already withdrawn crypto to the cold wallets?
💻Friends, press the "boost"🚀 button, write comments and share with your friends - it will be the best THANK YOU.
P.S. Personally, I open an entry if the price shows it according to my strategy.
Always do your analysis before making a trade.

SHIB breaking out?Please 1st of all smash the boost🚀 button to support my work if you like it! It's absolutely for free.
Shiba Inu seems to be ready to break up this triangle 📐 and IF successful I think there is chance for run to 0.00001204 following the orange uptrendline. I'm already long anticipating the triangle breakout. Interestingly enough the target coincides with the downward channel upper edge (cyan) on Daily timeframe:
Is SHIB going to test it?
ENTRY : local high @ 0.00001076
STOPLOSS (SL) : local low @ 0.00001025
TARGET : height of the triangle projected from midpoint of the local range (BUY - SL) @ 0.00001204
REWARD RISK RATIO (RRR) : 2.7
INVALIDATION : when SL level hit
Check my other stuff in related ideas.
Please boost🚀, comment🗣️, follow me✒️, enjoy📺!
⚠️Disclaimer: I'm not financial advisor. This is not a financial advice. Do your own due dilingence.

XRP RIPPLE USD Massive Multi Year Bull Flag About To BreakXRP looks like it may go on a massive run soon. This is XRP on the monthly chart. Depending on how this lawsuit goes by the SEC. If XRP wins the FOMO and people piling into XRP is going to be massive. If XRP loses the SEC lawsuit then this pattern will most likely break to the downside and XRP will get slaughtered. The price of $40+ dollars is a modest number and if XRP reaches that price I believe it could go much higher maybe into triple digits. Just keep an eye on the news and developements regarding the lawsuit. This is not financial advice this is just my opinion. Thank you for your support. Like, comment and follow for more.

🔥AVALANCHE IS GOING CRAZY: WHAT ARE THE NEXT TARGETS?🔥 Hi friends! Avalance already makes +60% from my entry point, but there are no limits for the price when the bulls are so strong.
📊 MY TRADING PLAN FOR AVAX:
1. return to the $17-17.5 value area
2. squeeze to the local trendline and breakout
3. bullish BTC
4. volume growth on correction
🚩 It will be better for the price to fall lower, maybe below the value area. In this case, a lot of sl will be collected.
✅ MY TARGET FOR AVAX:
🔥 $20.6 - the key level and local target
🔥 $22 - the key level
🔥 $25 - key level and even number
Traders, what coins do you expect to be top gainers in this bull market? Write the ticker in the comments!
💻Friends, press the "boost"🚀 button, write comments and share with your friends - it will be the best THANK YOU.
P.S. Personally, I open an entry if the price shows it according to my strategy.
Always do your analysis before making a trade.

🔥AVALANCHE IS MAKING A FALSE BREAKOUT! DON'T MISS THIS PUMP 🔥 Hi friends! AVAX is the most volatile altcoin and I think it gives us one more chance to make +10-15% on it. Now the price make a false breakout and if BTC will go up, the long will give us at least 1:5-10RR.
📊 MY TRADING PLAN FOR AVAX:
1. false breakout of the key level of $11.15
2. volume divergence
3. bullish BTC
🚩 Persolnally I use DOM and Footprint to identify the whales who buy crypto. These scalping tools help me to track their real orders. Watch my free video guides.
✅ MY TARGET FOR AVAX:
🔥 $11.5-12 - the value area
🔥 $12.5 - the key level
🔥 $12.8-13.3 - the value area
Traders, it seems like now or during the 2 closest bars we have a chance to open a long trade.
💻Friends, press the "boost"🚀 button, write comments and share with your friends - it will be the best THANK YOU.
P.S. Personally, I open an entry if the price shows it according to my strategy.
Always do your analysis before making a trade.

Doge - 1D bullishDoge coin has some bullish signals.
The downtrend line has broken out.
The pullback to breakeven has been completed.
The price can easily reach resistance zones, but be patient and cautious at them.

DGB USD Digibyte DONT UNDERESTIMATE DIGIBYTE DGB I believe is on the cusp of a massive breakout to the upside. As I have said in previous charts, DGB is going to be one of the few cryptos to survive the onslaught coming from the SEC. DGB along with a handful of other cryptos are going to soak up all the money that will be coming out of those other 20,000 plus shit coins that have been created over that last 5 years once the SEC takes them down like dominoes after XRP gets taken down. I hope XRP does win the lawsuit but I dont think it will. It passes the Howey test plain and simple, which means its a security. Theres no way around it. DGB at $30 sounds pretty crazy but its really not. Especially if Coinmarketcap gets reduced down to one page. Anyways this is just my opinion and not financial advice. Thank you.

DOBO USD DodgeBonk Symmetrical TriangleDOBO is consolidating within this symmetrical triangle after its massive run up on the log scale. Symmetrical triangles could break to the upside or the downside. I believe if Bitcoin continues its run after a small correction then DOBO will break this pattern to the upside for a measured move up to the .00000005 level with a FOMO extension to possibly .0000001. If Bitcoin and the rest of the crypto market enters a longer downside correction then DOBO will probably break down for a measured move to .0000000025 level before a bounce and a retest of the prior support turned resistance level of the bottom of the bottom of the triangle and then continue to the downside. I am leaning more towards a break to the upside. This is not financial advice this is just my opinion. Thank you.

SHIBUSDT, in accumulation and descending trend will break!?Hello guys, Everything is clear on the chart for you like always. Shiba has been in trade range and accumulation and now it seems that it wants to break its descending trend. It's better to monitor the volume of transactions to enter. The targets will be 17 and 28.
Good luck.
If you like the idea, do not forget to support with a like and follow me for next analysis :)
Write your comment and opinion below to me
