Shiba Inu's bearish correction will continue for monthsDo you know where we are for Shiba? So look the my analysis.
I think Shiba is in a diametric for big wave B, and now we are in wave E of this diametric. The time frame is big and time consuming.
This modification seems to be ongoing for months.
Contact me for exclusive and non-free analysis.
Shib

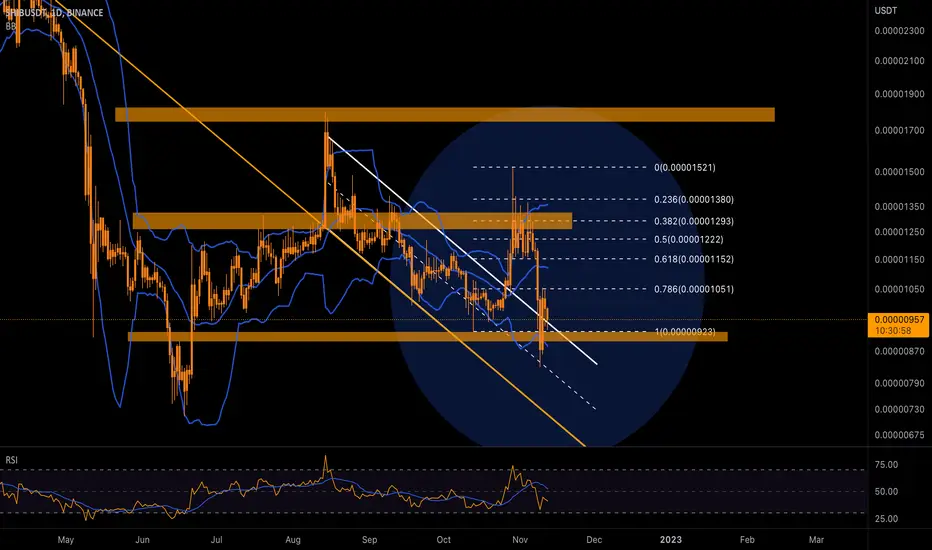
SHIBA INU SHORT TERM TECHNICAL OVERVIEW ON SUPPORTSCheck out the trade plan for SHIBUSDT today based on the technical analysis. Hope this analysis is useful, make sure to hit the thumbs and also follow my tradingview profile for future updates. Thank you!
Short term technical overview based on supports formed on the daily timeframe. Possible decline ahead towards the next highlighted support.

SHIB/USDT Bullish or Bearish ..? ( MEME Coin )#SHIB/USDT Technical Analysis:-
$SHIB currently trading around $0.0000097
And This is Dumped -92% from All time High
Not Bad Accumulation zone for Long Term Holders.
But IMO if Break Yellow Line support then It can go another 35-40% dump.
Breakout Point:- $0.00001250
This Will be best Entry if Breakout this Level otherwise wait for Lower Entry.
If Support Break then Best Accumulation Zone:- $0.00000500-$0.00000600
Long Term Target:- 10x-30x
Support:- 0.00000900/$0.00000500
Resistance:- $0.00001250
Please Like and Share.


Can Shiba's price drop continue?SHIB had a sharp price drop during the last week. After the price growth of 30% from the support area of $0.0000100, the Shiba price also increased to the resistance of $0.0000150. But there was a powerful reaction in this area, which turned back to the lower supports. The $0.0000100 support turned into resistance again, and this time the second support level in the $0.0000090-$0.0000095 range was also temporarily broken.
As you can see, we can see a range trend on the daily time frame, and as long as the current support level is maintained, there is a possibility that the Shiba price will return to the previous resistances. It is only necessary that the price returns above the $0.0000107 range at least once in the 4-hour time frame. In this case, we can expect a trend change in the 4-hour time frame. If the selling pressure continues and the current support is broken, Shiba's decline could continue to the $0.00000730 range.

🔥SAM BANKMAN-FRIED: how to become a millionaire❓Chinese recipe❗🔥Hi friends! This is an urgent update for ALL traders. Alameda Research (Sam Bankman-Fried fund), which is an FTX exchange fund, has a large amount of altcoins on its balance. A massive sell-off could happen very soon if the situation does not stabilise.
✅ Also it's a great opportunity fot the traders.
📊 HOW TO BECOME A MILLIONAIRE FOR 1 DAY? SBF CASE!
The Bloomberg Billionaires Index has been updated, according to which FTX CEO Sam Bankman-Fried's (SBF) net worth is now $992 million, up from $16 billion yesterday. SBF become a millionaire, but still the multi-millionaire!:)
✅ As far as you know, CZ tweet about FTX token (FTT) force traders to withdraw their money from FTX exchange. This forced CEO Sam Bankman-Fried to start negotiation on selling the exchange due to the risk of bankruptcy.
🚩 ‼️ It is possible that Binance and CZ itself will face legal issues, because many traders lost money because of such "manipulations". More details later.
📊 THE POSSIBLE HUGE DUMP OF ALAMEDA'S ALTCOINS!
Alameda Research hold almost 41 crypto coins as FTX echange reserves. If the withdrawal from FTX continues, they will be forced to sell some holding to cover the losses and allow the traders to withdrawal money.
🔥 This is a list of tokens and coins (>$100,000 assets) that can be sold by ALAMEDA in the closest future.
🚩 Such situations is always the opportunity for the well prepared investor or trader. So if you find the best entry point to long or short, the price will FAST reach your take profit on such volatile market.
📊 SOLANA IS UNDER THE BIGGEST PRESSURE!
Approximately $320m in Solana tokens could take Alameda Research out of stacking in the next 24 hours. This is approx. 18 M of SOL. Be carefull with this token.
🚩 As far as we know, there are a lot of news that force retail traders to sell while the whales continue to buy. I use DOM and Footprint sclaping tool to track such whales buy/sell orders and share this data with my subscribers. According to this data I will decide to long or to open a short the alts or BTC.
📊 TECHNICAL ANALYSIS ON FTX CHART
Now FTT fall for almost 97% from the ATH. The traders in such situations say that the chart is "broken". But I marked 2 value areas for you:
1. $22-33 value area where a lot of tokens were bought and IF price return to this area, a lot of traders/investors will sold their tokens at the breakeven. So we can assume that it will be BIGGEST resistance for the price.
2. $3.4-4.5 very old value area which become the support for the price and already bounced to $5. If everything going OK to FTX and it will not announce bankruptcy, the price can consolidate above or inside this area. At least it will be the most positive scenario for FTX.
The worst scenario if FTX token fall below the $3.4-4.5 area and test it as the resistance what will be the disaster for someone who don't use the risk management and opportunity for the short traders.
🔥 Traders, do you buy or sell crypto on this DUMP? BTC or alts? Write in the comments and stay tuned for more updates!
💻Friends, press the "boost"🚀 button, write comments and share with your friends - it will be the best THANK YOU.
P.S. Personally, I open an entry if the price shows it according to my strategy.
Always do your analysis before making a trade

shib analysis in 4h / down trend seem to endshiba try to end 5 eliot wave with the biggest wave in 5 plus the 261.8 fib

SHIB Scalping, Keep It SimpleI had the opportunity to sell .000011 to buy .00000955 , and now I am just looking to target the last point of supply which is where I sold in the first place. Price action will determine how much when we get there. Not financial advice.

i was in $MINU before it exploded to millionsSitting @ 120k market cap. Nobody would give sht in this right.
I just put it out here just in case it happens.
I wanted to be a hero helping other ppl reach financial freedom in this memecoins.

SHIB: Another IH&S! Some Key Points to watch from here.• On our last analysis on SHIB I warned about an IH&S chart pattern, that did work very well, as by the moment SHIB broke our key point, it hit the previous resistance with an astonishing precision before dropping again (link to my previous analysis below this post);
• Now, we see the same pattern again, so what are the key points? The trigger point is the black line, while if it loses the red line it’ll frustrate the pattern. The technical target would be the previous resistance at the green line. This is a normal configuration of an IH&S;
• However, if SHIB loses the purple line, then it might face more serious problems in the mid-term, as this would indicate a sharper sell-off;
• For now, let’s pay attention to these lines and see what happens. I’ll keep you guys posted on this.
Remember to follow me to keep in touch with my analyses!

🔥Where the place to buy ETH with highest pottential to grow?Hi friends! In previous ideas I explain you why the MERGE of ETH is similar to BTC halving. Long story short, a lot of people wait for some crypto events and buy coins in hope to make HUGE money. In real life, the price of crypto falls after such events.
✅ The same happen to ETH MERGE. A lot of retailers wait for the growth, but now sell their ETH to whales on this fall.
I think that after ETH fall below the channel and the local low of $1192 will be renewed, the whales will buy enough coins and even the most patient traders will not be able to survive at this drawdown. And here we have a chance to open our longs.
📊 The main reasons to open a long:
🔥 false breakout of the channel. When the price fall lower the channel and then return inside it, it will the time to open a long
🔥 volume growth
🔥 squeeze to the trendline before the breakout
🔥 bullish BTC
🚩 DOM and Footprint help to identify the moments before the pump and dump because using these trading tools I can see the whales orders. The whales are the price drivers.
✅ My local targets on ETH:
1. $1476-1500 - the local key levels
2. $1570-1640 - the value area
I recommend you to book 75% of profit when ETH reach our 2nd target.
💻Friends, press the "boost"🚀 button, write comments and share with your friends - it will be the best THANK YOU.
P.S. Personally, I open an entry if the price shows it according to my strategy.
Always do your analysis before making a trade.

SHIB GONNA TAKE OFF SOONLots of liquidity have been induced, retail trader are going to get liquidated before the take off. #NFA #DYOR

SHIB/USDT 800% Potential Pump Ahead!! Practical?Welcome to this quick Trade Setup.
Our Last few performances:-
BTC: Called the dump target to the dollar ✅
Next BTC Target of 21k HIT ✅
SUSHI Pumped:- 26% in a day ✅
USDT on Track ✅
PYR is up 10% and still on track ✅
AR on track ✅
To verify, go through my last 10 charts 😃
DOGE pumped like crazy after Elon Musk acquired Twitter.
SHIB mostly follows DOGE and the way this chart is looking it seems like it can pop anytime soon.
If not 800% at least 100% to 250% seems imminent!!
800% is the long-term target whereas it is likely to pump at least 100% in the short term.
Tether Dominance has broken a parabolic trend, these alts are likely to go up in the coming weeks.
Even if this ends up being a trap because nothing is certain these days, the risk is way too small when you compare it to the reward and practically speaking, if you are missing these coins now you are likely to buy it higher or even the TOP.
ENTRY:- $0.00000959 to $0.00001250
SL:- $0.00000853
Target:- Please observe the chart!
DYOR, This is not financial advice.
I bought at CMP and will buy more if I see any dip.
Please hit the like button, your support means a lot to me, and do not forget to share your views in the comment section.
Thank you
#PEACE

shib hit the blue resistans again ! hi friends this is my idea about shib
if shib can to break the blue dynamic line , then it can go upper into 0/00002178
i think it can! so my oponion is long .. if it can to break the blue line

shib technical analysis / really want to break ??wave 4 : complete and ready to head wave 5 / but when ? after break 61.8 fib

🔥RETAILERS PANIC: IS DUMP coming? BNB return to my entry point!Hi friends! BNB Chain team confirms $100M+ stolen as a result of an on-chain hack, $7 million of which was frozen.
Due to this, BNB fall by -5% which is usual correction on crypto market. You can see a lot of confirmation of panic selling. The unusual volume growth on the volume indicator. As far as you understand, if someone sells crypto, someone buys it. Whales could buy a lot of Binance coins there. Do we need to join them?
✅The price of BNB make +7% after the last idea and almost reach my first target, but after the bad news price return to the entry point again!
Now it is the another chance to open a long trade from with the amazing possible profit!
📊 Preconditions to open long:
🔥 liquidation of the weak hands and panic among the retailers which is already happen
🔥 volume growth confirms that a lot of buyers support the price
🔥 squeeze to the local trendline
🔥bullish BTC pull all the altcoins up
🚩 I use DOM and Footrpint to identify the whales and open a trade with them. I like this scalping tools because it can help to open a swing trades as well. The succesfull swing trade with short stop loss and 1:20RR.
📊 The targets are the same:
1. $300 - the closest key level
2. $337 - next resistance and key level
3. $380-400 - value area, mid term target according to the massive bullish flag
I don't think that the price will go lower because Binance is the largest crypto exchange and they even cover the loss of $100M. But Binance already announce that block thieves wallets and possibly even return this money soon.
Another chance for us to make $
💻Friends, press the "boost"🚀 button, write comments and share with your friends - it will be the best THANK YOU.
P.S. Personally, I open an entry if the price shows it according to my strategy.
Always do your analysis before making a trade

🔥SOL whales are going to make a trap. BEST point to open tradeHi friends! I think that CPI (inflation in US) data today will show us the trend for at least 1 month. I expect the local manipulation with sl collection and the next move up. The whales will buy enough SOL during this manipulation to push the price higher.
📊 Preconditions to open a long:
🔥 whales trap+volume growth
🔥 squeeze to the trendline
🔥 DOM and Footprint show the pressence of buyer (HUGE BUY ORDERS)
🔥 bullish BTC
🚩 The volume is the powerfull indicator which can help you to find the place where the most trades did. If this is a bottom, usually it become the best ebtry point to long.
📊 The targets for SOL:
1. $35 - the closest resistance and key level
2. $38-41 - the HUGE value area
3. $48-50 - key levels and local highs. Mid term targets
✅ I reccomend you to book 50% of profit when the price reach the 2nd target.
💻Friends, press the "boost"🚀 button, write comments and share with your friends - it will be the best THANK YOU.
P.S. Personally, I open an entry if the price shows it according to my strategy.
Always do your analysis before making a trade

🔥🔻GALA DESTROYED? The hacker minted 56B of GALA coins❗🔥Hi friends! Bad news for GALA. According to some reports, unknown persons have minted ~55.6 billion pGALA synthetic tokens worth up to $2.2 billion through the PancakeSwap decentralized exchange (DEX).
✅ The hacker managed to sell only 12,977 BNB, which he bought for printed GALA. The total "profit" is $4-5 million.
📊 First of all I should say that GALA wasn't hacked because it based on ETH blockchain. The hackers attacked the pGALA coins which is used on the PancakeSwap.This information confirm the President of Blockchain of Gala Games.
✅Also GALA wasn't hacked due to the official Twitter account of GALA Games. I think they mean tockens on the exchanges that based on the ETH blockchain.
📊 SO WHY THE PRICE OF GALA DUMPED?
The coin price fall because of the panic and arbitrage of some market players. Huobi exchange decided to delist the coin because the arbitrageurs collapsed the price by almost -80-90%.
🚩 On Binance, the coin fell by -34%🔻, but the exchange blocked the withdrawal/deposit to avoid the manipulation with price.
📊 WILL GALA CONTINUE TO DUMP?
So as you all understand now, the price DUMP based not only on the hacker attack but because of the panic and arbitrageurs. I think that in a few days the price return to it's previous conditions.
I recommend to check my latest idea on GALA. The price already make +42-45% from our entry point. I hope my subscribers book the profit and close the part of position in the breakeven.
I think that we can left the same targets. The main task for now is to find the best entry point for long positions. Of course, look at the BITCOIN to choose the direction of altcoins movements. If BTC is bullish, all altcoins is bullish too.
🚩 FUN FACT. In addition to the fact that Bitcoin finally started its growth, October was a record month for the number of hacks. During the month, hackers stole almost $657.2 million in crypto. Now we can call October not only Uptober but Hacktober.
Traders, do you sell or buy GALA on this DUMP? What will happen to GALA in upcoming days? Write your thoughts in the comments.
💻Friends, press the "boost"🚀 button, write comments and share with your friends - it will be the best THANK YOU.
P.S. Personally, I open an entry if the price shows it according to my strategy.
Always do your analysis before making a trade.

SHIB: Looking VERY GOOD! Key points to watch next.• SHIB is trying to trigger an IH&S chart pattern just above the key support at the black line;
• Would be important to see SHIB breaking the blue and purple lines in order to trigger a bullish reversal – this could make it seek higher levels;
• However, if it loses the black line, it will frustrate any possible reversal thesis, and the next stop is at the next support, around the red line;
• Whatever side it breaks, SHIB looks interesting. For now, let’s pay attention to these lines on the chart.
Remember to follow me to keep in touch with my analyses!

🚩✅ The 3 target for GALA, if the market reverse now!Hi friends! Now the price of GALA inside the channel and the 2nd test of lower boundary is possible, but only in case if BTC fall to $16-17k.
I think that the most possible scenario is continue of consolidation or local growth to the 3 targets that i mention below.
📊 The main reasons to open a long:
🔥 trap of the retail traders and volume growth at the bottom. It confirms the pressence of buyer for us
🔥 squeeze to the upper voundary of the channel
🔥 whales buy orders on DOM and Footprint scalping tools
🔥 bullish BTC will push the price of entire crypto market higher and higher
🚩 Can you image how many short are currently opened by retailers after 80-90% DUMP? I think that the liquidation of this short position could cause the HUGE pump of this Game-Fi project. The short traders become the fuel🔥 for the highly possible grow.
✅ Close your long in profit here:
1. $0.044 - the key level
2. $0.51-0.55 - the value area and strong resistance
3. $0.074 - the local high and key level
I recommend you to book at least the 60-70% of profit when the orice reach the 2nd target.
💻Friends, press the "boost"🚀 button, write comments and share with your friends - it will be the best THANK YOU.
P.S. Personally, I open an entry if the price shows it according to my strategy.
Always do your analysis before making a trade.

SHIBA INU (SHIB) is forming a bullish Gartley for upto 39% pumpHi dear friends, hope you are well, and welcome to the new update on SHIBA INU (SHIB) token with US Dollar pair.
Recently we caught a nice pump of SHIB as below:
Now this time a daily time frame, SHIB is about to complete the final leg of a bullish Gartley pattern.
Note: Above idea is for educational purpose only. It is advised to diversify and strictly follow the stop loss, and don't get stuck with trade

SHIBAUSDT|30 Percent DealHello trader Today I have prepared a new idea for you. Like and subscribe to the channel there is a lot of useful information✅
The asset broke through the global trend line and was able to consolidate higher, which means that there is a chance to get a rebound again to the Fibonacci 0.618 zone.
The asset is now testing a trend line in the form of a double bottom, this pattern works out 80% for a rebound up
