Only patience is required It seems that Shiba's work is over, but this currency has shown that it can surprise the whole world again, according to the flag pattern, it seems that it will start to rise again after the downward trend.
This pattern was also observed in the bit chart that I drew in the previous analysis
What do you guys think?
Shib

🔥🍣Is SUSHI a new PUMP coin? Hi friends! SUSHI🔥 is making HH and HL despite entire crypto market. This altcoin looks stronger than many others that is why you should pay attention to it.
If you take a look on the volume indicator, you will see that a lot of coins were bought at the bottoms. The volue bars are always growing when the price fall to local bottom.
📊 The preconditions to open a long on SUSHI:
🔥 the volume growth during the fall to closest value area of $1.2-1.3 which is support for the price
🔥 squeeze to the trendline
🔥 bullish BTC
🚩 One thing that really dangerous that is the growth of volume at the pumps, that means the huge sells of by huge hodlers. It's not good for futher growth, because big guys might expexct the fall where they accumulate more SUSHI again.
The DOM and Footprint scalping tools help me to identify this whales. If I will see the HUGE buy orders+long preconditions before the breakout, I will choose the buy side of course.
✅ The targets for SUSHI:
1. $1.92 - the key level which is resistance for the price.
2. $2.5 - the key level and even number which become the local resistance for the price.
*$1.41-1.54 - the value area, if SUSHI fall to $1.2-1.3 area. This will become the good target. I also think that the breakout without the pullback to $1.2-1.3 area is highly possible so pay your attetion to the chart to no miss the profit.
💻Friends, press the "boost"🚀 button, write comments and share with your friends - it will be the best THANK YOU.
P.S. Personally, I open an entry if the price shows it according to my strategy.
Always do your analysis before making a trade.

LUNA CLASSIC BOUNCE THEN CONTINUATION TO .00009 HEAD & SHOULDERSLUNA CLASSIC LUNC
Luna seems to be bouncing within this falling channel/wedge. If LUNC has the volume and manages to break out of this wedge then I can see a nice run to .00033 and if there is enough steam and volume then a spike to .00035. At that point I believe LUNA will drop back down to previous support at .000288. Once that happens LUNA will have formed a perfect head and shoulders on the hourly all the way to the 6 hour, in which a measured move drop would bring it to its previous low in this correction at .000182. From .000182 there is hardly any real support all the way down to .00015 - .00009 and I see LUNA breaking right through .000182 after maybe a tiny bounce and then continue to bleed out all the way down to .00009ish. My previous targets still stand, I do not see LUNA taking off from here, this was a relief rally and once its over the correction will resume.
I also wanted to update you Lunatics on the burns. So far since the burns started LUNA has burned about 10 Billion tokens. Binance burned about 5 billion in a week of their transaction fee burning bullshlt. This is the most important part please focus: EVEN IF LUNA BURNED 10 BILLION A WEEK IT WOULD STILL TAKE 100 WEEKS TO BURN 1 TRILLION. THE SUPPLY IS STILL ALMOST 6 TRILLION! AS SUPPLY DECREASES THE AMOUNT OF TOKENS BURNED DECREASE DRAMATICALLY. IT WILL TAKE MORE THAN 20 YEARS TO BURN 90%.
I don't understand why everyone is still screaming for $1, $.10, or even a penny, itll never happen with the current supply and because this thing has no use case other than to be pumped and dumped. Then calling me stupid because I am posting the truth trying to save you poor suckers from a scam. What is wrong with you people? Did any of you pass simple 6th grade math? Is the dream state too sweet to get out of? Are you all on drugs? I don't understand what it is but something is wrong with the whole lot of you. I think in your mind you're so set on becoming millionaires that you have lost sight of common sense and what is actually happening because of the delusional dream state you're all in. It reminds me of that movie Don't Look Up. Then when the rug gets pulled and you jackasses loses all your money you start crying to mommy, stomping your feet, and wanting to sue and blah blah blah. At this point I know Ive saved a good handful of people from losing their shirts and they took profits and got out of this scam and put their money into something with true value. Kudos to you guys who did get out. The rest of you, I wish you the best and I hope that when LUNA does crash and you're money is in the whales pockets who dumped on your face this whole time, that you aren't scared to enter crypto again. These scams really put a dent in crypto adoption when they collapse, because it scares people out of the market. At least until the next bullrun when you guys buy the top and sell the bottom again. How many times does someone have to run into a glass door or lick a metal pole in the winter to realize it hurts?
THIS IS NOT TRADING OR FINANCIAL ADVICE THIS IS JUST MY OPINION. GIVE ME A BOOST AND FOLLOW FOR MORE! THANK YOU AND GOOD LUCK

CAKE WAS FUN BUT NOW ITS DONE! Multi Year Correction IncomingPancakeSwap CAKE/USD is showing some real weakness. The selling pressure is astronomical and its going to consolidate for a while maybe a few years if it sticks around. These types of projects will more than likely be weeded out by new regulation over the years. Unless Cake can move with the regulation coming then its more than likely going to tank. It had a nice run but many of these new crypto's and other crap coins/project are going to fizzle away in the next few years. This is not trading or financial advice just my opinion. Comment and like if you appreciate this content. Follow me for more frequent updates. Thank you

Bitcoin BTC 88 444 888 > BULL RUN IS ABOUT TO START !Hello my friends, good morning. I wanted to share something with you all. I was just playing around with moving average inputs on Bitcoin on the Daily time frame. I changed the inputs to 88, 444, and 888. What I noticed all the way back as far as the moving averages can show data on Bitcoin daily time frame is very interesting. Every time in Bitcoin history when the 88 crosses below the 444 there was the final drop before the next run. Then after the 88 crossed below the 444, when it crossed below the 888 moving average it was the end of the drop and the bottom was in. Obviously you cant predict future movements on previous price action but I found this to be very interesting, and if we look at the price action today and apply the past iterations to it then we will see that the bottom was in mid June and we are about to start the next bull run. I feel like something big is about to happen with Bitcoin and the rest of the crypto market. Everyone and their brother is bearish right now and Bitcoin loves to surprise the crap out of everyone so its my belief that Bitcoin is about to go on a face melting rally. I mean fast and straight up and everyone who is short is about to get rekt. I dont care about the world situation in regards to this rally. Putin and Ukraine will do their thing and it'll all be over soon, no one really cares anymore, we're over it. Mid terms are coming and the Democratic party really needs something good if they want to win again. I think soon there is going to be a flurry of good news coming, and more than likely a pivot with more free money. Just be ready and stop listening to all the people calling for lower, this is always how it goes at the bottom everyone calls for lower. Even if Bitcoin got to 12k like all the bears want they would call for 8k and 5k, its never ending and their greed is going to kick them in the ass. This is not trading or financial advice this is just my opinion, please do your own research. If you appreciate my ideas then please support my work by giving me a boost and follow for more updates. Thank you and good luck everyone.

Shiba - we focus on longs from the lower boundaries of the rangeOn the chart you can see how the market pro keeps the price in the range, not allowing us to update the local highs. A short is expected after a false breakout of the upper range boundary, with a quick return back. From the lower boundary we look for long sets.
If you like the idea, give it a "Like". That's the best "Thanks!" for the author 😊
P.S. Always do your own analysis before a trade. Put a stop loss. Fix profits in installments. Withdraw profits in fiat and make yourself and your loved ones happy.
🔥🚀 $5 for TWT: What happen to TWT after triangle breakout?Hi friends! The most promising altcoin for the next bullrun. Trust wallet token (TWT) is a MetaMask wallet competitor. Binance, the largest exchange, and TWT cooperate with each other.
I think that Binance will help TWT to reach the targets that we will talk about in this idea.
🔥 Now the price of TWT consolidating inside the triangle and the range is narrowing. It means that the price can blow up soon. Do you remeber AXS which had the same consolidation before the PUMP? It was the top gainer of 2020-2021 which made 140-150x.
🚩 Additionally, you can see that all the crypto falls but not TWT. Even BTC fall to its bottom but TWT make the HL and can make HH. Strong bullish signal.
📊 My preconditions to open a long:
🔥 show the strength and beat 99% of crypto market. It confirms the pressence of buyer which support the price. It's really good for the upcoming growth.
🔥 squeeze to the upper boundary of the triangle
🔥 another chance to open a long is the test it as the support
🔥 volume growth at the test as the support show that buyers are ready to support the price
🔥 bullish BTC
🚩 Take a look on the chart. I make the second scenario for you. When the price break up the triangle and return to it (false breakout), it's a chance to open a nice short with target of $0.29-0.4.
📊 The 3 long targets for TWT:
1. $1.22 - the closest key level
2. $1.5 - the key level and ATH
3. $4.8-5 - just the technical long-term target if TWT break this triangle up. Also we need BTC will start it's new local bullrun at least.
✅ I think that even $10-15-20 is really possible target for the $400 mln capitalization project.
💻Friends, press the "boost"🚀 button, write comments and share with your friends - it will be the best THANK YOU.
P.S. Personally, I open an entry if the price shows it according to my strategy.
Always do your analysis before making a trade.

Shibainu .... Time 1sa@t We don't know if Shiba will succeed in crossing this triangle, we have to wait and see.💁♀️

LUNA CLASSIC HEAD & SHOULDERS FORMED AS PREDICTED > SLOW BLEED!LUNC is moving exactly as I predicted in my last chart (ill link it below for you non-believers). The head and shoulders has formed and LUNC is trading below it now. The neckline is broken and the price is hanging on by a thread at this point. A huge drop is coming for the measured move, down to at least .00018 and then a bounce there at the dynamic support level up to about maybe .00024. Then a quick drop back below .00018 and then a slow bleed to major support around .00009 and wicks lower to .00008 is very possible once the panic selling starts and the staked coins start to become un-staked and sold. Anyone who is staking LUNA is screwed in my opinion cause it takes something like 20 days to unstake and by the time they get them the price will be .00009 if they are lucky. LUNA CLASSIC will never burn the coins everyone is hoping it will burn. All this burn talk and Binance burn is to literally keep the suckers hanging on so the big fellas can dump it on their chin. Oh and for USTC to re-pegg it needs to be trusted and used as a stablecoin, that will never happen so drop that idea right out of your heads right now. Shame on LUNA for screwing you all the first time but, Shame on you all for getting screwed twice in a row with this sh!tcoin! Also for all the you-tubers out there pumping this piece of horsesh!t, phuck you too, you're all sh!tbags for screwing over innocent people so you can get your damn clicks, karma is a MF. Get phucked!
THIS IS NOT TRADING OR FINANCIAL ADVICE THIS IS JUST MY OPINION. GIVE ME A BOOST AND FOLLOW IF YOU WOULD LIKE TO SUPPORT MY WORK. THANK YOU AND GOOD LUCK OUT THERE.
THIS IS MY PREVIOUS CHART I MADE SAYING THAT THE PRICE ACTION WAS NOT GOING TO FORM NEW HIGHS WHEN EVERYONE WAS SCREAMING LUNC NEW BULL RUN. I SAID INSTEAD IT WOULD FORM A HEAD AND SHOULDERS AND THEN CONTINUE THE DROP.

📊 MANA reach my short targets. Now 3 long targets for youHi friends! Do you forget about Decentralend? The top gaming project of 2021 is on the bottom now and noone wants to buy it with 90-95% discount.
✅ My last idea for MANA reach the target of the local low ($0.629). Check it and get more useful tips for your trading strategies!
🚩 Now MANA is tesing the trendline for the 4th time. We know that the more test of the trendline the weaker it becomes. I think at the 5th test, the trendline will be broken up.
Also, the probability of the PUMP is growing after this fall to the local low and the key level of $0.629. It's time to find the best entry point to long after this trap and manipulation by the whales.
📊 3 reasons to open a long:
1. trap by the whales to force the short traders become the fule for growth+take out the sl of long traders. It's already happen
2. squeeze to the trendline
3. bullish BTC
✅ My targets for long on DYDX:
🔥 $0.69-0.71
🔥 $0.81-0.86
🔥 $0.96-1 - the value area and even number which is huge resistance for the price
💻Friends, press the "boost"🚀 button, write comments and share with your friends - it will be the best THANK YOU.
P.S. Personally, I open an entry if the price shows it according to my strategy.
Always do your analysis before making a trade.

🔥🚀$1.80 is a min target for long on DYDXHi, friends! Put on the watchlist this altcoin because the huge breakout might happen soon. Now the price consolidating below the key level of $1.58 and i think will be broken up soon.
📊 Preconditions to open a long:
🔥 squeeze to the $1.58 key level
🔥 huge whales BUY orders which support the price and don't let it fall down. I check it by using DOM and Footprint scalping tools.
🔥 bullish BTC
🚩 I highly recommend to pay your attention to the false breakout when the price reach the first closest value area. I will book 100% of profit if the false breakout happen and try to find the best entry point, of course.
✅ My targets for DYDX:
1. $1.79-1.85 - the closest resistance and value area
2. $1.98-2.13 - the important value area and even number
💻Friends, press the "boost"🚀 button, write comments and share with your friends - it will be the best THANK YOU.
P.S. Personally, I open an entry if the price shows it according to my strategy.
Always do your analysis before making a trade.

🔥🚀Another chance to make +20-40%: AVAX is going to PUMPHi, friends! Monday, the markets are waiting for the opening of the SnP500, which will help to understand the general direction for the crypto market.
Avalanche is consolidating below the trendline and I think the break up is highly possible.
📊 There are preconditions to open a long:
✅ trap+volume growth which already happend
🔥 squeeze to the trendline
🔥 bullish BTC
🚩Pay your attention to the $17-18 value area. It will be nice to not see some bearish false breakouts. If something loke this happen, i will book the profit from the longs and open short positions.
✅ The targets for the AVAX:
1. $17-18 - the value area
2. $20 - the key level
3. $21-23- the liquidity gap
🚩 I recommend you to book at least 50-60% of profit at the 2nd target.
💻Friends, press the "boost"🚀 button, write comments and share with your friends - it will be the best THANK YOU.
P.S. Personally, I open an entry if the price shows it according to my strategy.
Always do your analysis before making a trade.

🔥AVALANCE TRIANGLE BREAKOUT! 3 long targets!Hi firends! 🔥AVAX is going to break the triangle. It`s a chance to open a long on the breakout!
It's highly expected after such long and exhausting consolidation. A lot of retail traders, newbees are leave the market in panic becsue of "crysis", "black mondays" news.
🚩 The bear market is great at sorting out those who will make money and those who will buy crypto at all-time highs.
📊 My preconditions to open a long:
🔥 identify the intentions of the big player. Take a look on the volume indicator. A lot of coins were bought at the bottom. That's mean the big player bought the bottom and going to sell the crypto higher.
🚩 The Dom and Footprint are the scalping tools that help me to identify the orders of the big players in real time. Usefull things to increase your winrate by 30-35%.
🔥 squeeze to the boundary of the triangle
🔥 bullish BTC pull all the altcoins higher
📊 The targets:
1. $21-22 - the closest resistance and local highs
2. $23-25 - the close value area
3. $30 - the key level
✅ I recommend you to take some profit when the price wil reach the targets. You need to book at least 50-70% at the second target.
💻Friends, press the "boost"🚀 button, write comments and share with your friends - it will be the best THANK YOU.
P.S. Personally, I open an entry if the price shows it according to my strategy.
Always do your analysis before making a trade.

🔥✅FTM pump: the whales traps last long tradersHi friends! Fantom is making lower lows but the volumes are also falling lower. I marked it on the chart.
✅ This is not common thingand mean that there are no sellers at the market. Also the whales collect enough liquidity and don't let the price fall lower. FTM could make at least the local pump.
📊 The preconditions to open a long:
🔥 volume growth during the DUMP
🔥 squeeze to the trendline
🔥 bullish BTC
🚩 Pay your attention to the first value area of $0.22-0.23. If we see the false breakout or test as the ressistance i recommend you to book at least 50% of profit. If I will see the sign of bull strength+DOM and Footprint wall orders to sell, I close 100% and open the short trade.
✅ The targets for FTM long. 3 value areas:
1. $0.22-0.23
2. $0.27-0.28
3. $0.34-0.36
🚩 Book 50-70% of profit when the price reach 2nd target.
💻Friends, press the "boost"🚀 button, write comments and share with your friends - it will be the best THANK YOU.
P.S. Personally, I open an entry if the price shows it according to my strategy.
Always do your analysis before making a trade.

$SHIBUSDT Shiba Inu PT .0006 and higher Returns 58XWhat is Shiba Inu (SHIB)?
Shiba Inu (SHIB) is a meme token which began as a fun currency and has now transformed into a decentralized ecosystem. During the initial launch, 50% of the supply was allocated into Vitalik Buterin's ethereum wallet. The price of SHIB has soared from as low as $0.000000000056 to an all time high of $0.000084, that is a 150,000 times increase within 8 months.
As a result of that, Vitalik proceeded to donate 10% of his SHIB holdings to a COVID-19 relief effort in India and the remaining 40% is burnt forever. That donation was worth about $1 billion at that time, which makes it one of the largest donation ever in the world.

$SHIBUSDT Shiba InuWhat Is SHIBA INU (SHIB)?
Once upon a time, there was a very special dog. That dog was a Shiba Inu, and this dog inspired millions of people around the world to invest money into tokens with the dog's image on it.
According to the SHIBA INU website, SHIB is the "DOGECOIN KILLER" and is listed on their own ShibaSwap, a DEX. Shiba Inu coin was created anonymously in August 2020 under the pseudonym "Ryoshi." Ryoshi says about himself that he is a nobody and not important and that the efforts to unmask his identity, even if successful, would be underwhelming.
This meme coin quickly gained speed and value as a community of investors was drawn in by the cute charm of the coin paired with headlines and tweets from personalities like Elon Musk and Vitalik Buterin. Vitalik Buterin was long believed to be the originator of Shiba Inu, but denied such rumors on the Lex Fridman podcast on June 5, 2021.
Shiba Inu aims to be the Ethereum-based counterpart to Dogecoin's Srypt-based mining algorithm. Shiba Inu and the SHIB token are part of a swarm of dog-themed cryptocurrencies, including Baby Dogecoin (BabyDoge), Dogecoin (DOGE), JINDO INU (JIND), Alaska Inu (LAS) and Alaskan Malamute Token (LASM). These lesser-valued tokens have attracted investors who missed the Dogecoin pump from 0.0002 to nearly 0.75 USD.
Shiba's success sparked an avalanche of copycats, such as BitShiba, Shiba Fantom, Shibalana, King Shiba, SHIBAVAX, Captain Shibarrow, SHIBA2K22, SpookyShiba and countless others. In total, there may be well over 100 Shiba Inu copies, and the number keeps rising constantly.
On Sept. 17, 2021, Coinbase, the largest U.S.-based crypto exchange, listed Shiba Inu on their platform. This news caused Shiba Inu price to rise by over 40% in the following two days, bringing the meme dog token into the spotlight again.
Shiba Inu has since attracted more interest from other exchanges as well. Bitso, Mexico's biggest cryptocurrency exchange, announced in September that SHIB would start trading on its exchange. Giottus, an Indian crypto exchange, announced the same. Bitstamp, the biggest crypto exchange in Europe, said that it would list Shiba Inu for trading at the beginning of 2022. Korbit, a South Korean exchange, became the country's first exchange to list the SHIB token in 2021.
Who Are the Founders of SHIBA INU?
The SHIBA INU WoofPaper has three reasons why their team created SHIB:
"We started from zero, with zero."
"The brilliant minds behind Shib had never collaborated before."
"We love Shiba Inu Dogs."
The anonymous creator of the Shiba Inu coin is known as "Ryoshi." However, very little is known of the mystery founder of the dog-themed cryptocurrency, much like the founder of Bitcoin, Satoshi Nakamoto.
In his blog RYOSHI RESEARCH, he characterizes himself as "just some guy of no consequence tapping at a keyboard." Ryoshi said that usually in projects there are different roles like a CEO, a "tech guy," and a roadmap, resulting in "someone plebs can bitch at." He stresses that with Shiba, no one person is accountable or responsible and underlines that he owns 0 SHIB to this day. For this reason, Ryoshi can be "pure and unbiased," getting satisfaction from Shiba "in other ways."
It has been speculated that Vitalik Buterin was behind the initial liquidity that helped set up Shiba Inu's liquidity on Uniswap. According to Ryoshi, he had "a fren" he met at Devcon in Osaka that sent him 10 ETH to set up the liquidity pair on Uniswap. Ryoshi also stated that Shiba Inu was an experiment in decentralized community building, and he thus declined all the influencer requests and pitches from different exchanges he received. His "job" is to defend the brand and give suggestions, although he does so very sparingly, as his last blog entry dates back to May 2021.
What Makes SHIBA INU Unique?
The SHIBA INU website invites dog-inspired artists from all over the world to foster the "artistic Shiba movement" as they bring their SHIBA INU community into the NFT market. SHIBA INU has also created a campaign using Amazon Smile in order to collect donations to escue real, live Shiba Inu dogs with the Shiba Inu Rescue Association.
After initially being only one meme coin of many, Shiba Inu skyrocketed to popularity after Vitalik Buterin famously burned his share of the SHIB supply. Ryoshi had given Buterin 50% of the SHIB supply, announcing that "as long as Vitalik doesn't rug us," Shiba Inu would be fine.
However, Buterin decided to burn 90% of his share, which later would have been worth billions thanks to the soaring value of SHIB. The remaining 10% were sent to a charity, as were about 50 trillion SHIB more that Vitalik had donated to a COVID-19 relief fund. He stated that he did not want "to be a locus of power" and thus gave the tokens away. This resulted in a temporary loss of value for SHIB, which the token later recovered from after the community agreed on an arrangement with the charity in question.
Ryoshi's goal for Shiba Inu has been to see if a perpetual decentralized organization could work with no central leadership. In a blog post, Royshi noted that the rift caused by Buterin's token donation made the community stronger and would enable it to distribute further and decentralize the movement. His vision for the core ecosystem is to perform its utility while the Shiba Inu-own stablecoin becomes the globalized exchange of value.
In October 2021, SHIB surged on the news of a possible Robinhood listing and briefly flipped Dogecoin to become the most-valued meme coin by market capitalization. Thus far, Robinhood has not listed SHIB, despite a petition with over 500,000 signatures calling for it. Robinhood executive Christine Brown has lauded the efforts of the Shiba Inu community, saying that one of her favorite things was seeing it engage with the community to make its wishes heard. However, Robinhood would prioritize safety over the "short-term gain" of a new token listing and has left Shiba Inu fans waiting since.
The October 2021 price surge famously minted a billionaire, as one wallet was uncovered that had bought $8,000 worth of SHIB in summer 2020, which was worth over $5.7 billion at SHIB's all-time high valuation. The wallet owner has not been determined, although the person appears to have sent parts of their fortune to other wallets several weeks after the price explosion.
The price surge also led to increased adoption across token holders. WhaleStats compiled data of the largest ETH wallets and found that SHIB represents over 20% of the combined market shares of all ERC-20 tokens held by Ethereum whales. CRO was a distant second with only 5%. SHIB also surpassed the one-million holder mark following its all-time high.
Moreover, retailers increasingly started adopting SHIB as a means of payment following its popularity among small-time investors. American electronics retailer Newegg added SHIB at the start of December 2021, partnering with crypto payments platform BitPay to unlock payments in SHIB. This followed the adoption of SHIB by over 500 merchants, according to payments firm CoinGate, with even Samsung-backed digital wallet provider ZenGo adding SHIB to its options and a restaurant in Paris accepting it as a payment option. At one point, the Shiba Inu community called for McDonald's to accept Shiba Inu, although the social media effort eventually fell short.
A major reason for the surging price of SHIB was a continued effort by the SHIB community to build a utility for the Shiba Inu token and the subsequent emergence of an entire Shiba Inu ecosystem.
ShibaSwap is the coin's designated DEX that started as a fork of Sushiswap that has, in the words of Ryoshi, its "own little twists and elements." Furthermore, Shiba Inu also plans to develop SHI, which will be the "global exchange of value for plebs," an algorithmic stablecoin pegged to one cent instead of one dollar as most other stablecoins. Its launch is planned after the Shiba layer-two solution called Shibarium, and Ryoshi envisions SHI to work in a similar way to DAI. That way, SHI would have collateral as a backstop that would push it back to one cent if the peg was lost.
According to Ryoshi, the end goal is that SHI becomes a global stable currency "that plebs across all countries are able to use as both a store of value and method of payment."
In addition to SHI, a financial ecosystem is planned, and SHI would be added as a weighted pool pair on Curve. In that case, Ryoshi expects forks of the major DeFi protocols to appear in the Shiba Inu ecosystem, which would require an immutable bridge to function.
Shiba would also start hosting localized meetups and a once-a-year ShibaCon convention that would be hosted at an easily accessible location in a country without oppressive visa restrictions "for the sake of inclusiveness for global plebs."
One immediate change Shiba Inu has implemented is increasing token burns, which have sparked renewed interest in the token at the beginning of 2022. Bigger Entertainment, a crypto record label selling merch, NFTs and concert tickets, organized a SHIB burn party that burned over 239 million SHIB over Christmas. In total, the team has burned almost one billion SHIB since the end of October.
SHIB: The Metaverse and Shibarium
While looking to expand the utility of SHIB, the development team introduced a metaverse — a virtual reality project powered by non-fungible tokens (NFTs). Here, users can mint parcels of digital lands using ETH or its equivalent amount in SHIB tokens. Interestingly, other Shiba Inu-related tokens – BONE and LEASH – will also play various roles as different phases of the metaverse come to life.
According to the team, the goal is to create a fun, immersive and interactive environment where users can explore, earn passive income and collect in-game resources. Importantly, the metaverse will allow users to develop and launch their own projects. In total, there are 100,595 plots of land on SHIB: The Metaverse. Of the total, 36,431 digital lands were unlocked on April 13, 2022 – the launch date of the introductory phase of the metaverse.

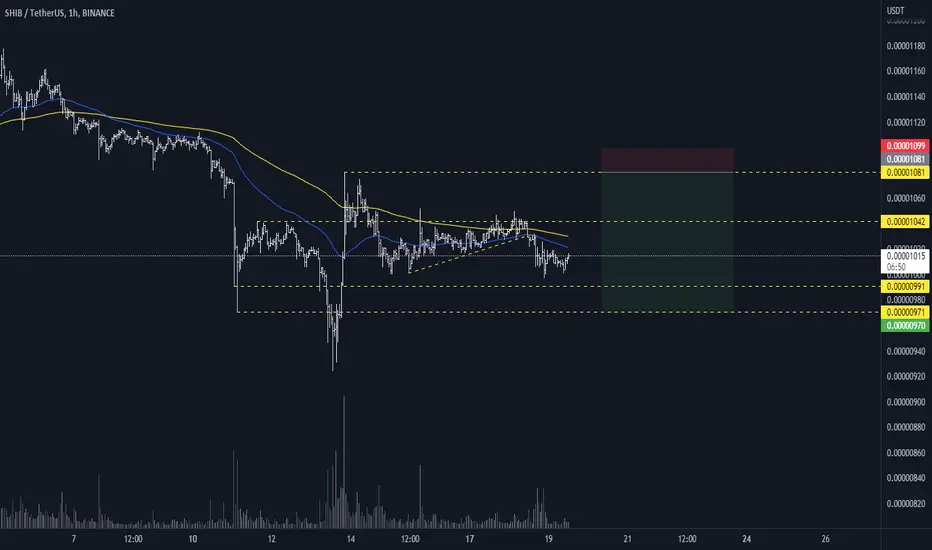
Shiba Inu SHIB 3 weeks ForecastOn November 8th we will have the Midterm Elections in the U.S.
I think we will see a 3 week rally ahead of the elections, followed by a sharp decline afterwards.
The small bull run should start this week!
SHIB/USDT
Entry Range: $0.00001000 - 0.00001100
Price Target 1: $0.00001210
Price Target 2: $0.00001375
Price Target 3: $0.00001690
Stop Loss: $0.00000869

📊🔥3 tagets for DOT: this trap force the alts to PUMP!Hi friends! I hope you follow my yesterday recommendation att least for scalping! Another swing trades you can open when the BTC show it's power.
✅ My recent plan for BItcoin in this video!
Now the price of DOT consolidating in the FALLING WEDGE and start to squeeze to the upper boundary. It's a nice signal for the bulls. I hope the value area of $6.20-6.50 will become the support for the price in the closest future.
📊 The preconditions to open a long:
✅ false breakout +volume indicator confirmation (volume bars growth)
🔥 pullback to $5.9-6
🔥 squeeze to the trendline
🔥 bullish BTC
✅ The volume indicator help you to understand where is the bottom or high. The biggest volume are always there. If you want to make more succesfull trades, use the DOM and Footprint tools for scalping. It helps to open a short and long with the whales (big players). As far as you understand, the whales are the most profitable traders at the market.
🚩 The targets are the 3 key levels of $7, $8, $9.65.
🔥Traders, set your sl at the breakeven when the price reach the 1st target. My recommendation is to book at least 50-60% of profit when the price reach the second target.
💻Friends, press the "boost"🚀 button, write comments and share with your friends - it will be the best THANK YOU.
P.S. Personally, I open an entry if the price shows it according to my strategy.
Always do your analysis before making a trade

🔥🚀NEAR make false breakout: STRONG BULLISH SIGNAL?Hi friends! NEAR make a DUMP together with another crypto yesterday. Hope you follow the scenario which I published yesterday, coz this manipulation were highly expected.
In this idea we will talk about the another possibility for you to open a trade on the pullbacks and make a profit.
✅ Before the longs, take a look to my previos idea about this altcoin. As I said in that idea, watch BTC. If it show you the bullish signal, all the altcoin go up. It's not happen.
NEAR reach all short targets after the breakout of the channel. Amazing entry point at the test the channel as the resistance. Congrats traders who get profit and close it`s shorts last 2 days.
📊 Now let's talk about my preconditions to open a long:
✅ false breakout of the key level+volume growth
🔥 some pullback to the key level of $2.9
🔥 squeeze to the trendline
🔥 bullish BTC
🚩 The targets:
1. $3.35-3.65 - the closest value area
2. $4.13-4.46 - the value area and strong resistance
3. $5.28 - the key level
🔥My recommendation is to book at least 50-60% of profit. Set your sl at the breakeven when the price reach the 1st target.
💻Friends, press the "boost"🚀 button, write comments and share with your friends - it will be the best THANK YOU.
P.S. Personally, I open an entry if the price shows it according to my strategy.
Always do your analysis before making a trade

SHIBA : Day trade updateMost of times shiba have an around increase price of 30% in best of times.
But there is no guaranty that Shiba can do this all time.
On day trade it seems interesting: same time its about the manage of risk in meme coin as this.

Tsuka bullish chart....Next SHIBTsuka continues to follow a repeating bullish pattern. The holder count is now past 7300 and has been rumored to be created by the SHIB creator Ryoshi. 3 million was added to liquidity and big BAYC whales are working together to share this project. Verlin and the MLP team is helping push this to new heights. Be ready for the next MEME coin to rule 2022. only 1 billion supply and a squeeze could push this to astronomical numbers. Rumors of T1 listings are swirling. $TSUKA will be the dragon to ignite the next bull run.

ETHW BOTTOM IS IN! NEXT RUN UP ABOUT TO START, ALL ABOARD!ETHW looks like its about to make its next run up. This will be wave 3 and the previous high around $14 will be a blip on the chart. I can see ETHW running to about $40 on this next run and possibly higher depending on how much attention it receives. I think the bottom was around $7.60 like I predicted in my previous chart which was major support. Invalidation of this idea would be a break of $7.50 and a close on at least a 4 hour. If that happens then I would expect a move down to next support around $5 with wicks down to about $4. At that point we will revisit and re-evaluate. I dont think this will happen though, I think ETHW has found its bottom on this wave 2 correction. This is not trading or financial advice this is just my opinion. Thank you and if you like my work, please support me by giving me a boost and follow me. Good luck out there everyone.
This was my previous charts showing the move that was just completed.
