NFTY/USD THE SLEEPING GAINT ..Today we did a new study to possibly increase coins from the sleeping trends.. and we found out that this coin NFTY can show new volume since the activation, we will follow the coin, and if there is new trends we will update it soon.
expect that this coin can show good results.
The coin has seen long time a breakdownwn, since this week a new trend looks about to start with new volume.
Shib

SHIBUSDT.1DIn my technical analysis of the SHIB/USDT daily chart on Binance, I focus on the trend behaviors and key indicators that could provide insights into future price actions.
The chart reveals a volatile journey for SHIB/USDT, particularly noticeable in the sharp spike and subsequent fall during early 2024, characterized by point A on the chart. This volatility has since tapered into a descending triangle pattern, indicating a potential continuation or reversal could be forthcoming.
Firstly, let's consider the support (S1) and resistance levels (R1, R2). Currently, the price has stabilized near a critical support level (S1) at approximately $0.00000853. This level is crucial as it has historically acted as both support and resistance, suggesting a strong psychological price point for traders.
Resistance levels are identified at $0.00002019 for R1 and higher at $0.00004567 for R2. Overcoming these levels would require significant bullish momentum, likely driven by broader market trends or specific catalysts affecting SHIB.
The Relative Strength Index (RSI) is near the 50 mark, indicating neither overbought nor oversold conditions. This neutrality suggests a potential for either movement direction, depending heavily on market sentiment and upcoming news or events that could sway investor behavior.
The MACD, while currently below the signal line, shows signs of converging. A crossover above the signal line could be a bullish indicator, suggesting an increase in upward momentum. However, the histogram reflects minimal momentum in either direction, reinforcing the current market uncertainty.
Given this analysis, the immediate strategy would be to watch for a decisive break either above R1 or below S1. A break above R1 could suggest a potential trend reversal, targeting further resistance at R2. Conversely, a fall below S1 could confirm the continuation of the bearish trend, potentially leading to new lows.
In conclusion, my focus will remain on these critical thresholds (S1 and R1), monitoring for significant price movements that could indicate a larger trend change. The balance between observing technical signals and staying informed on market-wide influences will be essential in navigating SHIB/USDT’s future movements effectively.

Shiba Inu Coin: Is a Bullish Breakthrough Imminent?BINANCE:SHIBUSDT has shown notable bullish momentum on the 4-hour chart, suggesting potential upward movements in the near term. Recent closing prices indicate a gradual upward trend, with the latest closing price at $0.00001647.
Exponential Moving Averages (EMA) reflect this positive sentiment. The 9 EMA is currently above the 20 EMA, indicating a bullish trend. This alignment suggests that the short-term momentum favors buyers, with the 9 EMA values showing a steady increase, reflecting recent upward price movements.
Meanwhile, the Moving Average Convergence Divergence (MACD) indicator also supports this bullish outlook. The MACD line is above the signal line, with the histogram consistently positive. This configuration indicates that buying pressure is outweighing selling pressure. It also reinforces the potential for continued upward movement.
Relative Strength Index (RSI) values oscillate around the mid-50s, slightly favoring the bullish side without being in overbought territory. This suggests that there is room for further upward movement before any potential reversal or correction.
Key resistance levels to watch include $0.00001659, which is the immediate resistance level. A break above this could pave the way for further gains. The $0.00001714 level is critical, and if the Shiba Inu coin manages to surpass this, it may test even higher levels. Breaking $0.00001731 would confirm a strong bullish trend, likely leading to significant price increases.
On the downside, $0.00001550 serves as the immediate support level. If SHIB pulls back, it may find buyers around this level. The $0.00001309 level is a more substantial support that could provide a strong base in case of a broader market correction.
For potential trading strategies, traders could consider entering a long position if the price breaks above the $0.00001659 resistance level with strong volume. Potential exits could be near the $0.00001714 and $0.00001731 levels. Tightening stops as the price approaches these levels can help protect profits.
On the other hand, a short position might be considered if the price fails to break above $0.00001659 and shows signs of bearish reversal. Covering the short position around the $0.00001550 support level could be prudent. A break below this level might target the $0.00001309 support.
In conclusion, SHIB shows promising bullish signals with critical resistance levels in sight. Traders should monitor these levels closely and adjust their strategies accordingly to capitalize on potential price movements.

XAR/USDT THE NEXT HYPE COIN SPOT INCREASE 4xXARUSDT shows since today a volume confirmation, which can get a confirmation in the coming time frame.
This spot coin has a high possibility of breaking soon. our expectation for this coin in the coming time $0,20
We will follow the market and see what XAR can do with volume .
This coin is found after our spot study to a coin that can show new possibilities in price action.
This coin has a high-risk/reward star
The coin has seen a breakdown history until today some volume trends seem to have changed to positive which could build a new cycle to an uptrend.
There is a good chance this coin can show a break up $0,10 soon.

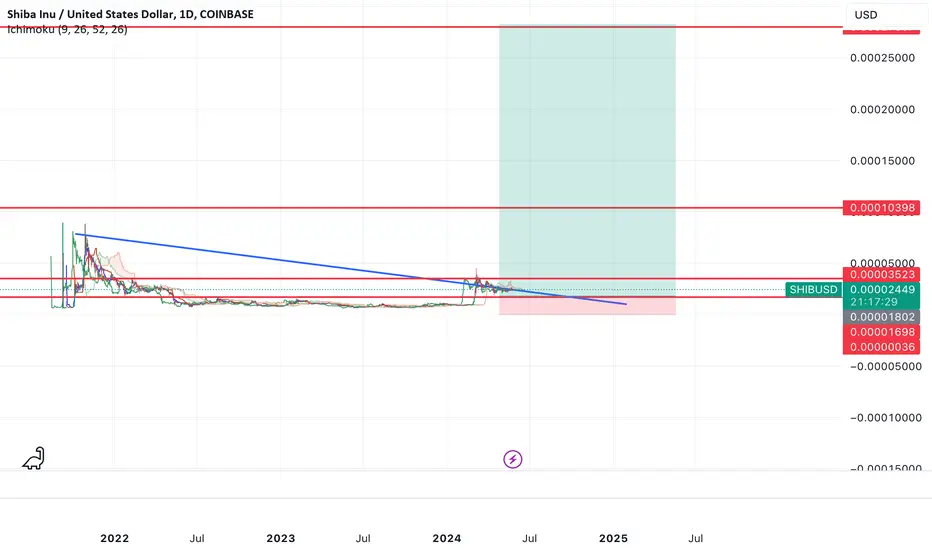
The decline of Shiba Inu is not yet complete.I personally don't trade Shiba Inu, but for those who follow the "Shib," it might be useful to know where the orders are on Coinbase. The approximate downside targets can be seen on the chart and in the order book screenshot from Coinbase.
#Shib #ShibaInu

SHIB RocketsSHIB is exhibiting strong bullish momentum, with recent price action reflecting a rapid ascent. Key indicators point to robust buying pressure, but significant resistance levels could test the strength of this uptrend.
Technical Insights
1. Support and Resistance Levels:
• Immediate Support: SHIB has strong local support around $0.00001550. Maintaining above this level is critical for continued upward movement.
• Immediate Resistance: The price is approaching solid resistance at $0.00001625. This level could push the price back for a while before any further gains.
• Solid Support: If a pullback occurs, solid support lies at $0.00001450, which could act as a foundation for another rally.
2. Momentum Indicators:
• Stochastic Oscillator: Both %K and %D lines are in the overbought territory, suggesting that a pullback or consolidation might be imminent before the next upward move.
• Relative Strength Index (RSI): The RSI is above 70, indicating overbought conditions. This could lead to a short-term correction or consolidation period.
3. Moving Average Convergence Divergence (MACD):
• The MACD is positive, with a bullish histogram, indicating continued upward momentum. However, the market may see some short-term fluctuations.
Most Probable Market Scenarios
1. Bullish Continuation:
• If SHIB can break and hold above the immediate resistance at $0.00001625, the next target could be higher resistance levels, potentially around $0.00001800.
• Sustained buying pressure and high trading volumes would support this scenario.
2. Pullback and Consolidation:
• Given the overbought conditions indicated by both the RSI and Stochastic Oscillator, a pullback to around $0.00001550 or even $0.00001450 could occur. This would provide a healthier base for future gains.
• Maintaining above these support levels is crucial for preserving the bullish outlook.
Outlook
SHIB is in a strong uptrend with bullish momentum. Traders should watch for potential pullbacks to key support levels, which could present buying opportunities. Breaking through the $0.00001625 resistance will be pivotal for continued upward momentum towards higher targets.
Summary:
• Short-term: Bullish but watch for potential pullbacks due to overbought conditions.
• Mid-term: Holding above $0.00001550 support is key; breaking above $0.00001625 could target $0.00001800.
• Long-term: Sustained bullish momentum depends on overcoming significant resistance levels and maintaining high RSI.

SHIB Flashing a SELL (⊙_⊙)I've been bearish on SHIB since the failed pennant pattern:
We just got a "SELL" alert from the technical indicator in the weekly timeframe. The higher the timeframe, the more significant the pattern / alert.
Watch the BTC on what w need to see after a "SELL" alert to consider this situation turning ack to the upside:
_________________________
BINANCE:SHIBUSDT

Alikze »» CAKE | Dynamic trigger failure and pullback completionIn time 1W, after a zigzag correction, it will have the ability to rise to the targets specified in the chart by breaking the dynamic trigger and pullback to it by breaking the most important neck line resistance. According to the current motivational wave, this step can be fast. But its first supply zone will be in the range of 4.8 to 5.4 dollars.
»»»«««»»»«««»»»«««
Please support this idea with a LIKE and COMMENT if you find it useful and Click "Follow" on our profile if you'd like these trade ideas delivered straight to your email in the future.
Thanks for your continued support.
Sincerely.❤️
»»»«««»»»«««»»»«««

Alikze »» SHIB | Bullish Flag🔍 Technical analysis: Bullish flag in corrective zigzag wave 4
According to the analysis presented in the previous post, wave 3 or rising C in the area of 2.618 Fibo of the previous wave itself was completed.
💎 But now in the 1D time frame a bullish flag is formed in the form of wave 4 zigzag.
After exiting the congestion and descending channel in the supply range, it has faced selling pressure.
💎 Therefore, it can be offered after the pullback to the broken structure in the liquidity range by successfully collecting liquidity to break the zone.
💎 In addition, if the candle closes to the sub-zone in the daily time, the bullish scenario will be invalid and should be re-examined and updated.
»»»«««»»»«««»»»«««
Please support this idea with a LIKE and COMMENT if you find it useful and Click "Follow" on our profile if you'd like these trade ideas delivered straight to your email in the future.
Thanks for your continued support.
Best Regards,❤️
Alikze.
»»»«««»»»«««»»»«««

Alikze »» TURBO | 4H descending channel🔍 Technical analysis: Moving in the descending channel
- The daily frame time is moving in an upstream channel.
- But in the 4H frame time, there is a corrective form that is moving within a downtrend.
- This correction can first touch the range of 0.003052 if it is below the supply area and can extend this correction to the middle of the channel if continued.
💎 Alternative scenario: Also, if it can break the 0.0061 area, it could form an upward flag pattern that can continue the uptrend and continue its growth channel as much as the channel supply.
If the behavior and structure of the post will be updated, it will be updated.
»»»«««»»»«««»»»«««
Please support this idea with a LIKE and COMMENT if you find it useful and Click "Follow" on our profile if you'd like these trade ideas delivered straight to your email in the future.
Thanks for your continued support.
Best Regards,❤️
Alikze.
»»»«««»»»«««»»»«««

SHIBUSDT.1DUpon analyzing the daily chart for SHIB/USDT, I have identified several critical elements that provide insight into the current market condition and potential future price movements.
Technical Analysis Observations:
Support and Resistance Levels (S1, R1, R2):
Support Level 1 (S1): At approximately $0.00001057, this level has been a significant support zone. It marks a crucial floor that, if breached, could signal further declines.
Resistance Level 1 (R1): Positioned at $0.00002019, this is the immediate resistance level. A break above this could indicate the start of a bullish correction.
Resistance Level 2 (R2): Located at $0.00003000, this higher resistance level would be a more extended bullish target.
Trend Indicators:
The descending trendline marked by R1 and R2 highlights the overall bearish trend. A break above this trendline would be a strong indicator of a potential trend reversal.
The recent price action shows the price testing lower support levels, indicating persistent selling pressure.
RSI (Relative Strength Index):
The RSI is currently at 39.62, suggesting that while the asset is not in the oversold territory, it is approaching levels where a reversal could be expected if buyers step in.
MACD (Moving Average Convergence Divergence):
The MACD lines are below the signal line, and the histogram is negative, indicating ongoing bearish momentum. However, the MACD lines are flattening, which could suggest a potential reduction in bearish momentum and an upcoming crossover.
Conclusion:
The SHIB/USDT pair is at a critical juncture, testing significant support at $0.00001057. The RSI nearing oversold levels and the flattening MACD suggest the possibility of a short-term rebound. However, the prevailing bearish trend underlined by the descending trendline and MACD requires caution.
For trading strategies, one could wait for a confirmation of reversal signals, such as a bullish RSI divergence or a MACD crossover. A break above the immediate resistance at $0.00002019 would provide a stronger confirmation for a bullish reversal, targeting $0.00003000. Conversely, a break below the support at $0.00001057 would indicate further downside, necessitating close monitoring for new support levels.
Implementing risk management strategies, such as setting stop-loss orders just below the support levels and taking profits near resistance levels, is crucial in managing potential risks and optimizing gains in such a volatile market. Monitoring external market factors and news that could influence price action is also essential.

$BOME | Here is another 10-20x meme coinIf you remember CRYPTOCAP:PEPE , we made 20x profit from it📈
Here is another 10-20x meme coin. Check out ECONOMICS:BOME if you're ready to take a small risk. It can give us multiple x return!
Like Pepe and Shib, it also listed on binance with a billion dollar market cap and we saw a big selling pressure after listing!
After a big dump there will be a few weeks of accumulation. Then we may see the expansion move 📈
Meme token is very high risky so go with small investment!
ECONOMICS:BOME DCA Level : 0.0060 - 0.0040 - 0.0025
Target : 5x 10x 15x 20x
#Dyorrr
IF YOU LIKE THIS POST PLESE DO FOLLOW & BOOST. THANK YOU.

SHIBAINU - Starting a new Bullish Move ? (READ THE CAPTION)By examining the #ShibaInu chart on the weekly timeframe (logarithmic), we observe that after an attractive growth, this cryptocurrency has again undergone a correction. We should soon expect the end of this correction and the beginning of the next bullish wave. Keep an eye on these prices: 0.00001542, 0.00001385, and 0.00001248. The new wave will likely start its next move after correcting to 1542. (This analysis will be updated)
Please support me with your likes and comments to motivate me to share more analysis with you and share your opinion about the possible trend of this chart with me !
Best Regards , Arman Shaban

Potential Bullish Reversal for SHIB Shiba InuIf you haven`t bought SHIB before the breakout:
Nor sold the top:
Now upon analyzing the chart pattern of SHIB Shiba Inu, it appears that a falling wedge formation is currently in play. This pattern is characterized by converging trendlines sloping downward, with a series of lower highs and lower lows. In technical analysis, a falling wedge is typically interpreted as a bullish reversal pattern.
The falling wedge on SHIB suggests that despite recent declines, there is potential for a bullish breakout. As prices continue to oscillate between narrowing support and resistance levels within the wedge, there is anticipation among traders and investors for a potential upward movement. This pattern often signals a gradual weakening of selling pressure and a potential shift towards buyers gaining control.

SHIBUSDT.1DThe SHIB/USDT pair, as shown on the daily chart, trades at $0.00001655, demonstrating a significant bearish trend with a recent decline in value by approximately 5.59%. The trading environment has been largely bearish over the past months, following a failed breakout above earlier resistance levels.
Key Support and Resistance Levels:
Resistance 1 (R1): $0.00002155 - This level marks a recent high that SHIB failed to surpass, forming a clear resistance zone.
Support 1 (S1): $0.00001413 - This is a critical support level where previous lows have converged, potentially serving as a stabilization point if bearish momentum continues.
Technical Indicators:
MACD: The Moving Average Convergence Divergence (MACD) is currently below the signal line and has moved into negative territory, indicating increasing bearish momentum.
RSI: The Relative Strength Index (RSI) is at 31.71, nearing the oversold territory, which may suggest that SHIB is under substantial selling pressure but could also indicate a potential reversal if it moves further into oversold conditions.
Analysis Conclusion:
The current technical setup suggests that SHIB is experiencing strong bearish pressure, with the potential for further downside if it breaks below the support level at $0.00001413. The proximity of RSI to the oversold region might slow down the selling momentum, possibly leading to a short-term bounce or consolidation. However, unless SHIB can reclaim higher levels above the current resistance at $0.00002155, the overall market sentiment remains bearish.
Investors should watch for any movement that breaks out of the current trading range as a signal for potential trend reversals or continuations. Given the negative momentum indicated by the MACD and the critical support levels outlined, the strategy should be cautious, prioritizing risk management and staying alert for any signs of a change in market dynamics.

Alikze »» DOGE | Ready to defeat the PRZ zoneAccording to the previous analysis in the currency post that was mentioned, it faced a negative reaction in the second PRZ area and corrected according to the movement path to the specified areas.
💎 But now, due to returning from the specified area, it has attacked PRZ again with a good momentum.
💎 Therefore, this return wave can break the area for the next target, which is the supply area, if it can return in the specified area.
💎 In addition, if this pattern is completed, it can form a data valley, which can continue the path according to the previous post after completing the last log.
💎 Alternative scenario: in case of a break, the green box area can continue to be modified until the next area, which should be reviewed and updated again.
»»»«««»»»«««»»»«««
Please support this idea with a LIKE and COMMENT if you find it useful and Click "Follow" on our profile if you'd like these trade ideas delivered straight to your email in the future.
Thanks for your continued support.
Sincerely.❤️
»»»«««»»»«««»»»«««

Alikze »» PEPE | Support of the bottom of the ascending channelAt 8h, it is in the trading range area, which has good reactions to the supply and demand areas.
💎 Currently, it is moving to the supply zone in an upward channel, which has faced a temporary correction after the negative reaction to the zone. But if it maintains the area of 0.00000894, it can break the supply area and continue its growth until the next supply area.
💎 Alternative scenario: In addition, if the bottom of the channel breaks the indicated area, it can continue to correct the demand area.
»»»«««»»»«««»»»«««
Please support this idea with a LIKE and COMMENT if you find it useful and Click "Follow" on our profile if you'd like these trade ideas delivered straight to your email in the future.
Thanks for your continued support.
Sincerely.❤️
»»»«««»»»«««»»»«««

SHIB - This Indicator says SELLSHIB has just flashed a dangerous "SELL" alert.
This indicator is highly accurate in higher timeframes, especially the weekly. Look at all the "SELL" signals and how far the price drops after:
From a trendline perspective, SHIB HAS to stay ABOVE the current support line (Fibonacci line 0.236). If it falls under, SHIBA will be at risk of falling to the dotted line, which is BEARISH.
In case you missed it, my take on Bitcoin for the SHORT TERM:
________________________
BINANCE:SHIBUSDT

SHIBSHIB sweep the swing low to moving upside. Shib chart showing some upside movements.
So SHIB moving upside possible. SHIB reach 0.00001920 usdt to moving downside possible.

SHIBUSDT.1DIn this technical analysis of the SHIB/USDT daily chart, we explore the recent price movements and use key technical indicators to forecast potential future trends.
Key Observations:
Current Price and Recent Movement:
SHIB/USDT is trading at a price of $0.00001854, showing a moderate increase of 2.49% today. This suggests a possible change in market sentiment or response to external stimuli.
Support and Resistance Levels:
R1 (Resistance Level 1): $0.00001825 - It's noteworthy that the current price has surpassed this level, indicating a potential new support if the price sustains or advances further.
R2 (Resistance Level 2): Marked on the chart but not numerically identified, this would be the next target for bullish momentum.
S1 (Support Level 1): Marked around a previous low (exact value not visible), serving as the primary support area to watch if a reversal occurs.
Technical Indicators:
MACD (Moving Average Convergence Divergence): Currently below the zero line but the histogram suggests decreasing negative momentum, indicating a possible bullish reversal in the making.
RSI (Relative Strength Index): At 31.26, it's nearing the oversold territory, which might attract buying interest as traders perceive it as undervalued.
Analysis and Conclusion:
The current trading pattern in SHIB/USDT reflects a slight bullish recovery, indicated by the price crossing above R1. If the market sustains this rally, R2 could be the next logical target. The improving MACD, moving from deeper negative territories towards the baseline, supports this bullish outlook as it often precedes a change in trend.
However, the RSI near the oversold boundary suggests that while immediate selling pressure might be subsiding, caution is still warranted. A retest of the new support level at R1 (previously R1 resistance) could confirm its reliability for maintaining the upward momentum.

$SHIB the memecoin for this cycle?My thesis for this next move higher is that Solana coins are done and Ethereum coins are in.
Because of that, I think SEED_DONKEYDAN_MARKET_CAP:BONK sees one more exit pump and then CRYPTOCAP:SHIB becomes the memecoin for this cycle (Ethereum based).
I think there's a possibility of one more retest of the lower support before the move higher starts, but once it does, I think there's 15x upside potential to the top resistance.
Let's see what happens.
SHIB: buy📊Analysis by AhmadArz:
🔍Entry: 1875
🛑Stop Loss: 1728
🎯Take Profit: 2009 - 2137 - 2334
🔗"Uncover new opportunities in the world of cryptocurrencies with AhmadArz.
💡Join us on TradingView and expand your investment knowledge with our five years of experience in financial markets."
🚀Please boost and💬 comment to share your thoughts with us!

(SHIB) shiba inuIs Shiba Inu going to fall all the way to 0.000014 or is this as low as the price is willing to go and will hold after falling beneath the most recent support line?
