SHIBUSDT is holding better than others!SHIBUSDT the bounce back from POC point of control volume profile is still holding but Huge supply is found at 0.00001270 price levels.
We should see another bounce at 0.00001050 demand area.
Shiba

$Shib Inverse Head and Shoulders Pattern FormingI’ve been seeing the inverse head and shoulders pattern forming since June. If thesis is valid, and BTC doesn’t take the entire crypto market down with it, we might see a recover to the 2 levels.
FTX:SHIBUSD

Shiba daily swings the white channel was the daily up trend channel, after reaching the the ath in the channel price drops to the first correction point. correction will happen to the level which the 0.618 Fibo projection level shows end of the down trend in red channel. time and price are exactly showing the same point. this is a an original method for analyzing market movement.

Shiba Inu SHIB short Entry Range, Take Profit and Stop LossSHIB/USDT short
Entry Range: $0.00001100 - 0.00001200
Price Target 1: $0.00001000
Price Target 2: $0.00000831
Price Target 3: $0.00000722
Stop Loss: $0.00001367
the short at $0.00003355

Best opportunity to buy SHIB (Shiba Inu)Shiba Inu in corrections and after breakout the triangle, rise to $0.00002.
It's best opportunity to buy 1000shib, Don't miss it.

SHIBUSDT 6H TA; Break TrendLineAccording to the chart, the upward trend line has been successfully broken and the pullback is being completed, if it crosses the resistance range specified in the chart, it is suitable to enter. Otherwise, we will have correction.
Its not Buy or Sell SIGNAL
DYOR
BY : Mohamad Teriz - @AtonicShark

Ichimoku Analysis for SHIBWill long SHIB once out of the cloud and the resistance line. Will reach 0.00002 as first tp.

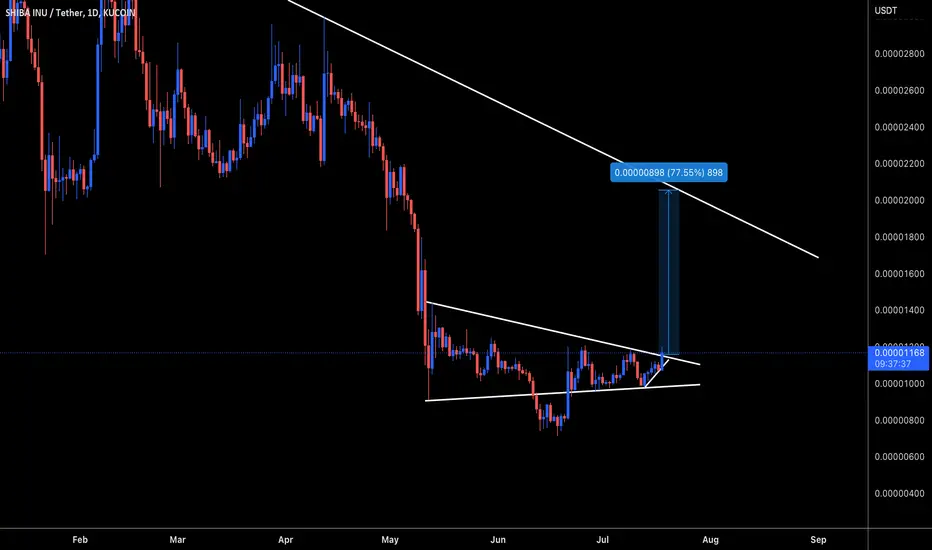
SHIBBA Potential 70%...Possible Potential 77% gain on SHIBA!
Whats your thoughts ? It is all about calculated risk for a rewards. Be sure to use stop losses under last structure. Also do not OVER leverage if your are planning to leverage trade.
SHIB/USDT: Bullish reversal on going---- Mid-term Analysis for the next coming 4 weeks to 3 months - Daily on Daily Chart (LOG)-------
SHIB/USDT: Bullish reversal on going
Context
The Global Crypto market leads by BTC and ETH is still evolving within a bearish market configuration. Like the others digital asset Shiba Inu (SHIB) is suffering about negative global market situation, and with a massive total supply of 1,000,000,000,000,000 (55% of the supply in circulation) it is hard to see a fondamental bullish pressure to be set from the supply management.
Main ressources
Coin Market cap (Supply) =>https://coinmarketcap.com/currencies/shiba-inu/
Shiba Token (Website) = > shibatoken.com
Market configuration
- Graphical Elements :
Graphical Resistance = 0,00001570/1930 & 0,00002840
Graphical Support = 0,00000950
- Mathematical Indicators:
EMA ( Exp Moving averages) are support = Bullish
RSI indicator (below) is reintegrating 50% = Bullish
- Elliot & Harmonic Wave (Fibonacci):
Fibonacci Target c B hasn't been already reached = 0,00000685
Fibonacci support of the wave (ii) = 0,00000950
Fibonacci Bullish Target = 0,00001930 & 0,00002840
Conclusion
Prefered case => As long as 0,00000950 remains support a further rise towards the upper part of the bearish channel at 0,00001570 before 0,00001930. After having reached those target a larger rise will be confirmed

Shiba Inu Is Set For Exponential Growth (70% Short-Term)By short-term we mean within a month (within 4 weeks).
When we say mid-term we are talking about a 1-3 months time window.
And finally, long-term can be 3-12 months...
But these are just approximation, we spot trend-reversals, buy and hold and let the market take care of the rest.
The waiting time can be one day, 1 week or 6 weeks it makes no difference because we only close a trade if it goes below the stop-loss.
Shiba Inu (SHIBUSDT) closed yesterday above EMA50 ("conquered" this level) and now it is time to grow.
We are looking at 70% potential profits short-term.
After we hit this target, we share a new analysis to see what comes next.
But very likely we get a correction/retrace.
Each time a strong resistance level is tested/challenged a correction takes place.
This is normal price action.
Namaste.

INVERSE HEAD AND SHOULDERS ON SHIB, 50% PUMP COMINGCheck this bullish pattern shib has broken out of with a 50% uprise coming in !!

Trading opportunity on the SHIBUSDTBased on technical factors there is a long position in :
📊 SHIBUSDT Shiba Inu
🔵 Long Now 0.00001223
🧯 Stop loss 0.00001030
🏹 Target 1 0.00001430
🏹 Target 2 0.00001750
🏹 Target 3 0.00001999
💸Capital : 1%
We hope it is profitable for you ❤️
Please support our activity with your likes👍 and comments📝

SHIBUSDT - Head and Shoulders PatternSHIBUSDT (1D Chart) Technical analysis
SHIBUSDT (1D Chart) Currently trading at $19.75
Buy level: Above $0.0000120
Stop loss: Below $0.00000943
Target 1: $0.0000142
Target 2: $0.0000185
Target 3: $0.0000220
Target 4: $0.0000289
Max Leverage 2x
Always keep Stop loss
Follow Our Tradingview Account for More Technical Analysis Updates, | Like, Share and Comment Your thoughts

SHIBUSDT 1D Shiba token price chart shows growth prerequisitesBefore you is the global chart of the SHIBUSDT trading pair
As you can see, the previous Shiba price pump ended in November 2021 and since then the price has been in an 8-month downtrend.
Due to this drop, the Shibainu price returned directly to the liquidity zone , where in 2021, for several months, were gained long positions before the pump by +1200%
Since the SHIBUSD price spent less time in the liquidity zone in June 2022, growth should be expected to be weaker than in 2021.
However, looking at the chart, it seems to us that in the near future a completely real x2 growth - from $0.00001050 to $0.00002100
When trading this coin, you should understand one fact - it is a very speculative asset. Therefore, it is worth setting adequate take profits in order to take the profit that the market is giving at the moment. And also you can move the stop to an upward position during the price growth.
Because, as we can see, it is not a problem at all for a SHIBUSDT trading pair to drop in price by -92%. So that you do not bite their elbows after, which seen great profits, but fixed at best +10-20% and got a traumatized psyche as a gift.
_______________________________
Since 2016 , we have been analyzing and trading the cryptocurrency market.
We transform our knowledge, trading moods and experience into ideas. Each "like under the idea" boosts the level of our happiness by 0.05%. If we help you to be calmer and richer — help us to be happier :)

$BTC Important TA : Please READ THE CAPTION Well, we saw that price did not break the $18,800 support and did not even come close to it ! We had a change in the character (CHoCH) in the range of 20K, which was confirmed by the correction yesterday, then we had a BMS at $20400, an important point that should be considered is that if the price reaches the range of 21100 $ up to $22,000, what reaction will he show to it, because this movement can determine the trend of the next week. Because if you look carefully, an appealing liquidity pool has been formed above the High of last week , LWH ($22,500), As you know, all macroeconomic factors are currently against the upward trend of this market, and we should not forget this importance!
Follow us for more analysis & Feel free to ask any questions you have, we are here to help.
⚠️ This Analysis will be updated ...
👤 Arman Shaban : @ArmanShabanTrading
📅 07.16.2022
⚠️(DYOR)
❤️ If you apperciate my work , Please like and comment , It Keeps me motivated to do better ❤️

SHIBUSDT 2D MOVEMENTOK! after the bounce back of btc we are see that alts like shiba,atom,... have nice performance for the long position so I track the SHIB for a long opportunity and I take it in the mid of price movement I put my SL under the last bearish candle and draw a trend line to see how to react shiba to it , but there is a point before that price reach the demand zone shiba had divergence I should take that on that time but I missed it , if any of u could take it GOOD LUCK :D

SHIB - Second Chance to Board the SHIB TrainIf you missed the rise of SHIB the first time, here's your chance to get in on the bottom floor. SHIB is bouncing off a level it hasn't seen since before its meteoric rise back in October of last year. Breaking out of a falling wedge above this support level makes this a great entry for the next up leg in my book. I'm long.

!!! SHIBA !!! - Elon Musk Zone ... Time to buy!Hello,
Do like Elon Musk buy cheap.
This is just an idea!
Take care!


Shiba is safe ...✅Hello to all 😊 This plan is based on my own mental model and is completely personal, the range of 1000 is a psychological number, as I have said many times before, in this range the slope is constantly fluctuating and can eventually grow beautifully. It is safe to say that this area is consolidating and eventually we will never see these low prices, my best advice to you is to buy to make a good profit.


The Best and Profitble Coin. We All are Waiting the PumpShib Shib Shib Shib....
What can we say about it.
It's very interesting coin and it can make a real pump with all market after the summer
So we have to check it and buy for long
Add it to your watching list
Have a nice trading and best wishes!

Trading opportunity on the SHIBUSDTBased on technical factors there is a long position in :
📊 SHIBUSDT Shiba Inu
🔵 Long Now 0.00001105
🧯 Stop loss 0.00001050
🏹 Target 1 0.00001180
🏹 Target 2 0.00001280
🏹 Target 3 0.00001380
💸Capital : 1%
We hope it is profitable for you ❤️
Please support our activity with your likes👍 and comments📝
