SHIB/USDTIts good for spot!
A memecoin that all of you know it!
2 step is logical for buying according to DCA !
stoploss will be activated if daily close seen under the last step...
Shibainu

SHIBAINU - Starting a new Bullish Move ? (READ THE CAPTION)By examining the #ShibaInu chart on the weekly timeframe (logarithmic), we observe that after an attractive growth, this cryptocurrency has again undergone a correction. We should soon expect the end of this correction and the beginning of the next bullish wave. Keep an eye on these prices: 0.00001542, 0.00001385, and 0.00001248. The new wave will likely start its next move after correcting to 1542. (This analysis will be updated)
Please support me with your likes and comments to motivate me to share more analysis with you and share your opinion about the possible trend of this chart with me !
Best Regards , Arman Shaban

Cardano Daily TA : Support Levels and Potential Mid-Term TargetsBy examining the #Cardano chart on the daily timeframe, we observe that the price is trading in the 40 cent range. If the price can maintain the support zone of $0.35 to $0.385, we can expect further growth to higher targets for this attractive cryptocurrency. The medium-term targets for Cardano will be $0.42, $0.45, $0.51, and $0.58, respectively. The expected return in the medium term is between 15% to 40%!
Please support me with your likes and comments to motivate me to share more analysis with you and share your opinion about the possible trend of this chart with me !
Best Regards , Arman Shaban

Bitcoin Weekly TA : Bitcoin Poised for Next Bullish Run (READ)By analyzing the Bitcoin chart on the weekly (logarithmic) timeframe, we observe that, as expected, the price corrected to $58,400 and encountered buying pressure. Currently, Bitcoin is trading around $63,000, having increased by 9%. If the price can stabilize and close above $63,300 this week, we can expect the start of the next bullish trend. Based on previous analyses, the mid-term targets for Bitcoin are $72,000, $77,000, $85,000, and $100,000.
Please support me with your likes and comments to motivate me to share more analysis with you and share your opinion about the possible trend of this chart with me !
Best Regards , Arman Shaban

Potential Bullish Reversal for SHIB Shiba InuIf you haven`t bought SHIB before the breakout:
Nor sold the top:
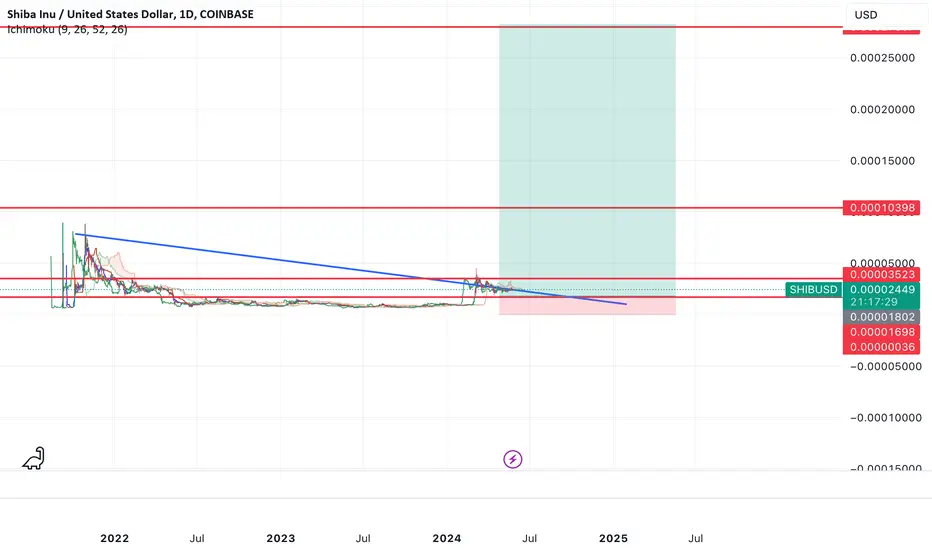
Now upon analyzing the chart pattern of SHIB Shiba Inu, it appears that a falling wedge formation is currently in play. This pattern is characterized by converging trendlines sloping downward, with a series of lower highs and lower lows. In technical analysis, a falling wedge is typically interpreted as a bullish reversal pattern.
The falling wedge on SHIB suggests that despite recent declines, there is potential for a bullish breakout. As prices continue to oscillate between narrowing support and resistance levels within the wedge, there is anticipation among traders and investors for a potential upward movement. This pattern often signals a gradual weakening of selling pressure and a potential shift towards buyers gaining control.

SHIBUSDT Technical Analysis in Daily Timeframe.Hello everyone, I’m Cryptorphic.
For the past seven years, I’ve been sharing insightful charts and analysis.
Follow me for:
~ Unbiased analyses on trending altcoins.
~ Identifying altcoins with 10x-50x potential.
~ Futures trade setups.
~ Daily updates on Bitcoin and Ethereum.
~ High time frame (HTF) market bottom and top calls.
~ Short-term market movements.
~ Charts supported by critical fundamentals.
Now, let’s dive into this chart analysis:
SHIB/USDT is currently experiencing bearish momentum within a descending parallel channel. Key support lies around the historical support level and the channel's lower boundary.
The RSI indicates that the asset is oversold, suggesting a possible reversal or a corrective bounce in the near term.
Key Elements
~ Trend Channel: Descending channel with lower highs and lower lows, indicating bearish momentum.
~ Support: Initial support around the $0.000017000 area, tested multiple times, and lower support at $0.000013000.
~ Moving Average: Hovering around the 200-day moving average is crucial for potential resistance. A breakout above this resistance will likely indicate a rally toward $0.0000234.
~ Bullish Divergence: RSI is crucial at 31.12 in oversold territory, with potential bullish divergence suggesting a possible trend reversal.
Best entry for spot holding on SHIB: $0.000015 to $0.000013.
Mid-term Targets: $0.0000262 to $0.000043.
DYOR. NFA.
Please hit the like button to support my content and share your thoughts in the comment section. Feel free to request any chart analysis you’d like to see!
Thank you!
#PEACE

Trading opportunity for BONEUSDT (Long term)Based on technical factors there is a Buy position in :
📊 BONEUSDT
🔵 Buy Now
🪫Stop loss 0.440000
🔋Target 1 0.711000
🔋Target 2 0.953000
🔋Target 3 1.418000
💸RISK : 1%
We hope it is profitable for you ❤️
Please support our activity with your likes👍 and comments📝

GTAI/USDT 4-Hour Chart Analysis : Bull or Bear ? (READ)By checking the GTAI/USDT chart in the 4-hour time frame, we can see that since last week, due to the heavy fall of Bitcoin to $58,000, the entire crypto market began to fall, and GT Protocol was no exception to this. The range of 78 cents is being traded and we will probably see the growth of this crypto again by collecting liquidity below 75 cents! Possible targets will be 0.8150, 0.85 and 0.91 respectively!
Please support me with your likes and comments to motivate me to share more analysis with you and share your opinion about the possible trend of this chart with me !
Best Regards , Arman Shaban

SHIB/USDT Analysis: Key Levels to BUY (READ CAPTION)By analyzing the #Shiba chart on the weekly (logarithmic) time frame, we can see that after a significant rally, this cryptocurrency has undergone a correction. We should soon expect the end of this correction and the start of the next upward wave. Keep an eye on these levels: 0.00001542, 0.00001385, and 0.00001248! Additionally, the price might fill its previous FVG before starting a strong upward move. This analysis will be updated!
Please support me with your likes and comments to motivate me to share more analysis with you and share your opinion about the possible trend of this chart with me !
Best Regards , Arman Shaban

Bitcoin Weekly Analysis: Key Levels and Scenarios (READ CAPTION)By analyzing the Bitcoin chart on the weekly (logarithmic) timeframe, we see that recently Bitcoin corrected to $64,000. After that, BTC experienced renewed demand and is currently trading around $66,000. There are two potential scenarios for Bitcoin in my opinion:
• The price could start rising from this level, with the next targets being $72,000, $77,000, $85,000, and $100,000.
• The price could correct further to the $52,800 to $56,700 range before rallying again to above $70,000.
Which scenario do you think will happen first?
Please support me with your likes and comments to motivate me to share more analysis with you and share your opinion about the possible trend of this chart with me !
Best Regards , Arman Shaban

SHIB - This Indicator says SELLSHIB has just flashed a dangerous "SELL" alert.
This indicator is highly accurate in higher timeframes, especially the weekly. Look at all the "SELL" signals and how far the price drops after:
From a trendline perspective, SHIB HAS to stay ABOVE the current support line (Fibonacci line 0.236). If it falls under, SHIBA will be at risk of falling to the dotted line, which is BEARISH.
In case you missed it, my take on Bitcoin for the SHORT TERM:
________________________
BINANCE:SHIBUSDT

GTAI/USDT 4-Hour Chart Analysis : +20% So far , What's Next ?By analyzing the GTAI/USDT chart on the 4-hour timeframe, we observed that the price entered the expected demand zone right after our previous analysis and increased by 20% to reach 1.1910. Now, the price has re-entered the demand zone, and with support between $1.00 and $1.05, we can anticipate another rally for this cryptocurrency. The next targets are $1.088, $1.19, $1.28, and $1.41, respectively.
Please support me with your likes and comments to motivate me to share more analysis with you and share your opinion about the possible trend of this chart with me !
Best Regards , Arman Shaban

SHIBSHIB sweep the swing low to moving upside. Shib chart showing some upside movements.
So SHIB moving upside possible. SHIB reach 0.00001920 usdt to moving downside possible.

it's the time to start the BULLRUN for SHIBA INUBINANCE:SHIBUSDT finished the wave 4 of Elliott 5 waves & now we are at the start of wave 5 & targets on the chart.
Let's start the BULLRUN for SHIBA INU

$SHIB the memecoin for this cycle?My thesis for this next move higher is that Solana coins are done and Ethereum coins are in.
Because of that, I think SEED_DONKEYDAN_MARKET_CAP:BONK sees one more exit pump and then CRYPTOCAP:SHIB becomes the memecoin for this cycle (Ethereum based).
I think there's a possibility of one more retest of the lower support before the move higher starts, but once it does, I think there's 15x upside potential to the top resistance.
Let's see what happens.
SHIB Daily LongIt seems that CRYPTOCAP:SHIB can correct up to the specified range. The market has taken a corrective downward trend in recent days and there is no good reason for the market to become bullish. What it seems is that this time and price break is necessary for the market to continue its upward trend.

SHIB: buy📊Analysis by AhmadArz:
🔍Entry: 1875
🛑Stop Loss: 1728
🎯Take Profit: 2009 - 2137 - 2334
🔗"Uncover new opportunities in the world of cryptocurrencies with AhmadArz.
💡Join us on TradingView and expand your investment knowledge with our five years of experience in financial markets."
🚀Please boost and💬 comment to share your thoughts with us!

$SHI / USDT bullish wave coming soon. Be ready!CRYPTOCAP:SHIB is in a bullish pennant flag that is about to break out to the upside. It is a beautiful flag with a huge pole, perfectly executed.
The Fibonacci retracement is giving us the target price (TP) with 100% potential.
Just follow the chart; it is pretty obvious. The Stochastic RSI is about to pump on the daily chart.
Everything is aligned for a bullish wave.
DYOR (Do Your Own Research), as anything can happen. This is my personal opinion, not investment advice.

Trading Analysis of Shiba Inu (SHIBA) - 4 Hour timeframeTrading Analysis of Shiba Inu ( COINBASE:SHIBUSD SHIUSD) - 4 Hour timeframe
Overall Trend:
Downtrend: The price being below the 50, 100, and 200-period moving averages since June 7th suggests a strong downtrend.
Short-term movement:
Difficult to assess: A 4-hour timeframe doesn't provide enough information to definitively say if there's a current uptick or just a small consolidation within the downtrend.
Volume:
High Volume: The volume of 140 billion is significantly higher than usual, which could indicate increased selling pressure or potentially a buying opportunity depending on price action.
Momentum Indicators:
RSI (30.00 - 40.00) : This indicates oversold territory. Oversold readings suggest the asset might be undervalued based on recent price movements, but they don't guarantee an immediate rebound.
MACD: The MACD signals being below the histogram since June 7th confirms the downtrend in momentum.
Summary:
The technical analysis of SHIBA on a 4-hour timeframe leans bearish. The downtrend, high volume, oversold RSI, and MACD below the histogram suggest continued selling pressure. However, due to the limited timeframe, it's difficult to say for sure if there's a short-term reversal or just a pause in the downtrend.
Here are some additional things to consider for a more comprehensive analysis:
Longer timeframes: Analyze daily, weekly, and monthly charts to understand the bigger picture.
News and Events: Look for any recent news or events that might be impacting the price of Shiba Inu.
Market sentiment: Consider the overall sentiment in the cryptocurrency market.
Disclaimer: This analysis is for informational purposes only and should not be considered financial advice. Always do your own research before making any investment decisions in cryptocurrency, as the market is highly volatile.
"In this business if you're good, you're right six times out of ten. You're never going to be right nine times out of ten. I've found that when the market's going down and you buy funds wisely, at some point in the future you will be happy. You won't get there by reading: "Now is the time to buy".

GTAI/USDT 4-Hour Chart Analysis : Bulls Are Coming Back ? (READ)Upon analyzing the GTAI/USDT chart in the 4-hour timeframe, we notice that after the price broke through the liquidity above $1.24, it began a correction phase. Currently, it is trading around $1.055.
Key Insight: The $0.98 to $1.02 range is a crucial zone to watch for a potential BUY position.
Potential Targets:
First target: $1.1165
Second target: $1.2240
Third target: $1.28
Stay tuned for further updates!
Please support me with your likes and comments to motivate me to share more analysis with you and share your opinion about the possible trend of this chart with me !
Best Regards , Arman Shaban

Shiba is currently well-positioned for growthIn the daily chart of Shiba, positive divergence is visible across multiple indicators. This suggests that Shiba is in an excellent position to experience significant growth from this area. Positive divergence occurs when the price makes lower lows, but indicators like RSI and MACD make higher lows, signaling weakening bearish momentum and a potential upward reversal.
Shiba is currently well-positioned for growth. If Bitcoin and the broader market conditions remain stable, Shiba could see considerable growth from this range.

Shiba Inu (SHIB): where to next? | 10.06Shiba Inu has failed to hold the 100 EMA support level and has opened below it during this trading session. The fact that the price of the meme token is moving below this moving average raises substantial concerns and may be a negative signal for investors. The next support level for the asset is not far away but is located below a crucial resistance level.
The Shiba Inu chart shows a bearish trend as it tries to stabilize above the 100 EMA. If selling pressure gets more intense, the price may approach the next major support at $0.000019, as indicated by the break below this support level.
For SHIB this area will be crucial because it has the potential to either provide a base for a rebound or, in the event that it is breached, to cause further declines. There are bearish signals being displayed by technical indicators such as the RSI. The fact that the RSI is currently in close proximity to the oversold area suggests that the selling pressure might continue.
Nevertheless, if buyers intervene to take advantage of the lower prices, the oversold situation also creates the chance of a brief rebound. The volume profile indicates a decline in trading activity in comparison to earlier sessions. In a downtrend, lower volume usually signals waning buying interest, which may make it difficult for SHIB to stage a significant comeback anytime soon.
A more pessimistic outlook for the meme token is further supported by the declining volume, which suggests that investors are distancing themselves from the token. A rebound may be imminent if SHIB is able to maintain this level and show signs of strength, suggesting that the worst of the selling may have passed.
WHITEBIT:SHIBUSDT

Notcoin is goin to flip SHIB this yearGETTEX:NOT has revoked the rights to the token.
This means that from now on, the supply (total number of coins) cannot be increased.
Do you have Notcoin❓
