SHIBUSDT bouncing off of weekly support to daily resistanceThe weekly support is defending the price very well. The first dip to this support produced a strong bounce and then price retraced to this support again and again and every time the price has bounced from this support. This suggests that the price may aim for the daily resistance from here.
Shibainu

Shiba Inu SHIB Price Target after the U.S. CFTC sued BinanceBinance and its CEO, CZ, are being sued in the US by Commodity Market Regulators in a complaint that claims the defendants committed “wilful evasion of US law”.
This comes after the SEC Charged Crypto Entrepreneur Justin Sun and his Companies for Fraud and Other Securities Law Violations last week.
Binance is responsible for 61.8% of the global crypto trading. Its Market Share is Huge!
I assume we are about to witness a major selloff in the crypto industry.
My SHIB Shiba Inu Price Targets:
SHIB/USDT shot
Entry Range: $0.00001000 - 0.00001100
Price Target 1: $0.00000950
Price Target 2: $0.00000870
Price Target 3: $0.00000800
Stop Loss: $0.00001250

BITCOIN 1W important zone According to the chart, in the weekly time frame, we see an important resistance area, and if this area is broken, we expect the price to increase, otherwise, the market may fall in the following weeks.
Its not Buy or Sell SIGNAL
DYOR
BY : M.TeriZ - @AtonicShark

SHIBUSDTAs you can see, we have a great downward trendline. Soon this trendline will break, but I think we will have a fake break before that.
So, if there is a Break, it is better to enter the trade with confirmation. In my opinion, if a Break happens, it will be a fake and we will soon return to the lower support.

Can DOGEUSD deliver another 3000%?looking at the log chart of past fractals we could be about to see a nice final wave 5 push up.
if this follows previous trends the potential would be for an additional 3000% from the current price, launching the doge from $0.20 to $6 (or more)
for this to happen the yellow diagonal trend line needs to hold as support and it is impressive that the price has consolidated above whilst the rsi has had time to 'cool' down ready for another run.
also the nearing fib circle could act as a form of resistance when the doge tries to move and strangely signals March '22 as a full moon or full reversal timezone (pending how price reacts to the fib circle when next challenged)
talking fib circles the upper circle pushes the potential upside beyond 3000% / $6

SHIB longSHIB bounced off the ascending trendline. Asset broke trough the descending trendline. Bullish movement to resistance level at 0.0000117 is expected to happen.

SHIB - symmetrical triangle patternThe Shiba moves in a triangle. More movement is likely after the breakout.
The targets are the following resistance zones.
Good trading!
If you find it useful, like, follow, share!

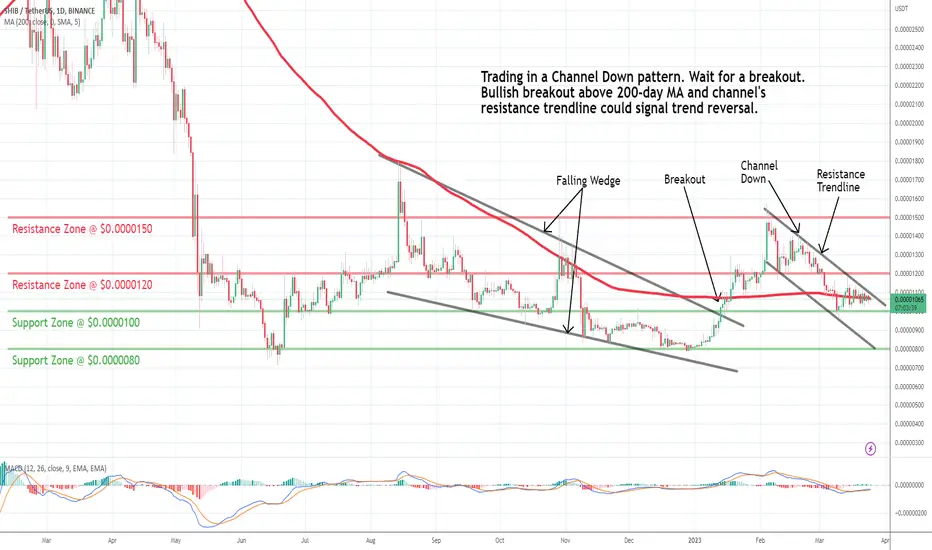
SHIB: Channel DownShiba Inu (SHIB) technical analysis:
Trade setup : Trading in a Channel Down pattern. Wait for a breakout. Bullish breakout above 200-day MA and channel’s resistance trendline could signal trend reversal. Price needs to regain that 200-day MA and $0.000012 levels to resume Uptrend.
Pattern : Price is trading in a Channel Down pattern. With emerging patterns, traders who believe the price is likely to remain within its channel can initiate trades when the price fluctuates within its channel trendlines. With complete patterns (i.e. a breakout) – initiate a trade when the price breaks through the channel’s trendlines, either on the upper or lower side. When this happens, the price can move rapidly in the direction of that breakout.
Trend : Downtrend on Short- and Medium-Term basis and Uptrend on Long-Term basis.
Momentum is Mixed as MACD Line is above MACD Signal Line (Bullish) but RSI < 45 (Bearish).
Support and Resistance : Nearest Support Zone is $0.000010, then $0.000008. The nearest Resistance Zone is $0.000012 (previous support), then $0.0000150.
Long shib If shib save moving average 200 in day timeframe have a good pump i think
it's not financial advice

Shibinu . Technical analyst Shiba is trying to break the resistance and it will be clear soon, and at this price, there is a lot of time and the probability of breaking the resistance is high. And the start of the big pump

SHIB analysisLooking forward to a nice explosive move down the slope
The goals are specified in the chart

SHIBUSDT hit weekly support and likely head up for resistancePrice has hit the weekly support and expect a bounce here and aim for the resistance zone above. A long is favorable here.

SHIBUSDT may pull back after a good bounce from weekly supportHow about giving this short a chance. It seems the price may want to visit at least the green zone under after such a strong bounce from weekly support. It is a tight call but probability is in our favor though not that strong.

🔥TAKE A CLOSER LOOK AT SHIB BEFORE IT GOES TO HIGHS🔥Hi, friends SHIB still doesn't show it's potential but I think the pump will begin very soon. Here is an entry point and 3 targets for SHIB.
📊 TRADING PLAN FOR SHIB:
1. squeeze to the trendline
2. buy orders on DOM and Footprint scalping tools which help to track the whales
3. bullish BTC or consolidation at least
🚩 BTC updates the highs, but altcoins close to its bottom. That's mean that alts accumulate the power to explode when BTC reach the local highs and start to consolidate there.
✅ THE MAIN TARGETS FOR SHIB:
🔥 $0.00012-125 - the value area and strong resistance
🔥 $0.00014 - the key level
🔥 $0.000175 - the key level and local high
I think that the local high will be the highest price only if Elon don't start to pump memecoins (DOGE, FLOKI, SHIB) again.
💻Friends, press the "boost"🚀 button, write comments, and share with your friends - it will be the best THANK YOU.
P.S. Personally, I open an entry if the price shows it according to my strategy.
Always do your analysis before making a trade.

SHIBUSDT likely to head down to weekly support around 0.00001026The price is trading below the daily support currently. Let us try a short here as it seems favorable and target the weekly support zone around 0.00001026.

Shibainu, technical analyst Hello to all ... Shiba is stuck in this triangle, but it can grow well after leaving it.

shib target clear breakout ////PLS MAKE ANALYSE BEFORE DO YOUR TRRADE WISELY I AM GO TO LONG TRADE X10 RIGHT NOW .STOP LOSS 0.00000103 target 1 0.013100
guy shib is happening in this year


shibusdhey everyone...
shib is picking up from the support around 0.00001036... with shib coin burned this morning, we could see a bullish movement, making the coin jump to next resistance level of 0.00002014... in long run it is possible for shib to scratch more zero.. as the circulating supply decrease
high possibility for shib to be bullish in coming week as Eth is break the resistance trendline and reaching near 2000
good luck

✴️ Shiba Inu Back On The Green? Patience Is Key! Easy 70%The correction definitely ended 10-March but this market is taking its time to recover, why?
We are set to experience long-term growth.
Shiba Inu (SHIBUSDT) is set to grow for the long-term.
That's why it is taking its time to recover because the longer the consolidation phase, the stronger the growth that follows when it takes place.
✔️ We can see the downtrend from the early Feb. high already broke.
✔️ We can see prices trading above EMA10 and MA200.
✔️ And again, the classic MACD bullish cross.
Over 70% can happen easily and fast on the next jump... But prices can go much, much higher. Patience is key.
Thanks a lot for your continued support.
Namaste.

BONE/USDT - The curves always work?Longing around 0.90-1$ seems reasonable now that Shibarium is getting fudded on twitter.
If the fud will pass which likely will with a bull market environment, we can expect some nice gains.

SHIBUSDT hitting weekly support, a long is favorable hereThe last trade was closed without profit and the price bounced and moved up as expected but remained a bit short of target. Now the price has fell again back to weekly support and a long is favorable here. For a bit better and conservative entry long it when price dips below the weekly support.

BONE is validating shib inu layer2we are bouncing on support and the top of channel is 2.0 great entry here
